The high-performance fiber market is projected to grow from USD 18.6 billion in 2025 to USD 40.2 billion by 2035, at a CAGR of 8.0%. The market growth is driven by increasing demand for lightweight materials in the aerospace, automotive, and wind energy sectors. Aramid fibers will dominate with a 27.5% market share, primarily used for ballistic protection, heat resistance, and tensile strength in demanding applications. The aerospace & defense segment will lead in market share, contributing 28.0%, as demand for fuel-efficient, lightweight structural components continues to grow.
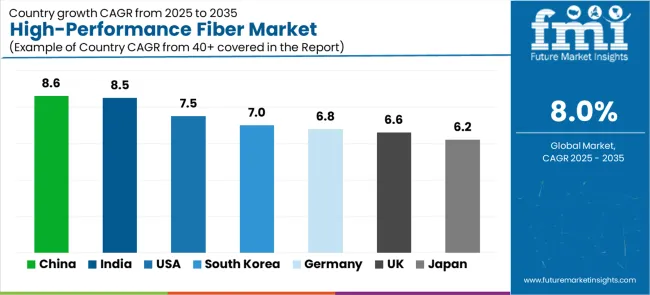
The automotive sector follows closely with 22.0% of market demand, benefiting from electric vehicle lightweighting and high-performance composites for vehicle safety. Wind energy applications account for 9.0%, with high-strength composites needed for turbine blades. Asia Pacific, particularly China (8.6% CAGR) and India (8.5% CAGR), will lead market growth, driven by aerospace expansion and renewable energy projects. In comparison, Germany and the United States show steady growth driven by automotive and aerospace manufacturing, with competition focusing on fiber performance, production efficiency, and environmental sustainability rather than price.
High-performance fibers are used extensively in aircraft components, including fuselages, wings, and interior parts, as well as in personal protective equipment like bulletproof vests. The demand for lightweight, high-strength materials that can withstand extreme conditions continues to increase as the aerospace industry shifts toward more fuel-efficient and environmentally friendly aircraft designs. The ability of high-performance fibers to offer superior strength-to-weight ratios is vital in enhancing aircraft efficiency and performance while reducing overall fuel consumption.
The automotive sector is increasingly turning to high-performance fibers to meet the growing demand for lightweight materials that improve fuel efficiency and reduce emissions. The adoption of advanced composite materials made from high-performance fibers, such as carbon fiber and aramid fibers, is rising in vehicle manufacturing. These fibers are used in body panels, structural components, and interior parts, enabling manufacturers to produce lighter vehicles without compromising strength and safety. The rise of electric vehicles (EVs) and the ongoing push for sustainability in automotive design further bolster the demand for these advanced materials.
As industries continue to focus on lightweight, durable, and sustainable materials, the high-performance fiber market is poised for long-term expansion. Emerging technologies, such as 3D printing and the development of new, more affordable fiber production methods, will likely drive innovation and reduce costs, making these materials more accessible. Furthermore, the continuous evolution of industries such as automotive, aerospace, and construction will further bolster the demand for high-performance fibers in the years to come.
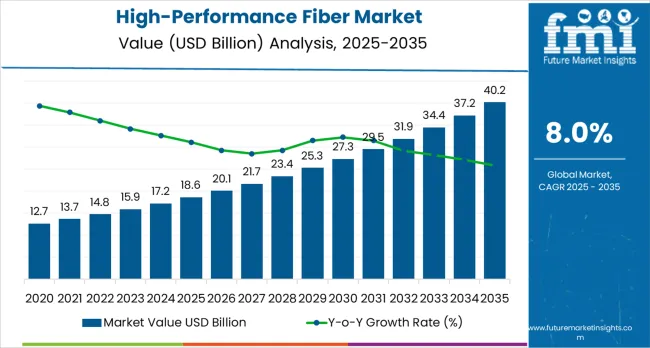
Between 2025 and 2030, the high-performance fiber market is projected to expand from USD 18.6 billion to USD 27.2 billion, resulting in a value increase of USD 8.6 billion, which represents 40.2% of the total forecast growth for the decade. This phase of development will be shaped by rising demand for aerospace and automotive lightweighting applications, product innovation in fiber technologies and composite manufacturing systems, as well as expanding integration with renewable energy and defense modernization initiatives. Companies are establishing competitive positions through investment in advanced fiber formulations, sustainable production solutions, and strategic market expansion across aerospace, automotive, and wind energy applications.
From 2030 to 2035, the market is forecast to grow from USD 27.2 billion to USD 40.2 billion, adding another USD 12.8 billion, which constitutes 59.8% of the overall ten-year expansion. This period is expected to be characterized by the expansion of specialized fiber systems, including advanced composite formulations and integrated material solutions tailored for specific industry requirements, strategic collaborations between fiber manufacturers and end-user industries, and an enhanced focus on production efficiency and environmental sustainability. The growing emphasis on performance optimization and sustainable manufacturing processes will drive demand for advanced, high-performance fiber solutions across diverse industrial applications.
| Metric | Value |
|---|---|
| Market Value (2025) | USD 18.6 billion |
| Market Forecast Value (2035) | USD 40.2 billion |
| Forecast CAGR (2025 to 2035) | 8.0% |
The high-performance fiber market grows by enabling manufacturers to achieve superior strength-to-weight ratios and exceptional material performance in various applications, ranging from aerospace components to automotive structures. Industrial manufacturers face mounting pressure to improve product performance and fuel efficiency, with high-performance fiber solutions typically providing 30-50% weight reduction compared to traditional materials, making these fibers essential for competitive manufacturing operations.
The aerospace industry's need for maximum fuel efficiency and structural performance creates demand for advanced fiber solutions that can minimize weight, enhance durability, and ensure consistent performance across diverse operating conditions.
Government initiatives promoting renewable energy adoption and defense modernization drive adoption in aerospace, automotive, and wind energy applications, where material performance has a direct impact on operational efficiency and safety outcomes. However, high production costs and the complexity of achieving consistent fiber quality across different manufacturing processes may limit adoption rates among cost-sensitive manufacturers and developing regions with limited technical expertise.
The market is segmented by product type, application, form, and region. By product type, the market is divided into aramid fibers, carbon fiber, UHMWPE/Other PE, high-performance glass, and others. Based on application, the market is categorized into aerospace &defense, automotive, wind energy, sports &leisure, construction &industrial, medical textiles, and others.
By form, the market is segmented into composites/prepregs, continuous filament/tow, staple/yarn/fabrics, and other forms. Regionally, the market is divided into Asia Pacific, Europe, North America, and other key regions.
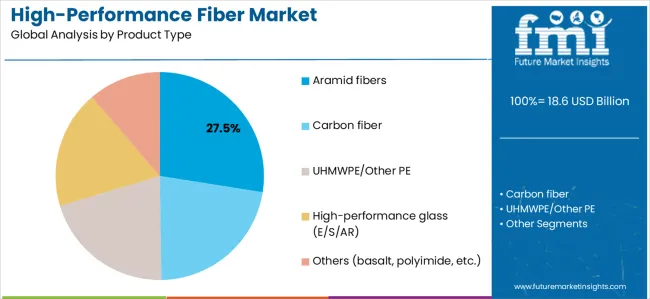
The aramid fibers segment represents the dominant force in the high-performance fiber market, capturing approximately 27.5% of total market share in 2025. This advanced technology category encompasses formulations featuring para-aramid (17.0%) and meta-aramid (10.5%) variants that enable superior heat resistance, ballistic protection, and exceptional tensile strength characteristics. The aramid segment's market leadership stems from its exceptional performance capabilities, with fibers capable of withstanding temperatures exceeding 500°C while maintaining structural integrity and chemical resistance across diverse operating conditions.
The carbon fiber segment maintains a substantial 24.0% market share, serving manufacturers who require ultra-high strength and stiffness for aerospace and automotive applications. These formulations offer reliable performance for advanced composite structures while providing sufficient rigidity to meet demanding engineering requirements in commercial aircraft and performance vehicles.
Key technological advantages driving the aramid segment include:
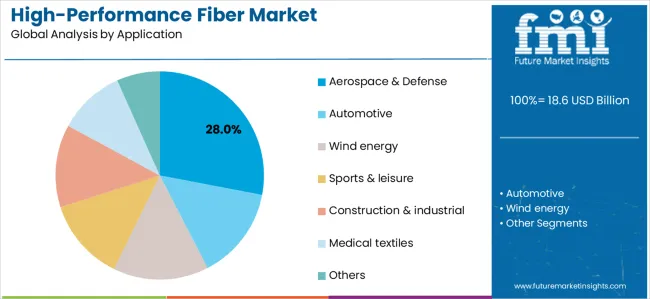
Aerospace &defense applications dominate the high-performance fiber market with approximately 28.0% market share in 2025, reflecting the critical role of advanced fibers in maximizing aircraft performance and supporting global defense modernization initiatives. The aerospace segment's market leadership is reinforced by accelerating commercial aircraft production, military equipment upgrades, and rising demand for lightweight structural components that directly correlate with fuel efficiency and operational range.
The automotive segment represents the second-largest application category, capturing 22.0% market share through specialized requirements for vehicle lightweighting, electric vehicle battery protection, and high-performance composites. This segment benefits from growing demand for materials that meet stringent safety, durability, and weight reduction requirements in next-generation mobility solutions.
The wind energy segment accounts for 9.0% market share, serving turbine blade manufacturers requiring high-strength composites for longer blade designs. The sports &leisure segment captures 8.0% market share through performance equipment applications, while construction &industrial represents 21.0% of the market. Medical textiles account for 4.0% through surgical implants and biocompatible applications.
Key market dynamics supporting application growth include:
The market is driven by three concrete demand factors tied to performance optimization outcomes. First, aerospace and defense sector growth creates increasing demand for high-performance lightweight solutions, with global aerospace industry revenues exceeding USD 955 billion in 2023 and defense budgets expanding across major economies worldwide, requiring specialized fiber solutions for maximum fuel efficiency and operational capability.
Second, automotive electrification and lightweighting initiatives drive adoption of superior composite materials, with manufacturers seeking 30-40% weight reduction to improve electric vehicle range and meet stringent emissions regulations. Third, technological advancements in fiber chemistry and composite manufacturing enable more effective and durable material solutions that reduce lifecycle costs while improving long-term performance and sustainability outcomes.
Market restraints include raw material price volatility that can impact production costs and profitability margins, particularly during periods of petrochemical market disruption or precursor material supply constraints affecting key production inputs. Technical complexity in fiber manufacturing poses another significant challenge, as achieving consistent tensile strength and modulus across different production batches requires specialized expertise and quality control systems, potentially causing production delays and increased manufacturing costs.
Environmental regulations and recycling challenges create additional complexity for manufacturers, demanding ongoing investment in sustainable formulations and end-of-life management systems that comply with varying regional environmental standards.
Key trends indicate accelerated adoption in Asia-Pacific markets, particularly China and India, where rapid aerospace development and renewable energy deployment drive comprehensive high-performance fiber system development. Technology advancement trends toward nanotechnology integration with enhanced strength, multi-functional capabilities, and bio-based precursors enable next-generation product development that addresses multiple performance requirements simultaneously.
However, the market thesis could face disruption if alternative lightweight materials or significant changes in manufacturing technologies minimize reliance on traditional high-performance fiber solutions.
| Country | CAGR (2025-2035) |
|---|---|
| China | 8.6% |
| India | 8.5% |
| United States | 7.5% |
| Germany | 6.8% |
| South Korea | 7.0% |
| United Kingdom | 6.6% |
| Japan | 6.2% |
The high-performance fiber market is gaining momentum worldwide, with China taking the lead thanks to massive aerospace manufacturing expansion and government-backed advanced materials modernization programs. Close behind, India benefits from growing defense offsets, space programs, and wind energy installations, positioning itself as a strategic growth hub in the Asia-Pacific region. The United States shows steady advancement, where robust aerospace procurement and commercial aircraft production ramp-up strengthen its role in the global supply chain.
Germany demonstrates consistent progress through premium automotive platforms adopting carbon fiber reinforced plastics and aramid hybrids for next-generation vehicles. Meanwhile, South Korea stands out for its battery, electronics, and mobility composites demand, and the United Kingdom and Japan continue to record consistent progress in aerospace cluster recovery and high-end carbon fiber leadership respectively. Together, China and India anchor the global expansion story, while other nations build stability and diversity into the market's growth path.
The report covers an in-depth analysis of 40+ countries;7 top-performing countries are highlighted below.
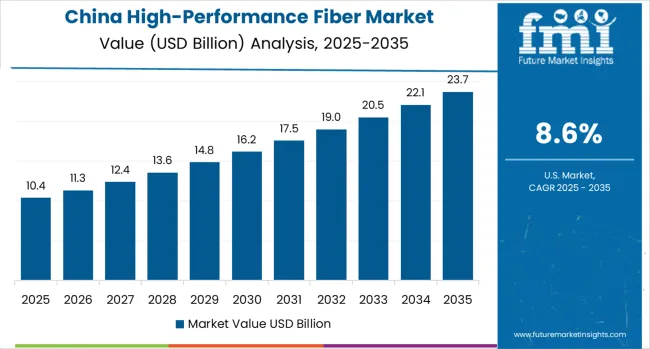
China demonstrates the strongest growth potential in the High-Performance Fiber Market with a CAGR of 8.6% through 2035. The country's leadership position stems from massive aerospace projects, government-backed manufacturing modernization programs, and aggressive electric vehicle production targets, driving the adoption of high-performance fiber systems.
Growth is concentrated in major manufacturing regions, including Guangdong, Jiangsu, Zhejiang, and Shandong, where aerospace manufacturers and automotive companies are implementing advanced composite solutions for enhanced product performance and international competitiveness.
Distribution channels through established chemical suppliers and direct manufacturer relationships expand deployment across aircraft manufacturing facilities and electric vehicle production lines. The country's Made in China 2025 strategy provides policy support for advanced materials development, including high-performance fiber system adoption.
Key market factors:
In Mumbai, Bangalore, Chennai, and Hyderabad, the adoption of high-performance fiber systems is accelerating across aerospace manufacturing facilities and automotive production centers, driven by defense modernization targets and government Make in India initiatives.
The market demonstrates strong growth momentum with a CAGR of 8.5% through 2035, linked to comprehensive aerospace capacity expansion and increasing focus on indigenous manufacturing solutions. Indian manufacturers are implementing advanced fiber systems and composite platforms to enhance product performance while meeting growing demand for defense equipment and commercial vehicles in domestic and export markets.
The country's defense procurement policies create sustained demand for high-performance fiber solutions, while increasing emphasis on local production drives adoption of advanced materials and manufacturing technologies.
Germany's advanced manufacturing industry demonstrates sophisticated implementation of high-performance fiber systems, with documented case studies showing 30% weight reduction in automotive applications through optimized carbon fiber solutions.
The country's manufacturing infrastructure in major industrial centers, including North Rhine-Westphalia, Bavaria, Baden-Württemberg, and Lower Saxony, showcases integration of advanced fiber technologies with existing production systems, leveraging expertise in automotive engineering and precision manufacturing.
German manufacturers emphasize quality standards and environmental compliance, creating demand for high-performance fiber solutions that support sustainability initiatives and regulatory requirements. The market maintains steady growth through focus on technology innovation and export competitiveness, with a CAGR of 6.8% through 2035.
Key development areas:
Brazil's market expansion is driven by diverse aerospace demand, including commercial aircraft manufacturing in São Paulo, automotive development in Rio Grande do Sul and Paraná, and comprehensive industrial modernization across multiple regions.
The country demonstrates promising growth potential with a CAGR of 4.3% through 2035, supported by Embraer's aerospace programs and regional automotive industry initiatives. Brazilian manufacturers face implementation challenges related to import dependency and technical expertise availability, requiring technology transfer approaches and international partnership support.
However, growing aerospace production and automotive competitiveness requirements create compelling business cases for high-performance fiber system adoption, particularly in commercial aircraft manufacturing regions where weight optimization has a direct impact on fuel efficiency.
Market characteristics:
The USA market leads in advanced fiber innovation based on integration with next-generation aerospace technologies and sophisticated defense applications for enhanced performance characteristics. The country shows solid potential with a CAGR of 7.5% through 2035, driven by commercial aircraft production ramp-up and defense modernization programs across major industrial regions, including Washington, Texas, South Carolina, and California.
American manufacturers are adopting advanced fiber systems for weight reduction and performance optimization, particularly in states with aerospace clusters and defense contractors requiring superior material differentiation. Technology deployment channels through established composite manufacturers and direct aerospace relationships expand coverage across aircraft production and military equipment facilities.
Leading market segments:
In England, Scotland, Wales, and Northern Ireland, manufacturing facilities are implementing high-performance fiber solutions to enhance aerospace system performance and improve manufacturing competitiveness, with documented case studies showing significant weight savings in aircraft structures through optimized composite applications.
The market shows moderate growth potential with a CAGR of 6.6% through 2035, linked to aerospace cluster development programs, defense equipment modernization projects, and emerging advanced manufacturing initiatives.
British manufacturers are adopting advanced fiber and composite systems to enhance product performance while maintaining quality standards demanded by UK aerospace regulations and international export markets. The country's established aerospace industry creates sustained demand for technology upgrade solutions that integrate with existing manufacturing systems.
Market development factors:
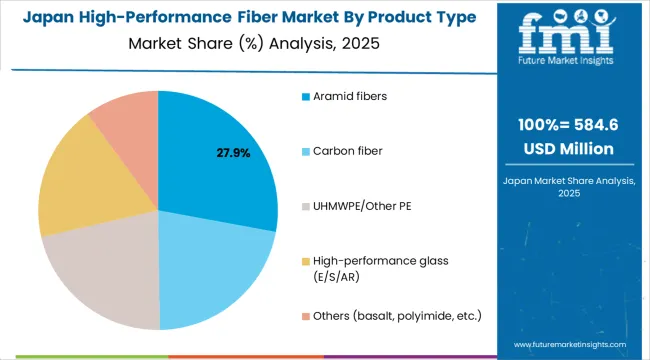
Japan's High-Performance Fiber Market demonstrates sophisticated implementation focused on precision engineering and quality excellence optimization, with documented integration of advanced fiber systems achieving superior tensile strength performance across aerospace and sporting goods applications.
The country maintains steady growth momentum with a CAGR of 6.2% through 2035, driven by manufacturers'emphasis on quality standards and continuous improvement methodologies that align with lean manufacturing principles applied to materials processing operations.
Major industrial regions, including Kanto, Kansai, Chubu, and Kyushu, showcase advanced deployment of high-modulus carbon fiber platforms where systems integrate seamlessly with existing quality control systems and comprehensive manufacturing management programs.
Key market characteristics:
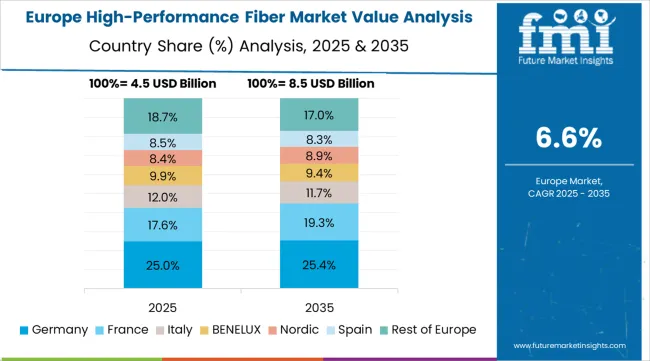
The high-performance fiber market in Europe is projected to grow from USD 5.6 billion in 2025 to USD 10.4 billion by 2035, registering a CAGR of 6.6% over the forecast period. Germany is expected to maintain its leadership position with a 21.4% market share in 2025, supported by its extensive automotive and aerospace manufacturing infrastructure and major industrial centers, including Munich, Stuttgart, and Hamburg production facilities.
The United Kingdom follows with a 16.1% share in 2025, projected to reach 16.3% by 2035, driven by comprehensive aerospace cluster development programs and advanced manufacturing initiatives implementing fiber technologies. France holds a 14.3% share in 2025, expected to maintain 14.4% by 2035 through ongoing aerospace facility upgrades and composite technology development.
Italy commands a 10.7% share, while Spain accounts for 7.1% in 2025. The Rest of Europe region is anticipated to gain momentum, expanding its collective share from 13.4% to 12.5% by 2035, attributed to increasing high-performance fiber adoption in Nordic countries and emerging Eastern European aerospace facilities implementing advanced materials programs.
The Japanese High-Performance Fiber Market demonstrates a mature and quality-focused landscape, characterized by sophisticated integration of carbon fiber systems with existing precision manufacturing infrastructure across aerospace production facilities, sporting goods manufacturers, and specialized composite application centers.
Japan's emphasis on manufacturing excellence and quality standards drives demand for high-reliability fiber solutions that support continuous improvement initiatives and statistical process control requirements in precision manufacturing operations.
The market benefits from strong partnerships between international aerospace companies like Boeing, Airbus, and domestic fiber leaders, including Toray Industries, Teijin Limited, and Mitsubishi Chemical Corporation, creating comprehensive service ecosystems that prioritize fiber consistency and application precision programs.
Manufacturing centers in Tokyo, Osaka, Nagoya, and other major industrial areas showcase advanced quality control implementations where fiber systems achieve superior consistency through integrated monitoring programs.
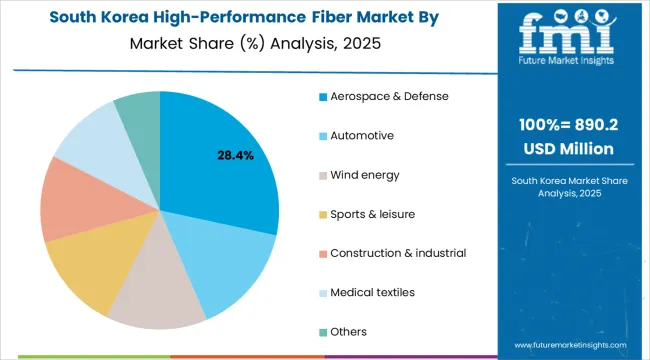
The South Korean High-Performance Fiber Market is characterized by strong domestic technology provider presence, with companies like Hyosung Advanced Materials and Kolon Industries maintaining significant positions through comprehensive system integration and technical services capabilities for electronics manufacturing and automotive applications.
The market is demonstrating growing emphasis on advanced materials development and high-performance capabilities, as Korean manufacturers increasingly demand customized solutions that integrate with domestic advanced manufacturing infrastructure and sophisticated quality control systems deployed across Samsung, LG, and other major industrial complexes.
Local fiber companies and regional specialty manufacturers are gaining market share through strategic partnerships with global aerospace and automotive companies, offering specialized services including Korean market customization and technical support programs for precision applications.
The competitive landscape shows increasing collaboration between multinational fiber companies and Korean technology specialists, creating hybrid service models that combine international materials expertise with local manufacturing knowledge and quality management systems.
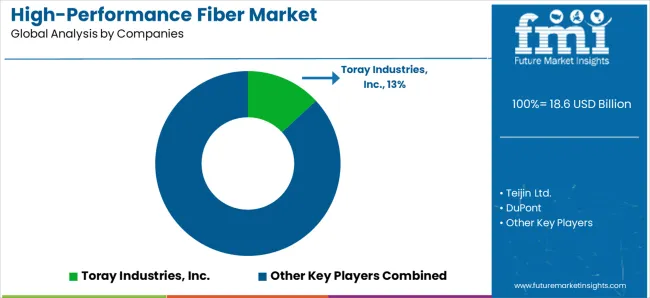
The high-performance fiber market is composed of 12–16 key players, with the top five companies commanding 55–60% of global market share, driven by their advanced manufacturing capabilities, broad product offerings, and strong relationships with industries like aerospace, automotive, defense, and industrial applications. Competition is centered on fiber strength, weight-to-performance ratios, customization, and product consistency, rather than price alone. Toray Industries, Inc. leads the market with an 13% share, supported by its cutting-edge research and development, state-of-the-art manufacturing facilities, and long-term collaborations in high-performance applications such as aerospace, automotive, and sports equipment.
Market leaders such as Toray Industries, Teijin Ltd., DuPont, Honeywell International, and Hexcel Corporation maintain dominance through their innovative fiber technologies, including carbon fiber, aramid, and polyimide fibers, which offer superior strength, durability, and heat resistance. These companies leverage their global manufacturing networks, research investments, and application-specific solutions to maintain a competitive edge in the market. Their ability to meet demanding specifications for industries requiring lightweight, high-strength materials, such as aerospace and defense, positions them as key players in this segment.
Challengers including SGL Carbon, Mitsubishi Chemical Group, Kolon Industries, and Avient Protective Materials focus on niche applications and regional markets, offering specialized solutions for specific industrial needs. Emerging players like Hyosung Advanced Materials, Owens Corning, and Solvay also bring innovation in the form of eco-friendly fibers, functional coatings, and advanced composites, further intensifying competition in high-performance fiber applications across various sectors.
High-performance fibers represent specialized engineered materials that enable manufacturers to achieve 30-50% weight reduction compared to traditional materials, delivering superior strength-to-weight ratios and exceptional performance with tensile strengths exceeding 3,000 MPa in demanding applications.
With the market projected to grow from USD 18.6 billion in 2025 to USD 40.2 billion by 2035 at an 8.0% CAGR, these fiber systems offer compelling advantages-enhanced fuel efficiency, customizable mechanical properties, and environmental durability-making them essential for aerospace applications (28.0% market share), automotive lightweighting (22.0% share), and wind energy seeking alternatives to conventional materials that compromise performance through excessive weight.
Scaling market adoption and technological advancement requires coordinated action across aerospace policy, automotive standards development, fiber manufacturers, application industries, and materials science investment capital.
Aerospace &Defense Integration: Include high-performance fiber requirements in military procurement standards, provide tax incentives for manufacturers using advanced composite materials, and establish domestic production capabilities for specialty fibers that reduce import dependencies in critical defense infrastructure.
Materials Science &Innovation Support: Fund research initiatives on next-generation carbon fiber, bio-based precursors, and recyclable composite technologies. Invest in university-industry partnerships that advance fiber chemistry and manufacturing process optimization for aerospace and renewable energy applications.
Manufacturing Development Incentives: Provide grants for establishing fiber production facilities near aerospace and automotive manufacturing centers, offer technical assistance for quality control systems, and support supply chain development that ensures reliable precursor material availability for domestic manufacturers.
Standards &Quality Infrastructure: Establish national testing facilities for fiber performance validation, develop certification programs for composite manufacturing specialists, and create international standards harmonization that facilitates export of fiber-reinforced products to global markets.
Environmental &Sustainability Programs: Promote recyclable fiber formulations through green chemistry initiatives, support end-of-life composite recycling programs, and establish lifecycle assessment frameworks that validate the environmental benefits of lightweight materials through fuel savings.
Performance Standards &Testing: Define standardized measurement protocols for tensile strength, modulus, and elongation across aramid (27.5% market dominance), carbon fiber (24.0% share), and UHMWPE fiber systems, enabling reliable performance comparison and application-specific selection criteria.
Application Best Practices: Develop comprehensive guidelines for fiber application in aerospace manufacturing (28.0% application dominance), automotive production, and wind turbine blade fabrication, ensuring optimal performance and quality consistency across different manufacturing environments.
Technology Integration Standards: Create compatibility frameworks for composite manufacturing equipment, curing systems, and quality control platforms that facilitate seamless integration across different production facilities and fiber application technologies.
Skills Development &Certification: Establish training programs for composite technicians, quality control specialists, and design engineers on advanced fiber technologies, composite manufacturing techniques, and performance optimization methods that ensure manufacturing excellence.
Advanced Fiber Formulations: Develop next-generation aramid and carbon fiber systems with enhanced strength, improved processing characteristics, and multi-functional properties including electrical conductivity and thermal management that provide additional value beyond basic structural capabilities.
Precision Manufacturing Technologies: Provide automated fiber placement equipment with real-time tension monitoring, environmental control systems, and quality assurance platforms that ensure consistent composite fabrication across high-volume aerospace operations while minimizing waste and defects.
Customization &Engineering Services: Offer application-specific fiber development, including aerospace-grade carbon fiber, automotive-optimized aramid systems, and performance-tailored solutions that address unique requirements in defense, wind energy, and sporting goods applications.
Technical Support &Integration: Build comprehensive customer support, including composite design optimization, manufacturing troubleshooting services, and performance validation that help manufacturers achieve maximum weight savings while maintaining structural integrity.
Application-Focused Product Development: Develop specialized fiber lines for aerospace (28.0% market dominance), automotive (22.0% share), and wind energy applications, with formulations optimized for each sector's specific performance requirements and manufacturing conditions.
Geographic Market Strategy: Establish production and technical support capabilities in high-growth markets like China (8.6% CAGR) and India (8.5% CAGR), while maintaining R&D centers in established markets like United States (7.5% CAGR) and Germany (6.8% CAGR) for advanced fiber development and aerospace certification.
Technology Differentiation: Invest in proprietary carbon fiber technologies, ultra-high modulus aramid fibers, and advanced UHMWPE systems that provide superior mechanical performance and enable premium positioning in competitive markets.
Customer Partnership Models: Develop long-term relationships with aerospace manufacturers, automotive OEMs, and wind turbine producers through collaborative product development, performance guarantees, and technical consulting services that strengthen customer loyalty.
Fiber Technology Investment: Finance established fiber companies like Toray Industries, Hexcel Corporation, and Teijin Limited for advanced R&D programs, production capacity expansion, and new fiber grade development that serve growing demand in aerospace and automotive markets.
Manufacturing Infrastructure Development: Provide capital for establishing regional fiber production facilities, automated composite equipment development, and quality control systems that reduce costs while ensuring consistent performance across global manufacturing operations.
Innovation &Materials Science: Back specialty chemical startups developing breakthrough bio-based carbon fiber, recyclable composite technologies, and sustainable precursor materials that enhance performance while addressing environmental concerns and regulatory requirements.
Market Integration &Expansion: Support strategic partnerships between fiber suppliers and aerospace OEMs, finance technology transfer initiatives from research institutions, and enable market consolidation that creates comprehensive advanced materials solution providers serving multiple application segments.
| Item | Value |
|---|---|
| Quantitative Units | USD 18.6 billion |
| Product Type | Aramid fibers (Para-aramid, Meta-aramid), Carbon fiber, UHMWPE/Other PE, High-performance glass (E/S/AR), Others (basalt, polyimide) |
| Application | Aerospace &Defense (Aircraft structures, Military equipment, Space), Automotive, Wind energy, Sports &leisure, Construction &industrial, Medical textiles, Others |
| Form | Composites/Prepregs, Continuous filament/tow, Staple/yarn/fabrics, Other forms |
| Regions Covered | Asia Pacific, Europe, North America, Latin America, Middle East &Africa |
| Countries Covered | China, India, United States, Germany, South Korea, United Kingdom, Japan, and 40+ countries |
| Key Companies Profiled | Toray Industries, Inc., Teijin Ltd., DuPont, Honeywell International, Hexcel Corporation, SGL Carbon, Mitsubishi Chemical Group, Kolon Industries, Avient Protective Materials (Dyneema), Hyosung Advanced Materials, Owens Corning, and Solvay |
| Additional Attributes | Dollar sales by product type, application, and form categories, regional adoption trends across Asia Pacific, Europe, and North America, competitive landscape with fiber producers and technology integrators, manufacturing facility requirements and specifications, integration with aerospace initiatives and renewable energy systems, innovations in fiber technology and composite manufacturing systems, and development of specialized formulations with enhanced performance and sustainability capabilities. |
The global high-performance fiber market is estimated to be valued at USD 18.6 billion in 2025.
The market size for the high-performance fiber market is projected to reach USD 40.2 billion by 2035.
The high-performance fiber market is expected to grow at a 8.0% CAGR between 2025 and 2035.
The key product types in high-performance fiber market are aramid fibers, carbon fiber, uhmwpe/other pe, high-performance glass (e/s/ar) and others (basalt, polyimide, etc.).
In terms of application, aerospace & defense segment to command 28.0% share in the high-performance fiber market in 2025.


Our Research Products

The "Full Research Suite" delivers actionable market intel, deep dives on markets or technologies, so clients act faster, cut risk, and unlock growth.

The Leaderboard benchmarks and ranks top vendors, classifying them as Established Leaders, Leading Challengers, or Disruptors & Challengers.

Locates where complements amplify value and substitutes erode it, forecasting net impact by horizon

We deliver granular, decision-grade intel: market sizing, 5-year forecasts, pricing, adoption, usage, revenue, and operational KPIs—plus competitor tracking, regulation, and value chains—across 60 countries broadly.

Spot the shifts before they hit your P&L. We track inflection points, adoption curves, pricing moves, and ecosystem plays to show where demand is heading, why it is changing, and what to do next across high-growth markets and disruptive tech

Real-time reads of user behavior. We track shifting priorities, perceptions of today’s and next-gen services, and provider experience, then pace how fast tech moves from trial to adoption, blending buyer, consumer, and channel inputs with social signals (#WhySwitch, #UX).

Partner with our analyst team to build a custom report designed around your business priorities. From analysing market trends to assessing competitors or crafting bespoke datasets, we tailor insights to your needs.
Supplier Intelligence
Discovery & Profiling
Capacity & Footprint
Performance & Risk
Compliance & Governance
Commercial Readiness
Who Supplies Whom
Scorecards & Shortlists
Playbooks & Docs
Category Intelligence
Definition & Scope
Demand & Use Cases
Cost Drivers
Market Structure
Supply Chain Map
Trade & Policy
Operating Norms
Deliverables
Buyer Intelligence
Account Basics
Spend & Scope
Procurement Model
Vendor Requirements
Terms & Policies
Entry Strategy
Pain Points & Triggers
Outputs
Pricing Analysis
Benchmarks
Trends
Should-Cost
Indexation
Landed Cost
Commercial Terms
Deliverables
Brand Analysis
Positioning & Value Prop
Share & Presence
Customer Evidence
Go-to-Market
Digital & Reputation
Compliance & Trust
KPIs & Gaps
Outputs
Full Research Suite comprises of:
Market outlook & trends analysis
Interviews & case studies
Strategic recommendations
Vendor profiles & capabilities analysis
5-year forecasts
8 regions and 60+ country-level data splits
Market segment data splits
12 months of continuous data updates
DELIVERED AS:
PDF EXCEL ONLINE
Fiber Optic Probe Hydrophone (FOPH) Market Size and Share Forecast Outlook 2025 to 2035
Fiberglass Centrifugal Fan Market Size and Share Forecast Outlook 2025 to 2035
Fiber to the Home Market Size and Share Forecast Outlook 2025 to 2035
Fiber Based Packaging Market Size and Share Forecast Outlook 2025 to 2035
Fiber Lid Market Forecast and Outlook 2025 to 2035
Fiberglass Tanks Market Size and Share Forecast Outlook 2025 to 2035
Fiber Sorter Market Size and Share Forecast Outlook 2025 to 2035
Fiber Reinforced Polymer Panel and Sheet Market Size and Share Forecast Outlook 2025 to 2035
Fiber Optic Tester Market Size and Share Forecast Outlook 2025 to 2035
Fiber Laser Market Size and Share Forecast Outlook 2025 to 2035
Fiberglass Market Size and Share Forecast Outlook 2025 to 2035
Fiber Spinning Equipment Market Size and Share Forecast Outlook 2025 to 2035
Fiber Reinforced Plastic (FRP) Panels & Sheets Market Size and Share Forecast Outlook 2025 to 2035
Fiberglass Fabric Market Size and Share Forecast Outlook 2025 to 2035
Fiber Optic Connectivity Market Size and Share Forecast Outlook 2025 to 2035
Fiber Optic Collimating Lens Market Size and Share Forecast Outlook 2025 to 2035
Fiberglass Duct Wrap Insulation Market Size and Share Forecast Outlook 2025 to 2035
Fiber-Based Blister Pack Market Analysis - Size and Share Forecast Outlook 2025 to 2035
Fiber Optics Testing Market Size and Share Forecast Outlook 2025 to 2035
Fiber Laser Coding System Market Size and Share Forecast Outlook 2025 to 2035

Thank you!
You will receive an email from our Business Development Manager. Please be sure to check your SPAM/JUNK folder too.
Chat With
MaRIA