Reports

- Global Locations -

Headquarters

Future Market Insights, Inc.

Christiana Corporate, 200
Continental Drive, Suite 401,
Newark, Delaware - 19713,
United States

T: +1-845-579-5705

Americas

Future Market Insights, Inc.

616 Corporate Way, Suite 2-9018,
Valley Cottage, NY 10989, United States

T: +1-347-918-3531

MEA

Future Market Insights

1602-6 Jumeirah Bay X2 Tower, Plot No: JLT-PH2-X2A,
Jumeirah Lakes Towers, Dubai,
United Arab Emirates

Europe

Future Market Insights

3rd Floor, 207 Regent Street,
W1B 3HH London
United Kingdom

T: + 44 (0) 20 8123 9659
D: +44 (0) 20 3287 4268

Asia Pacific

Future Market Insights

IndiaLand Global Tech Park, Unit UG-1, Behind Grand HighStreet, Phase 1, Hinjawadi, MH, Pune – 411057, India

Fiber and Specialty Carbohydrate Market Outlook from 2024 to 2034

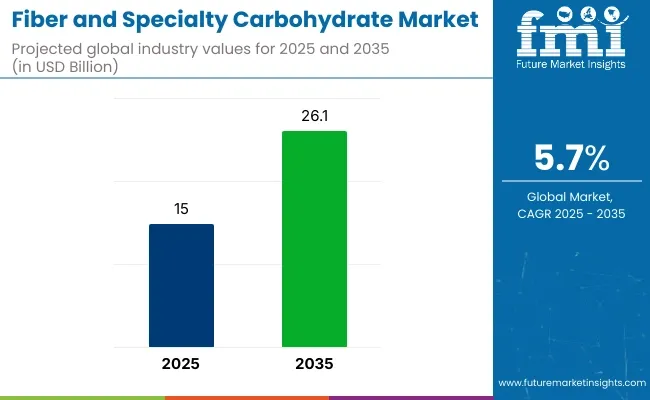
The global fiber and specialty carbohydrate market size is estimated to reach a valuation of US$ 14,191.0 million in 2024. The market is projected to surpass US$ 24,693.2 million by 2034, registering a CAGR of 5.7%.

Key Highlights

  • Growing consumer awareness emphasizes the health benefits of fiber and specialty carbohydrates, targeting digestive health, weight management, and blood sugar control.
  • Increasing demand for functional foods drives the incorporation of fiber and specialty carbohydrates, offering nutritional enhancements beyond basic needs.
  • Surge in lifestyle related diseases prompts interest in fiber and specialty carbohydrates for their perceived positive effects on conditions like obesity, diabetes, and cardiovascular disorders.
  • Consumer preference for natural and clean label products aligns with the market trend, favoring fiber and specialty carbohydrates sourced from natural ingredients.
Attributes Details
Fiber and Specialty Carbohydrate Market Size (2024) US$ 14,191.0 million
Fiber and Specialty Carbohydrate Market Forecasted Size (2034) US$ 24,693.2 million
Projected Value CAGR (2024 to 2034) 5.7%

Don't pay for what you don't need

Customize your report by selecting specific countries or regions and save 30%!

Key Factors Influencing the Fiber and Specialty Carbohydrate Market Growth

Technological Mastery Unleashed! In recent times, significant strides in technology and production methodologies have revolutionized the extraction and integration of fiber and specialty carbohydrates into diverse food and beverage products. The advancements not only drive cost effectiveness but also enhance overall efficiency, marking a transformative era for the industry.

  • Cutting edge technologies enable precise extraction of fiber and specialty carbohydrates, ensuring optimal yields and purity in the final products.
  • Advanced production processes seamlessly incorporate these nutritional elements into a wide array of food and beverage items, fostering versatility in product development.

Revolutionizing Thirst Quenchers! The surge in demand for functional beverages, featuring added fibers and specialty carbohydrates, reflects a paradigm shift in consumer preferences as they increasingly seek healthier alternatives to traditional sugary drinks. The transformative trend is propelled by several factors contributing to the growth of the functional beverages market.

  • Growing consumer awareness about the impact of diet on overall health prompts a shift towards functional beverages as a healthier option compared to sugar laden counterparts.
  • Functional beverages fortified with fibers and specialty carbohydrates cater to health conscious consumers, providing not just refreshment but also added nutritional benefits.

Green Nourishment Revolution! The escalating preference for plant based diets, heightened sustainability consciousness is propelling a surge in demand for fibers, and specialty carbohydrates derived from plant sources, replacing traditional animal based ingredients. The transformative shift is reshaping dietary choices and contributing to the evolution of a more eco conscious and health oriented food industry.

  • The popularity of plant-based diets, driven by health considerations and ethical choices, directs attention toward plant derived fibers and specialty carbohydrates as essential components for balanced nutrition.
  • Aligning with ethical consumer practices, the shift towards plant derived alternatives reflects a desire to reduce the ecological footprint and support environmentally responsible food choices.

Formulation Alchemy, Designing Taste and Nutrition Harmony! Ongoing research and development efforts within the food industry are sparking a revolutionary wave of innovations in product formulations, displaying the art of seamlessly incorporating fibers and specialty carbohydrates into an extensive array of food and beverage products.

The dynamic shift not only meets the rising demand for nutritional enhancements but also successfully navigates the intricate balance of preserving taste and texture, fostering a new era of culinary creativity.

  • Advanced research and development techniques allow for precise control over the integration of fibers and specialty carbohydrates, ensuring optimal nutritional benefits without compromising the sensory aspects of taste and texture.
  • Innovations focus on refining the taste and mouthfeel of food and beverage products, overcoming historical challenges associated with the incorporation of fibers, and delivering a palatable and enjoyable consumer experience.

Obstacles Compressing the Fiber and Specialty Carbohydrate Market Revenue Development

Allergen Alarms, Traversing the Delicate Terrain of Specialty Carbohydrates! The realm of specialty carbohydrates unfurls a nuanced challenge in the form of allergen concerns, as certain sources may evoke allergic reactions in susceptible individuals.

The intricacy not only poses limitations on market expansion but also underscores the need for accessible alternative sources to maintain the delicate balance of inclusivity and safety.

  • Specialty carbohydrates sourced from specific origins may serve as potential allergens, raising concerns about adverse reactions in individuals with allergies to these sources.
  • The presence of allergen triggers can impose constraints on market reach, as consumers with allergies may be hesitant to embrace products containing specialty carbohydrates derived from allergenic sources.
Nandini Roy Choudhury

Principal Consultant

Talk to Analyst

Find your sweet spots for generating winning opportunities in this market.

Historical Fiber and Specialty Carbohydrate Market Statistic Analysis alongside Future Projections

From 2019 to 2023, the global fiber and specialty carbohydrate industry witnessed a surge, boasting a 5.5% CAGR. People became more conscious of what they eat, which translated into a growing demand for products that support their nutritional well being.

Consumers have been showing a preference for clean label products, which basically means they want products with straightforward and natural ingredients. They are drawn to items that are transparent and authentic in their composition. In response, the market has seen a rise in products that proudly display a clean label, meeting the demand for simplicity and naturalness.

Historical CAGR (2019 to 2023) 5.5%
Forecasted CAGR (2024 to 2034) 5.7%

The forecast period 2024 to 2034 is anticipated to show green signs to the market growth. Ongoing research and development is anticipated to play a pivotal role in shaping the market seamlessly, incorporating fiber and specialty carbohydrates into a range of products. The commitment of the market extends beyond just providing nutrition, aiming to elevate the overall sensory experience for consumers.

The global market is anticipated to adapt to changing trends influenced by emerging markets and evolving consumer preferences. The market will adeptly respond to regional demands, staying in sync with the ever changing tastes of consumers worldwide.

Fiber and Specialty Carbohydrate Market Trends and Opportunities

Attributes Details
Trends
  • The rise of e-commerce has opened up new distribution channels for specialty food ingredients, including fibers and specialty carbohydrates. The shift in consumer purchasing habits can create opportunities for market expansion.
  • The synergistic effects of combining fibers with probiotics or prebiotics are gaining attention. Products promoting gut health through a combination of fibers and beneficial microorganisms are becoming popular.
Opportunities
  • Consumer preferences for personalized nutrition are driving the demand for customized and specialty ingredients. Companies are developing tailor made fiber and carbohydrate solutions to meet specific health and taste preferences.
  • The incorporation of fiber and specialty carbohydrates into snack foods is a growing trend, as consumers seek healthier alternatives to traditional snacks. The trend aligns with the demand for on the go and convenient nutritional options.

Get the data you need at a Fraction of the cost

Personalize your report by choosing insights you need
and save 40%!

Comparative Analysis of the Adjacent Fiber and Specialty Carbohydrate Market

The fiber and specialty carbohydrate market addresses human nutrition with a focus on health and wellness trends. The market aligns with the clean label and natural ingredients, providing naturally sourced components that resonate with the clean label preferences of health conscious consumers.

The dietary fibre market is one of the adjacent markets, which is anticipated to be driven by major factors including digestive health emphasis, weight management trends, as well as blood sugar regulation.

On the other hand, the refined functional carbohydrate market has a unique niche in animal nutrition, emphasizing immune system support and gut health in livestock and aquaculture.

Each market reflects the dynamic interplay between scientific advancements, consumer preferences, and industry specific needs, contributing to the overall growth of the carbohydrate market landscape.

Fiber and Specialty Carbohydrate Market:

Differentiating Aspects Fiber and Specialty Carbohydrate Market
CAGR (2024 to 2034) 5.7%
Projected Market Value by 2034 US$ 24,693.2 million
Growth Factor Regulatory support for health claims related to fiber and specialty carbohydrates.
Opportunity Government initiatives promoting healthy eating.
Key Trend Global population growth and urbanization.

Dietary Fibre Market:

Differentiating Aspects Dietary Fibre Market
CAGR (2023 to 2033) 6.7%
Projected Market Value by 2033 US$ 11,543.0 million
Growth Factor Rising health awareness driving consumer preferences towards fiber rich foods.
Opportunity Prevalence of lifestyle diseases are leading consumers to seek dietary solutions that promote better health.
Key Trend The trend towards functional foods and beverages offer additional health benefits beyond basic nutrition.

Refined Functional Carbohydrate Market:

Differentiating Aspects Refined Functional Carbohydrate Market
CAGR (2023 to 2033) 5.7%
Projected Market Value by 2033 US$ 404.8 million
Growth Factor Emphasis on animal nutrition to accelerate the market prospects.
Opportunity Rising livestock production to boost the demand for fiber and specialty carbohydrates.
Key Trend Increase in aquaculture to influence the market growth.

Fiber and Specialty Carbohydrate Market Analysis by Region

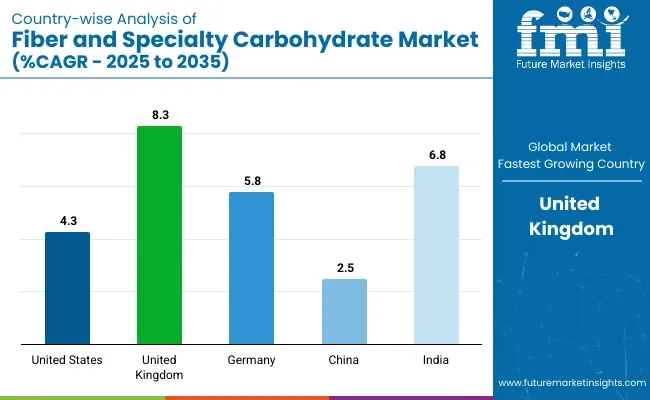
Europe stands out as a dominant force in the fiber and specialty carbohydrate industry. There will be a substantial increase in demand for advanced fiber and specialty carbohydrates in the United Kingdom and Germany. The below table showcases revenues in terms of the top 5 leading countries, which are expected to lead the market through 2034.

Countries Forecasted CAGR (2024 to 2034)
United States 4.3%
United Kingdom 8.3%
Germany 5.8%
China 2.5%
India 6.8%

The United States Health Trend, Fiber and Specialty Carbs Surge

Demand for fiber and specialty carbohydrates in the United States is rising with an anticipated CAGR of 4.3% through 2034. Key factors influencing the demand include,

  • Growing awareness of the importance of a healthy lifestyle and nutrition is driving consumer interest in fiber and specialty carbohydrates, which are frequently associated with various health benefits.
  • The high prevalence of lifestyle related diseases, such as obesity, diabetes, and heart disease, is encouraging consumers to seek out foods that support better health. Fiber and specialty carbohydrates are often perceived as contributors to a healthier diet.

Fitness and Active Lifestyle Trends to Pave the Way in the United Kingdom

The United Kingdom fiber and specialty carbohydrate market is forecasted to inflate at a CAGR of 8.3% through 2034. Top aspects supporting the market growth are,

  • The increasing emphasis on fitness and active lifestyles in the country is driving demand for foods that support physical well being. Fiber and specialty carbohydrates can play a role in providing sustained energy for individuals engaged in regular physical activity.
  • Changes in snacking habits have led to the demand for healthier snack options. Fiber and specialty carbohydrates can be incorporated into snack formulations to enhance nutritional content, contributing to the evolving snacking landscape.

Focus on Digestive Health Boosts the Market Growth in Germany

The demand for fiber and specialty carbohydrates in Germany are estimated to record a CAGR of 5.8% through 2034. Key variables backing up this phenomenon are,

  • German consumers place a strong emphasis on digestive health, and foods that support gut health are gaining popularity. Fiber, especially soluble fiber, and specialty carbohydrates are often associated with digestive health benefits.
  • The adoption of plant based diets is increasing in Germany, aligning with global trends. Fiber rich plant sources and specialty carbohydrates derived from plants are gaining popularity among those adopting a more plant centric diet.

Weight Management Revolution Drives Lightening Product Adoption in China

Adoption of fiber and specialty carbohydrate in China is likely to exhibit a CAGR of 2.5% through 2034. Reasons supporting this rapid adoption include,

  • Government initiatives in China promoting a Healthy China and guidelines for balanced nutrition are likely to influence consumer choices and drive the adoption of foods with added fiber and specialty carbohydrates.
  • Concerns about weight management and a growing interest in fitness are leading Chinese consumers to seek foods that aid in weight control. Fiber rich ingredients contribute to satiety and can support weight management goals.

Rising Middle Class Population in India to Offer New Heights to the Market

The India fiber and specialty carbohydrate market is expected to surge at a CAGR of 6.8% through 2034. Top factors supporting the market expansion include,

  • The expanding middle class population in India has greater purchasing power and an increased focus on health and nutrition. The demographic shift creates opportunities for the market as consumers seek premium and health oriented food products.
  • The growth of e-commerce platforms in India has made specialty food ingredients, including fiber and specialty carbohydrates, more accessible to a wider consumer base. Online shopping convenience is contributing to market expansion.

Fiber and Specialty Carbohydrate Market Analysis by Segment

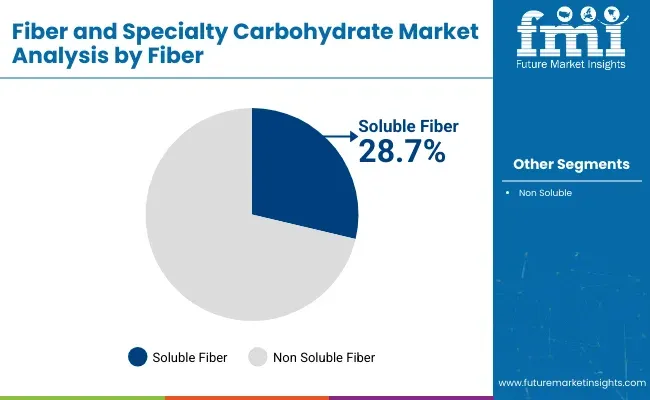
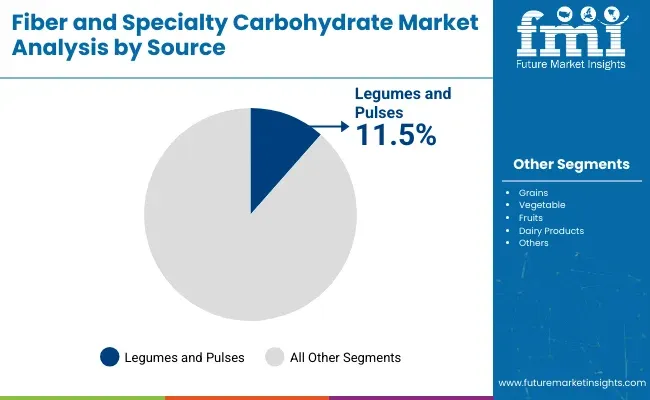
As far as the product type is concerned, the soluble segment is likely to dominate the industry in 2024, accounting for a 28.7% market share. Similarly, the legumes segment is expected to take the lead when considering source, commanding a 11.5% market share in 2024.

Segment Market Share in 2024
Soluble 28.7%
Legumes 11.5%

Soluble Claims High Demand for Fiber and Specialty Carbohydrate

Soluble fibers, such as inulin, pectin, and beta glucans, are known for their ability to dissolve in water, forming a gel like substance. The property helps promote digestive health by supporting regular bowel movements and aiding in the prevention of constipation.

Soluble fibers have been shown to help regulate blood sugar levels by slowing down the absorption of sugar and improving insulin sensitivity, which is particularly important for individuals managing diabetes or those seeking to prevent blood sugar spikes.

Legumes to Hold High Demand for Fiber and Specialty Carbohydrate

Legumes, including beans, lentils, and peas, are naturally high in dietary fiber. Consumers are increasingly seeking fiber rich foods as part of a healthy diet, and legumes provide an excellent source of both soluble and insoluble fibers.

The trend towards plant-based diets has gained momentum, and legumes are considered a valuable source of plant based nutrients. The legumes segment aligns with clean label trends, as consumers prioritize natural and plant derived ingredients.

Competitive Landscape

The competitive landscape of the fiber and specialty carbohydrate market is characterized by a dynamic interplay of factors such as innovation, product differentiation, strategic partnerships, and a focus on meeting evolving consumer preferences for health and wellness.

The key players within the industry are vying for market share through various strategies, as the market experiences growth driven by increased awareness of the importance of nutrition, digestive health, and functional foods.

Company Portfolio

  • Cargill Incorporated is a multinational corporation involved in the production and marketing of food, agricultural, financial, and industrial products. within the fiber and specialty carbohydrate domain, Cargill offers a portfolio of ingredients, including fibers and specialty carbohydrates, catering to the growing demand for functional and health focused foods.
  • Ingredion Incorporated is a leading ingredient solutions provider, offering a diverse range of starches, sweeteners, and nutritional ingredients. The company actively participates in the fiber and specialty carbohydrate market by providing solutions that enhance the nutritional profile and functionality of food and beverage products.

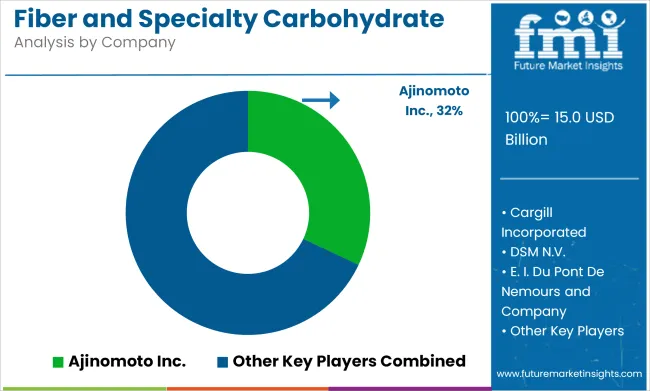
Key Fiber and Specialty Carbohydrate Market Players

  • Ajinomoto Inc.
  • Archer Daniels Midland Company
  • Cargill Incorporated
  • DSM N.V.
  • E. I. Du Pont De Nemours and Company
  • FMC Corporation
  • Ingredion Incorporated
  • J. Rettenmaier & Söhne GmbH & Co. Kg
  • Roquette Freres
  • Südzucker AG Company
  • SunOpta Inc.

Key Segments in the Fiber and Specialty Carbohydrate Market Report

By Type:

  • Fibers
  • Specialty Carbohydrates

By Application:

  • Functional Foods
  • Functional Beverage
  • Dietary Supplements
  • Animal Nutrition
  • Personal Care

By Source:

  • Grains
  • Vegetable
  • Fruits
  • Dairy Products
  • Legumes and Pulses
  • Nuts and Seeds

By Fiber:

  • Soluble
  • Non Soluble

By Region:

  • North America
  • Latin America
  • Western Europe
  • Eastern Europe
  • South Asia and Pacific
  • East Asia
  • The Middle East and Africa

Frequently Asked Questions

What is the anticipated value of the Fiber and Specialty Carbohydrates market in 2024?

The market is projected to reach a valuation of US$ 14,191.0 million in 2024.

What is the expected CAGR for the Fiber and Specialty Carbohydrates market until 2034?

The fiber and specialty carbohydrates industry is set to expand by a CAGR of 5.7% through 2034.

How much valuation is projected for the Fiber and Specialty Carbohydrates market in 2034?

The fiber and specialty carbohydrates market is forecast to reach US$ 24,693.2 million by 2034.

Which country is projected to lead the Fiber and Specialty Carbohydrates market?

The United Kingdom is expected to be the top performing market, exhibiting a CAGR of 8.3% through 2034.

Which is the dominant product type in the Fiber and Specialty Carbohydrates landscape?

Soluble fiber and specialty carbohydrate is expected to account for a share of 28.7% in 2024, making it a highly preferred product type.

Table of Content

1. Executive Summary

    1.1. Global Market Outlook

    1.2. Demand-side Trends

    1.3. Supply-side Trends

    1.4. Technology Roadmap Analysis

    1.5. Analysis and Recommendations

2. Market Overview

    2.1. Market Coverage / Taxonomy

    2.2. Market Definition / Scope / Limitations

3. Market Background

    3.1. Market Dynamics

        3.1.1. Drivers

        3.1.2. Restraints

        3.1.3. Opportunity

        3.1.4. Trends

    3.2. Scenario Forecast

        3.2.1. Demand in Optimistic Scenario

        3.2.2. Demand in Likely Scenario

        3.2.3. Demand in Conservative Scenario

    3.3. Opportunity Map Analysis

    3.4. Product Life Cycle Analysis

    3.5. Supply Chain Analysis

        3.5.1. Supply Side Participants and their Roles

            3.5.1.1. Producers

            3.5.1.2. Mid-Level Participants (Traders/ Agents/ Brokers)

            3.5.1.3. Wholesalers and Distributors

        3.5.2. Value Added and Value Created at Node in the Supply Chain

        3.5.3. List of Raw Material Suppliers

        3.5.4. List of Existing and Potential Buyer’s

    3.6. Investment Feasibility Matrix

    3.7. Value Chain Analysis

        3.7.1. Profit Margin Analysis

        3.7.2. Wholesalers and Distributors

        3.7.3. Retailers

    3.8. PESTLE and Porter’s Analysis

    3.9. Regulatory Landscape

        3.9.1. By Key Regions

        3.9.2. By Key Countries

    3.10. Regional Parent Market Outlook

    3.11. Production and Consumption Statistics

    3.12. Import and Export Statistics

4. Global Market Analysis 2019 to 2023 and Forecast, 2024 to 2034

    4.1. Historical Market Size Value (US$ Million) & Volume (Tons) Analysis, 2019 to 2023

    4.2. Current and Future Market Size Value (US$ Million) & Volume (Tons) Projections, 2024 to 2034

        4.2.1. Y-o-Y Growth Trend Analysis

        4.2.2. Absolute $ Opportunity Analysis

5. Global Market Analysis 2019 to 2023 and Forecast 2024 to 2034, By Type

    5.1. Introduction / Key Findings

    5.2. Historical Market Size Value (US$ Million) & Volume (Tons) Analysis By Type, 2019 to 2023

    5.3. Current and Future Market Size Value (US$ Million) & Volume (Tons) Analysis and Forecast By Type, 2024 to 2034

        5.3.1. Fibers

        5.3.2. Specialty Carbohydrates

    5.4. Y-o-Y Growth Trend Analysis By Type, 2019 to 2023

    5.5. Absolute $ Opportunity Analysis By Type, 2024 to 2034

6. Global Market Analysis 2019 to 2023 and Forecast 2024 to 2034, By Application

    6.1. Introduction / Key Findings

    6.2. Historical Market Size Value (US$ Million) & Volume (Tons) Analysis By Application, 2019 to 2023

    6.3. Current and Future Market Size Value (US$ Million) & Volume (Tons) Analysis and Forecast By Application, 2024 to 2034

        6.3.1. Functional Foods

        6.3.2. Functional Beverage

        6.3.3. Dietary Supplements

        6.3.4. Animal Nutrition

        6.3.5. Personal Care

    6.4. Y-o-Y Growth Trend Analysis By Application, 2019 to 2023

    6.5. Absolute $ Opportunity Analysis By Application, 2024 to 2034

7. Global Market Analysis 2019 to 2023 and Forecast 2024 to 2034, By Source

    7.1. Introduction / Key Findings

    7.2. Historical Market Size Value (US$ Million) & Volume (Tons) Analysis By Source, 2019 to 2023

    7.3. Current and Future Market Size Value (US$ Million) & Volume (Tons) Analysis and Forecast By Source, 2024 to 2034

        7.3.1. Grains

        7.3.2. Vegetable

        7.3.3. Fruits

        7.3.4. Dairy Products

        7.3.5. Legumes and Pulses

        7.3.6. Nuts and Seeds

    7.4. Y-o-Y Growth Trend Analysis By Source, 2019 to 2023

    7.5. Absolute $ Opportunity Analysis By Source, 2024 to 2034

8. Global Market Analysis 2019 to 2023 and Forecast 2024 to 2034, By Product Type

    8.1. Introduction / Key Findings

    8.2. Historical Market Size Value (US$ Million) & Volume (Tons) Analysis By Product Type, 2019 to 2023

    8.3. Current and Future Market Size Value (US$ Million) & Volume (Tons) Analysis and Forecast By Product Type, 2024 to 2034

        8.3.1. Soluble

        8.3.2. Non Soluble

    8.4. Y-o-Y Growth Trend Analysis By Product Type, 2019 to 2023

    8.5. Absolute $ Opportunity Analysis By Product Type, 2024 to 2034

9. Global Market Analysis 2019 to 2023 and Forecast 2024 to 2034, By Region

    9.1. Introduction

    9.2. Historical Market Size Value (US$ Million) & Volume (Tons) Analysis By Region, 2019 to 2023

    9.3. Current Market Size Value (US$ Million) & Volume (Tons) Analysis and Forecast By Region, 2024 to 2034

        9.3.1. North America

        9.3.2. Latin America

        9.3.3. Western Europe

        9.3.4. Eastern Europe

        9.3.5. South Asia and Pacific

        9.3.6. East Asia

        9.3.7. Middle East and Africa

    9.4. Market Attractiveness Analysis By Region

10. North America Market Analysis 2019 to 2023 and Forecast 2024 to 2034, By Country

    10.1. Historical Market Size Value (US$ Million) & Volume (Tons) Trend Analysis By Market Taxonomy, 2019 to 2023

    10.2. Market Size Value (US$ Million) & Volume (Tons) Forecast By Market Taxonomy, 2024 to 2034

        10.2.1. By Country

            10.2.1.1. USA

            10.2.1.2. Canada

        10.2.2. By Type

        10.2.3. By Application

        10.2.4. By Source

        10.2.5. By Product Type

    10.3. Market Attractiveness Analysis

        10.3.1. By Country

        10.3.2. By Type

        10.3.3. By Application

        10.3.4. By Source

        10.3.5. By Product Type

    10.4. Key Takeaways

11. Latin America Market Analysis 2019 to 2023 and Forecast 2024 to 2034, By Country

    11.1. Historical Market Size Value (US$ Million) & Volume (Tons) Trend Analysis By Market Taxonomy, 2019 to 2023

    11.2. Market Size Value (US$ Million) & Volume (Tons) Forecast By Market Taxonomy, 2024 to 2034

        11.2.1. By Country

            11.2.1.1. Brazil

            11.2.1.2. Mexico

            11.2.1.3. Rest of Latin America

        11.2.2. By Type

        11.2.3. By Application

        11.2.4. By Source

        11.2.5. By Product Type

    11.3. Market Attractiveness Analysis

        11.3.1. By Country

        11.3.2. By Type

        11.3.3. By Application

        11.3.4. By Source

        11.3.5. By Product Type

    11.4. Key Takeaways

12. Western Europe Market Analysis 2019 to 2023 and Forecast 2024 to 2034, By Country

    12.1. Historical Market Size Value (US$ Million) & Volume (Tons) Trend Analysis By Market Taxonomy, 2019 to 2023

    12.2. Market Size Value (US$ Million) & Volume (Tons) Forecast By Market Taxonomy, 2024 to 2034

        12.2.1. By Country

            12.2.1.1. Germany

            12.2.1.2. UK

            12.2.1.3. France

            12.2.1.4. Spain

            12.2.1.5. Italy

            12.2.1.6. Rest of Western Europe

        12.2.2. By Type

        12.2.3. By Application

        12.2.4. By Source

        12.2.5. By Product Type

    12.3. Market Attractiveness Analysis

        12.3.1. By Country

        12.3.2. By Type

        12.3.3. By Application

        12.3.4. By Source

        12.3.5. By Product Type

    12.4. Key Takeaways

13. Eastern Europe Market Analysis 2019 to 2023 and Forecast 2024 to 2034, By Country

    13.1. Historical Market Size Value (US$ Million) & Volume (Tons) Trend Analysis By Market Taxonomy, 2019 to 2023

    13.2. Market Size Value (US$ Million) & Volume (Tons) Forecast By Market Taxonomy, 2024 to 2034

        13.2.1. By Country

            13.2.1.1. Poland

            13.2.1.2. Russia

            13.2.1.3. Czech Republic

            13.2.1.4. Romania

            13.2.1.5. Rest of Eastern Europe

        13.2.2. By Type

        13.2.3. By Application

        13.2.4. By Source

        13.2.5. By Product Type

    13.3. Market Attractiveness Analysis

        13.3.1. By Country

        13.3.2. By Type

        13.3.3. By Application

        13.3.4. By Source

        13.3.5. By Product Type

    13.4. Key Takeaways

14. South Asia and Pacific Market Analysis 2019 to 2023 and Forecast 2024 to 2034, By Country

    14.1. Historical Market Size Value (US$ Million) & Volume (Tons) Trend Analysis By Market Taxonomy, 2019 to 2023

    14.2. Market Size Value (US$ Million) & Volume (Tons) Forecast By Market Taxonomy, 2024 to 2034

        14.2.1. By Country

            14.2.1.1. India

            14.2.1.2. Bangladesh

            14.2.1.3. Australia

            14.2.1.4. New Zealand

            14.2.1.5. Rest of South Asia and Pacific

        14.2.2. By Type

        14.2.3. By Application

        14.2.4. By Source

        14.2.5. By Product Type

    14.3. Market Attractiveness Analysis

        14.3.1. By Country

        14.3.2. By Type

        14.3.3. By Application

        14.3.4. By Source

        14.3.5. By Product Type

    14.4. Key Takeaways

15. East Asia Market Analysis 2019 to 2023 and Forecast 2024 to 2034, By Country

    15.1. Historical Market Size Value (US$ Million) & Volume (Tons) Trend Analysis By Market Taxonomy, 2019 to 2023

    15.2. Market Size Value (US$ Million) & Volume (Tons) Forecast By Market Taxonomy, 2024 to 2034

        15.2.1. By Country

            15.2.1.1. China

            15.2.1.2. Japan

            15.2.1.3. South Korea

        15.2.2. By Type

        15.2.3. By Application

        15.2.4. By Source

        15.2.5. By Product Type

    15.3. Market Attractiveness Analysis

        15.3.1. By Country

        15.3.2. By Type

        15.3.3. By Application

        15.3.4. By Source

        15.3.5. By Product Type

    15.4. Key Takeaways

16. Middle East and Africa Market Analysis 2019 to 2023 and Forecast 2024 to 2034, By Country

    16.1. Historical Market Size Value (US$ Million) & Volume (Tons) Trend Analysis By Market Taxonomy, 2019 to 2023

    16.2. Market Size Value (US$ Million) & Volume (Tons) Forecast By Market Taxonomy, 2024 to 2034

        16.2.1. By Country

            16.2.1.1. GCC Countries

            16.2.1.2. South Africa

            16.2.1.3. Israel

            16.2.1.4. Rest of MEA

        16.2.2. By Type

        16.2.3. By Application

        16.2.4. By Source

        16.2.5. By Product Type

    16.3. Market Attractiveness Analysis

        16.3.1. By Country

        16.3.2. By Type

        16.3.3. By Application

        16.3.4. By Source

        16.3.5. By Product Type

    16.4. Key Takeaways

17. Key Countries Market Analysis

    17.1. USA

        17.1.1. Pricing Analysis

        17.1.2. Market Share Analysis, 2023

            17.1.2.1. By Type

            17.1.2.2. By Application

            17.1.2.3. By Source

            17.1.2.4. By Product Type

    17.2. Canada

        17.2.1. Pricing Analysis

        17.2.2. Market Share Analysis, 2023

            17.2.2.1. By Type

            17.2.2.2. By Application

            17.2.2.3. By Source

            17.2.2.4. By Product Type

    17.3. Brazil

        17.3.1. Pricing Analysis

        17.3.2. Market Share Analysis, 2023

            17.3.2.1. By Type

            17.3.2.2. By Application

            17.3.2.3. By Source

            17.3.2.4. By Product Type

    17.4. Mexico

        17.4.1. Pricing Analysis

        17.4.2. Market Share Analysis, 2023

            17.4.2.1. By Type

            17.4.2.2. By Application

            17.4.2.3. By Source

            17.4.2.4. By Product Type

    17.5. Germany

        17.5.1. Pricing Analysis

        17.5.2. Market Share Analysis, 2023

            17.5.2.1. By Type

            17.5.2.2. By Application

            17.5.2.3. By Source

            17.5.2.4. By Product Type

    17.6. UK

        17.6.1. Pricing Analysis

        17.6.2. Market Share Analysis, 2023

            17.6.2.1. By Type

            17.6.2.2. By Application

            17.6.2.3. By Source

            17.6.2.4. By Product Type

    17.7. France

        17.7.1. Pricing Analysis

        17.7.2. Market Share Analysis, 2023

            17.7.2.1. By Type

            17.7.2.2. By Application

            17.7.2.3. By Source

            17.7.2.4. By Product Type

    17.8. Spain

        17.8.1. Pricing Analysis

        17.8.2. Market Share Analysis, 2023

            17.8.2.1. By Type

            17.8.2.2. By Application

            17.8.2.3. By Source

            17.8.2.4. By Product Type

    17.9. Italy

        17.9.1. Pricing Analysis

        17.9.2. Market Share Analysis, 2023

            17.9.2.1. By Type

            17.9.2.2. By Application

            17.9.2.3. By Source

            17.9.2.4. By Product Type

    17.10. Poland

        17.10.1. Pricing Analysis

        17.10.2. Market Share Analysis, 2023

            17.10.2.1. By Type

            17.10.2.2. By Application

            17.10.2.3. By Source

            17.10.2.4. By Product Type

    17.11. Russia

        17.11.1. Pricing Analysis

        17.11.2. Market Share Analysis, 2023

            17.11.2.1. By Type

            17.11.2.2. By Application

            17.11.2.3. By Source

            17.11.2.4. By Product Type

    17.12. Czech Republic

        17.12.1. Pricing Analysis

        17.12.2. Market Share Analysis, 2023

            17.12.2.1. By Type

            17.12.2.2. By Application

            17.12.2.3. By Source

            17.12.2.4. By Product Type

    17.13. Romania

        17.13.1. Pricing Analysis

        17.13.2. Market Share Analysis, 2023

            17.13.2.1. By Type

            17.13.2.2. By Application

            17.13.2.3. By Source

            17.13.2.4. By Product Type

    17.14. India

        17.14.1. Pricing Analysis

        17.14.2. Market Share Analysis, 2023

            17.14.2.1. By Type

            17.14.2.2. By Application

            17.14.2.3. By Source

            17.14.2.4. By Product Type

    17.15. Bangladesh

        17.15.1. Pricing Analysis

        17.15.2. Market Share Analysis, 2023

            17.15.2.1. By Type

            17.15.2.2. By Application

            17.15.2.3. By Source

            17.15.2.4. By Product Type

    17.16. Australia

        17.16.1. Pricing Analysis

        17.16.2. Market Share Analysis, 2023

            17.16.2.1. By Type

            17.16.2.2. By Application

            17.16.2.3. By Source

            17.16.2.4. By Product Type

    17.17. New Zealand

        17.17.1. Pricing Analysis

        17.17.2. Market Share Analysis, 2023

            17.17.2.1. By Type

            17.17.2.2. By Application

            17.17.2.3. By Source

            17.17.2.4. By Product Type

    17.18. China

        17.18.1. Pricing Analysis

        17.18.2. Market Share Analysis, 2023

            17.18.2.1. By Type

            17.18.2.2. By Application

            17.18.2.3. By Source

            17.18.2.4. By Product Type

    17.19. Japan

        17.19.1. Pricing Analysis

        17.19.2. Market Share Analysis, 2023

            17.19.2.1. By Type

            17.19.2.2. By Application

            17.19.2.3. By Source

            17.19.2.4. By Product Type

    17.20. South Korea

        17.20.1. Pricing Analysis

        17.20.2. Market Share Analysis, 2023

            17.20.2.1. By Type

            17.20.2.2. By Application

            17.20.2.3. By Source

            17.20.2.4. By Product Type

    17.21. GCC Countries

        17.21.1. Pricing Analysis

        17.21.2. Market Share Analysis, 2023

            17.21.2.1. By Type

            17.21.2.2. By Application

            17.21.2.3. By Source

            17.21.2.4. By Product Type

    17.22. South Africa

        17.22.1. Pricing Analysis

        17.22.2. Market Share Analysis, 2023

            17.22.2.1. By Type

            17.22.2.2. By Application

            17.22.2.3. By Source

            17.22.2.4. By Product Type

    17.23. Israel

        17.23.1. Pricing Analysis

        17.23.2. Market Share Analysis, 2023

            17.23.2.1. By Type

            17.23.2.2. By Application

            17.23.2.3. By Source

            17.23.2.4. By Product Type

18. Market Structure Analysis

    18.1. Competition Dashboard

    18.2. Competition Benchmarking

    18.3. Market Share Analysis of Top Players

        18.3.1. By Regional

        18.3.2. By Type

        18.3.3. By Application

        18.3.4. By Source

        18.3.5. By Product Type

19. Competition Analysis

    19.1. Competition Deep Dive

        19.1.1. Ajinomoto Inc.

            19.1.1.1. Overview

            19.1.1.2. Product Portfolio

            19.1.1.3. Profitability by Market Segments

            19.1.1.4. Sales Footprint

            19.1.1.5. Strategy Overview

                19.1.1.5.1. Marketing Strategy

                19.1.1.5.2. Product Strategy

                19.1.1.5.3. Channel Strategy

        19.1.2. Archer Daniels Midland Company

            19.1.2.1. Overview

            19.1.2.2. Product Portfolio

            19.1.2.3. Profitability by Market Segments

            19.1.2.4. Sales Footprint

            19.1.2.5. Strategy Overview

                19.1.2.5.1. Marketing Strategy

                19.1.2.5.2. Product Strategy

                19.1.2.5.3. Channel Strategy

        19.1.3. Cargill Incorporated

            19.1.3.1. Overview

            19.1.3.2. Product Portfolio

            19.1.3.3. Profitability by Market Segments

            19.1.3.4. Sales Footprint

            19.1.3.5. Strategy Overview

                19.1.3.5.1. Marketing Strategy

                19.1.3.5.2. Product Strategy

                19.1.3.5.3. Channel Strategy

        19.1.4. DSM N.V.

            19.1.4.1. Overview

            19.1.4.2. Product Portfolio

            19.1.4.3. Profitability by Market Segments

            19.1.4.4. Sales Footprint

            19.1.4.5. Strategy Overview

                19.1.4.5.1. Marketing Strategy

                19.1.4.5.2. Product Strategy

                19.1.4.5.3. Channel Strategy

        19.1.5. E. I. Du Pont De Nemours and Company

            19.1.5.1. Overview

            19.1.5.2. Product Portfolio

            19.1.5.3. Profitability by Market Segments

            19.1.5.4. Sales Footprint

            19.1.5.5. Strategy Overview

                19.1.5.5.1. Marketing Strategy

                19.1.5.5.2. Product Strategy

                19.1.5.5.3. Channel Strategy

        19.1.6. FMC Corporation

            19.1.6.1. Overview

            19.1.6.2. Product Portfolio

            19.1.6.3. Profitability by Market Segments

            19.1.6.4. Sales Footprint

            19.1.6.5. Strategy Overview

                19.1.6.5.1. Marketing Strategy

                19.1.6.5.2. Product Strategy

                19.1.6.5.3. Channel Strategy

        19.1.7. Ingredion Incorporated

            19.1.7.1. Overview

            19.1.7.2. Product Portfolio

            19.1.7.3. Profitability by Market Segments

            19.1.7.4. Sales Footprint

            19.1.7.5. Strategy Overview

                19.1.7.5.1. Marketing Strategy

                19.1.7.5.2. Product Strategy

                19.1.7.5.3. Channel Strategy

        19.1.8. J. Rettenmaier & Söhne GmbH & Co. Kg

            19.1.8.1. Overview

            19.1.8.2. Product Portfolio

            19.1.8.3. Profitability by Market Segments

            19.1.8.4. Sales Footprint

            19.1.8.5. Strategy Overview

                19.1.8.5.1. Marketing Strategy

                19.1.8.5.2. Product Strategy

                19.1.8.5.3. Channel Strategy

        19.1.9. Roquette Freres

            19.1.9.1. Overview

            19.1.9.2. Product Portfolio

            19.1.9.3. Profitability by Market Segments

            19.1.9.4. Sales Footprint

            19.1.9.5. Strategy Overview

                19.1.9.5.1. Marketing Strategy

                19.1.9.5.2. Product Strategy

                19.1.9.5.3. Channel Strategy

        19.1.10. Südzucker AG Company

            19.1.10.1. Overview

            19.1.10.2. Product Portfolio

            19.1.10.3. Profitability by Market Segments

            19.1.10.4. Sales Footprint

            19.1.10.5. Strategy Overview

                19.1.10.5.1. Marketing Strategy

                19.1.10.5.2. Product Strategy

                19.1.10.5.3. Channel Strategy

        19.1.11. SunOpta, Inc.

            19.1.11.1. Overview

            19.1.11.2. Product Portfolio

            19.1.11.3. Profitability by Market Segments

            19.1.11.4. Sales Footprint

            19.1.11.5. Strategy Overview

                19.1.11.5.1. Marketing Strategy

                19.1.11.5.2. Product Strategy

                19.1.11.5.3. Channel Strategy

20. Assumptions & Acronyms Used

21. Research Methodology

Don't pay for what you don't need

Customize your report by selecting specific countries or regions and save 30%!

List of Tables

Table 1: Global Market Value (US$ Million) Forecast by Region, 2019 to 2034

Table 2: Global Market Volume (Tons) Forecast by Region, 2019 to 2034

Table 3: Global Market Value (US$ Million) Forecast by Type, 2019 to 2034

Table 4: Global Market Volume (Tons) Forecast by Type, 2019 to 2034

Table 5: Global Market Value (US$ Million) Forecast by Application, 2019 to 2034

Table 6: Global Market Volume (Tons) Forecast by Application, 2019 to 2034

Table 7: Global Market Value (US$ Million) Forecast by Source, 2019 to 2034

Table 8: Global Market Volume (Tons) Forecast by Source, 2019 to 2034

Table 9: Global Market Value (US$ Million) Forecast by Product Type, 2019 to 2034

Table 10: Global Market Volume (Tons) Forecast by Product Type, 2019 to 2034

Table 11: North America Market Value (US$ Million) Forecast by Country, 2019 to 2034

Table 12: North America Market Volume (Tons) Forecast by Country, 2019 to 2034

Table 13: North America Market Value (US$ Million) Forecast by Type, 2019 to 2034

Table 14: North America Market Volume (Tons) Forecast by Type, 2019 to 2034

Table 15: North America Market Value (US$ Million) Forecast by Application, 2019 to 2034

Table 16: North America Market Volume (Tons) Forecast by Application, 2019 to 2034

Table 17: North America Market Value (US$ Million) Forecast by Source, 2019 to 2034

Table 18: North America Market Volume (Tons) Forecast by Source, 2019 to 2034

Table 19: North America Market Value (US$ Million) Forecast by Product Type, 2019 to 2034

Table 20: North America Market Volume (Tons) Forecast by Product Type, 2019 to 2034

Table 21: Latin America Market Value (US$ Million) Forecast by Country, 2019 to 2034

Table 22: Latin America Market Volume (Tons) Forecast by Country, 2019 to 2034

Table 23: Latin America Market Value (US$ Million) Forecast by Type, 2019 to 2034

Table 24: Latin America Market Volume (Tons) Forecast by Type, 2019 to 2034

Table 25: Latin America Market Value (US$ Million) Forecast by Application, 2019 to 2034

Table 26: Latin America Market Volume (Tons) Forecast by Application, 2019 to 2034

Table 27: Latin America Market Value (US$ Million) Forecast by Source, 2019 to 2034

Table 28: Latin America Market Volume (Tons) Forecast by Source, 2019 to 2034

Table 29: Latin America Market Value (US$ Million) Forecast by Product Type, 2019 to 2034

Table 30: Latin America Market Volume (Tons) Forecast by Product Type, 2019 to 2034

Table 31: Western Europe Market Value (US$ Million) Forecast by Country, 2019 to 2034

Table 32: Western Europe Market Volume (Tons) Forecast by Country, 2019 to 2034

Table 33: Western Europe Market Value (US$ Million) Forecast by Type, 2019 to 2034

Table 34: Western Europe Market Volume (Tons) Forecast by Type, 2019 to 2034

Table 35: Western Europe Market Value (US$ Million) Forecast by Application, 2019 to 2034

Table 36: Western Europe Market Volume (Tons) Forecast by Application, 2019 to 2034

Table 37: Western Europe Market Value (US$ Million) Forecast by Source, 2019 to 2034

Table 38: Western Europe Market Volume (Tons) Forecast by Source, 2019 to 2034

Table 39: Western Europe Market Value (US$ Million) Forecast by Product Type, 2019 to 2034

Table 40: Western Europe Market Volume (Tons) Forecast by Product Type, 2019 to 2034

Table 41: Eastern Europe Market Value (US$ Million) Forecast by Country, 2019 to 2034

Table 42: Eastern Europe Market Volume (Tons) Forecast by Country, 2019 to 2034

Table 43: Eastern Europe Market Value (US$ Million) Forecast by Type, 2019 to 2034

Table 44: Eastern Europe Market Volume (Tons) Forecast by Type, 2019 to 2034

Table 45: Eastern Europe Market Value (US$ Million) Forecast by Application, 2019 to 2034

Table 46: Eastern Europe Market Volume (Tons) Forecast by Application, 2019 to 2034

Table 47: Eastern Europe Market Value (US$ Million) Forecast by Source, 2019 to 2034

Table 48: Eastern Europe Market Volume (Tons) Forecast by Source, 2019 to 2034

Table 49: Eastern Europe Market Value (US$ Million) Forecast by Product Type, 2019 to 2034

Table 50: Eastern Europe Market Volume (Tons) Forecast by Product Type, 2019 to 2034

Table 51: South Asia and Pacific Market Value (US$ Million) Forecast by Country, 2019 to 2034

Table 52: South Asia and Pacific Market Volume (Tons) Forecast by Country, 2019 to 2034

Table 53: South Asia and Pacific Market Value (US$ Million) Forecast by Type, 2019 to 2034

Table 54: South Asia and Pacific Market Volume (Tons) Forecast by Type, 2019 to 2034

Table 55: South Asia and Pacific Market Value (US$ Million) Forecast by Application, 2019 to 2034

Table 56: South Asia and Pacific Market Volume (Tons) Forecast by Application, 2019 to 2034

Table 57: South Asia and Pacific Market Value (US$ Million) Forecast by Source, 2019 to 2034

Table 58: South Asia and Pacific Market Volume (Tons) Forecast by Source, 2019 to 2034

Table 59: South Asia and Pacific Market Value (US$ Million) Forecast by Product Type, 2019 to 2034

Table 60: South Asia and Pacific Market Volume (Tons) Forecast by Product Type, 2019 to 2034

Table 61: East Asia Market Value (US$ Million) Forecast by Country, 2019 to 2034

Table 62: East Asia Market Volume (Tons) Forecast by Country, 2019 to 2034

Table 63: East Asia Market Value (US$ Million) Forecast by Type, 2019 to 2034

Table 64: East Asia Market Volume (Tons) Forecast by Type, 2019 to 2034

Table 65: East Asia Market Value (US$ Million) Forecast by Application, 2019 to 2034

Table 66: East Asia Market Volume (Tons) Forecast by Application, 2019 to 2034

Table 67: East Asia Market Value (US$ Million) Forecast by Source, 2019 to 2034

Table 68: East Asia Market Volume (Tons) Forecast by Source, 2019 to 2034

Table 69: East Asia Market Value (US$ Million) Forecast by Product Type, 2019 to 2034

Table 70: East Asia Market Volume (Tons) Forecast by Product Type, 2019 to 2034

Table 71: Middle East and Africa Market Value (US$ Million) Forecast by Country, 2019 to 2034

Table 72: Middle East and Africa Market Volume (Tons) Forecast by Country, 2019 to 2034

Table 73: Middle East and Africa Market Value (US$ Million) Forecast by Type, 2019 to 2034

Table 74: Middle East and Africa Market Volume (Tons) Forecast by Type, 2019 to 2034

Table 75: Middle East and Africa Market Value (US$ Million) Forecast by Application, 2019 to 2034

Table 76: Middle East and Africa Market Volume (Tons) Forecast by Application, 2019 to 2034

Table 77: Middle East and Africa Market Value (US$ Million) Forecast by Source, 2019 to 2034

Table 78: Middle East and Africa Market Volume (Tons) Forecast by Source, 2019 to 2034

Table 79: Middle East and Africa Market Value (US$ Million) Forecast by Product Type, 2019 to 2034

Table 80: Middle East and Africa Market Volume (Tons) Forecast by Product Type, 2019 to 2034
Nandini Roy Choudhury

Principal Consultant

Talk to Analyst

Find your sweet spots for generating winning opportunities in this market.

List of Charts

Figure 1: Global Market Value (US$ Million) by Type, 2024 to 2034

Figure 2: Global Market Value (US$ Million) by Application, 2024 to 2034

Figure 3: Global Market Value (US$ Million) by Source, 2024 to 2034

Figure 4: Global Market Value (US$ Million) by Product Type, 2024 to 2034

Figure 5: Global Market Value (US$ Million) by Region, 2024 to 2034

Figure 6: Global Market Value (US$ Million) Analysis by Region, 2019 to 2034

Figure 7: Global Market Volume (Tons) Analysis by Region, 2019 to 2034

Figure 8: Global Market Value Share (%) and BPS Analysis by Region, 2024 to 2034

Figure 9: Global Market Y-o-Y Growth (%) Projections by Region, 2024 to 2034

Figure 10: Global Market Value (US$ Million) Analysis by Type, 2019 to 2034

Figure 11: Global Market Volume (Tons) Analysis by Type, 2019 to 2034

Figure 12: Global Market Value Share (%) and BPS Analysis by Type, 2024 to 2034

Figure 13: Global Market Y-o-Y Growth (%) Projections by Type, 2024 to 2034

Figure 14: Global Market Value (US$ Million) Analysis by Application, 2019 to 2034

Figure 15: Global Market Volume (Tons) Analysis by Application, 2019 to 2034

Figure 16: Global Market Value Share (%) and BPS Analysis by Application, 2024 to 2034

Figure 17: Global Market Y-o-Y Growth (%) Projections by Application, 2024 to 2034

Figure 18: Global Market Value (US$ Million) Analysis by Source, 2019 to 2034

Figure 19: Global Market Volume (Tons) Analysis by Source, 2019 to 2034

Figure 20: Global Market Value Share (%) and BPS Analysis by Source, 2024 to 2034

Figure 21: Global Market Y-o-Y Growth (%) Projections by Source, 2024 to 2034

Figure 22: Global Market Value (US$ Million) Analysis by Product Type, 2019 to 2034

Figure 23: Global Market Volume (Tons) Analysis by Product Type, 2019 to 2034

Figure 24: Global Market Value Share (%) and BPS Analysis by Product Type, 2024 to 2034

Figure 25: Global Market Y-o-Y Growth (%) Projections by Product Type, 2024 to 2034

Figure 26: Global Market Attractiveness by Type, 2024 to 2034

Figure 27: Global Market Attractiveness by Application, 2024 to 2034

Figure 28: Global Market Attractiveness by Source, 2024 to 2034

Figure 29: Global Market Attractiveness by Product Type, 2024 to 2034

Figure 30: Global Market Attractiveness by Region, 2024 to 2034

Figure 31: North America Market Value (US$ Million) by Type, 2024 to 2034

Figure 32: North America Market Value (US$ Million) by Application, 2024 to 2034

Figure 33: North America Market Value (US$ Million) by Source, 2024 to 2034

Figure 34: North America Market Value (US$ Million) by Product Type, 2024 to 2034

Figure 35: North America Market Value (US$ Million) by Country, 2024 to 2034

Figure 36: North America Market Value (US$ Million) Analysis by Country, 2019 to 2034

Figure 37: North America Market Volume (Tons) Analysis by Country, 2019 to 2034

Figure 38: North America Market Value Share (%) and BPS Analysis by Country, 2024 to 2034

Figure 39: North America Market Y-o-Y Growth (%) Projections by Country, 2024 to 2034

Figure 40: North America Market Value (US$ Million) Analysis by Type, 2019 to 2034

Figure 41: North America Market Volume (Tons) Analysis by Type, 2019 to 2034

Figure 42: North America Market Value Share (%) and BPS Analysis by Type, 2024 to 2034

Figure 43: North America Market Y-o-Y Growth (%) Projections by Type, 2024 to 2034

Figure 44: North America Market Value (US$ Million) Analysis by Application, 2019 to 2034

Figure 45: North America Market Volume (Tons) Analysis by Application, 2019 to 2034

Figure 46: North America Market Value Share (%) and BPS Analysis by Application, 2024 to 2034

Figure 47: North America Market Y-o-Y Growth (%) Projections by Application, 2024 to 2034

Figure 48: North America Market Value (US$ Million) Analysis by Source, 2019 to 2034

Figure 49: North America Market Volume (Tons) Analysis by Source, 2019 to 2034

Figure 50: North America Market Value Share (%) and BPS Analysis by Source, 2024 to 2034

Figure 51: North America Market Y-o-Y Growth (%) Projections by Source, 2024 to 2034

Figure 52: North America Market Value (US$ Million) Analysis by Product Type, 2019 to 2034

Figure 53: North America Market Volume (Tons) Analysis by Product Type, 2019 to 2034

Figure 54: North America Market Value Share (%) and BPS Analysis by Product Type, 2024 to 2034

Figure 55: North America Market Y-o-Y Growth (%) Projections by Product Type, 2024 to 2034

Figure 56: North America Market Attractiveness by Type, 2024 to 2034

Figure 57: North America Market Attractiveness by Application, 2024 to 2034

Figure 58: North America Market Attractiveness by Source, 2024 to 2034

Figure 59: North America Market Attractiveness by Product Type, 2024 to 2034

Figure 60: North America Market Attractiveness by Country, 2024 to 2034

Figure 61: Latin America Market Value (US$ Million) by Type, 2024 to 2034

Figure 62: Latin America Market Value (US$ Million) by Application, 2024 to 2034

Figure 63: Latin America Market Value (US$ Million) by Source, 2024 to 2034

Figure 64: Latin America Market Value (US$ Million) by Product Type, 2024 to 2034

Figure 65: Latin America Market Value (US$ Million) by Country, 2024 to 2034

Figure 66: Latin America Market Value (US$ Million) Analysis by Country, 2019 to 2034

Figure 67: Latin America Market Volume (Tons) Analysis by Country, 2019 to 2034

Figure 68: Latin America Market Value Share (%) and BPS Analysis by Country, 2024 to 2034

Figure 69: Latin America Market Y-o-Y Growth (%) Projections by Country, 2024 to 2034

Figure 70: Latin America Market Value (US$ Million) Analysis by Type, 2019 to 2034

Figure 71: Latin America Market Volume (Tons) Analysis by Type, 2019 to 2034

Figure 72: Latin America Market Value Share (%) and BPS Analysis by Type, 2024 to 2034

Figure 73: Latin America Market Y-o-Y Growth (%) Projections by Type, 2024 to 2034

Figure 74: Latin America Market Value (US$ Million) Analysis by Application, 2019 to 2034

Figure 75: Latin America Market Volume (Tons) Analysis by Application, 2019 to 2034

Figure 76: Latin America Market Value Share (%) and BPS Analysis by Application, 2024 to 2034

Figure 77: Latin America Market Y-o-Y Growth (%) Projections by Application, 2024 to 2034

Figure 78: Latin America Market Value (US$ Million) Analysis by Source, 2019 to 2034

Figure 79: Latin America Market Volume (Tons) Analysis by Source, 2019 to 2034

Figure 80: Latin America Market Value Share (%) and BPS Analysis by Source, 2024 to 2034

Figure 81: Latin America Market Y-o-Y Growth (%) Projections by Source, 2024 to 2034

Figure 82: Latin America Market Value (US$ Million) Analysis by Product Type, 2019 to 2034

Figure 83: Latin America Market Volume (Tons) Analysis by Product Type, 2019 to 2034

Figure 84: Latin America Market Value Share (%) and BPS Analysis by Product Type, 2024 to 2034

Figure 85: Latin America Market Y-o-Y Growth (%) Projections by Product Type, 2024 to 2034

Figure 86: Latin America Market Attractiveness by Type, 2024 to 2034

Figure 87: Latin America Market Attractiveness by Application, 2024 to 2034

Figure 88: Latin America Market Attractiveness by Source, 2024 to 2034

Figure 89: Latin America Market Attractiveness by Product Type, 2024 to 2034

Figure 90: Latin America Market Attractiveness by Country, 2024 to 2034

Figure 91: Western Europe Market Value (US$ Million) by Type, 2024 to 2034

Figure 92: Western Europe Market Value (US$ Million) by Application, 2024 to 2034

Figure 93: Western Europe Market Value (US$ Million) by Source, 2024 to 2034

Figure 94: Western Europe Market Value (US$ Million) by Product Type, 2024 to 2034

Figure 95: Western Europe Market Value (US$ Million) by Country, 2024 to 2034

Figure 96: Western Europe Market Value (US$ Million) Analysis by Country, 2019 to 2034

Figure 97: Western Europe Market Volume (Tons) Analysis by Country, 2019 to 2034

Figure 98: Western Europe Market Value Share (%) and BPS Analysis by Country, 2024 to 2034

Figure 99: Western Europe Market Y-o-Y Growth (%) Projections by Country, 2024 to 2034

Figure 100: Western Europe Market Value (US$ Million) Analysis by Type, 2019 to 2034

Figure 101: Western Europe Market Volume (Tons) Analysis by Type, 2019 to 2034

Figure 102: Western Europe Market Value Share (%) and BPS Analysis by Type, 2024 to 2034

Figure 103: Western Europe Market Y-o-Y Growth (%) Projections by Type, 2024 to 2034

Figure 104: Western Europe Market Value (US$ Million) Analysis by Application, 2019 to 2034

Figure 105: Western Europe Market Volume (Tons) Analysis by Application, 2019 to 2034

Figure 106: Western Europe Market Value Share (%) and BPS Analysis by Application, 2024 to 2034

Figure 107: Western Europe Market Y-o-Y Growth (%) Projections by Application, 2024 to 2034

Figure 108: Western Europe Market Value (US$ Million) Analysis by Source, 2019 to 2034

Figure 109: Western Europe Market Volume (Tons) Analysis by Source, 2019 to 2034

Figure 110: Western Europe Market Value Share (%) and BPS Analysis by Source, 2024 to 2034

Figure 111: Western Europe Market Y-o-Y Growth (%) Projections by Source, 2024 to 2034

Figure 112: Western Europe Market Value (US$ Million) Analysis by Product Type, 2019 to 2034

Figure 113: Western Europe Market Volume (Tons) Analysis by Product Type, 2019 to 2034

Figure 114: Western Europe Market Value Share (%) and BPS Analysis by Product Type, 2024 to 2034

Figure 115: Western Europe Market Y-o-Y Growth (%) Projections by Product Type, 2024 to 2034

Figure 116: Western Europe Market Attractiveness by Type, 2024 to 2034

Figure 117: Western Europe Market Attractiveness by Application, 2024 to 2034

Figure 118: Western Europe Market Attractiveness by Source, 2024 to 2034

Figure 119: Western Europe Market Attractiveness by Product Type, 2024 to 2034

Figure 120: Western Europe Market Attractiveness by Country, 2024 to 2034

Figure 121: Eastern Europe Market Value (US$ Million) by Type, 2024 to 2034

Figure 122: Eastern Europe Market Value (US$ Million) by Application, 2024 to 2034

Figure 123: Eastern Europe Market Value (US$ Million) by Source, 2024 to 2034

Figure 124: Eastern Europe Market Value (US$ Million) by Product Type, 2024 to 2034

Figure 125: Eastern Europe Market Value (US$ Million) by Country, 2024 to 2034

Figure 126: Eastern Europe Market Value (US$ Million) Analysis by Country, 2019 to 2034

Figure 127: Eastern Europe Market Volume (Tons) Analysis by Country, 2019 to 2034

Figure 128: Eastern Europe Market Value Share (%) and BPS Analysis by Country, 2024 to 2034

Figure 129: Eastern Europe Market Y-o-Y Growth (%) Projections by Country, 2024 to 2034

Figure 130: Eastern Europe Market Value (US$ Million) Analysis by Type, 2019 to 2034

Figure 131: Eastern Europe Market Volume (Tons) Analysis by Type, 2019 to 2034

Figure 132: Eastern Europe Market Value Share (%) and BPS Analysis by Type, 2024 to 2034

Figure 133: Eastern Europe Market Y-o-Y Growth (%) Projections by Type, 2024 to 2034

Figure 134: Eastern Europe Market Value (US$ Million) Analysis by Application, 2019 to 2034

Figure 135: Eastern Europe Market Volume (Tons) Analysis by Application, 2019 to 2034

Figure 136: Eastern Europe Market Value Share (%) and BPS Analysis by Application, 2024 to 2034

Figure 137: Eastern Europe Market Y-o-Y Growth (%) Projections by Application, 2024 to 2034

Figure 138: Eastern Europe Market Value (US$ Million) Analysis by Source, 2019 to 2034

Figure 139: Eastern Europe Market Volume (Tons) Analysis by Source, 2019 to 2034

Figure 140: Eastern Europe Market Value Share (%) and BPS Analysis by Source, 2024 to 2034

Figure 141: Eastern Europe Market Y-o-Y Growth (%) Projections by Source, 2024 to 2034

Figure 142: Eastern Europe Market Value (US$ Million) Analysis by Product Type, 2019 to 2034

Figure 143: Eastern Europe Market Volume (Tons) Analysis by Product Type, 2019 to 2034

Figure 144: Eastern Europe Market Value Share (%) and BPS Analysis by Product Type, 2024 to 2034

Figure 145: Eastern Europe Market Y-o-Y Growth (%) Projections by Product Type, 2024 to 2034

Figure 146: Eastern Europe Market Attractiveness by Type, 2024 to 2034

Figure 147: Eastern Europe Market Attractiveness by Application, 2024 to 2034

Figure 148: Eastern Europe Market Attractiveness by Source, 2024 to 2034

Figure 149: Eastern Europe Market Attractiveness by Product Type, 2024 to 2034

Figure 150: Eastern Europe Market Attractiveness by Country, 2024 to 2034

Figure 151: South Asia and Pacific Market Value (US$ Million) by Type, 2024 to 2034

Figure 152: South Asia and Pacific Market Value (US$ Million) by Application, 2024 to 2034

Figure 153: South Asia and Pacific Market Value (US$ Million) by Source, 2024 to 2034

Figure 154: South Asia and Pacific Market Value (US$ Million) by Product Type, 2024 to 2034

Figure 155: South Asia and Pacific Market Value (US$ Million) by Country, 2024 to 2034

Figure 156: South Asia and Pacific Market Value (US$ Million) Analysis by Country, 2019 to 2034

Figure 157: South Asia and Pacific Market Volume (Tons) Analysis by Country, 2019 to 2034

Figure 158: South Asia and Pacific Market Value Share (%) and BPS Analysis by Country, 2024 to 2034

Figure 159: South Asia and Pacific Market Y-o-Y Growth (%) Projections by Country, 2024 to 2034

Figure 160: South Asia and Pacific Market Value (US$ Million) Analysis by Type, 2019 to 2034

Figure 161: South Asia and Pacific Market Volume (Tons) Analysis by Type, 2019 to 2034

Figure 162: South Asia and Pacific Market Value Share (%) and BPS Analysis by Type, 2024 to 2034

Figure 163: South Asia and Pacific Market Y-o-Y Growth (%) Projections by Type, 2024 to 2034

Figure 164: South Asia and Pacific Market Value (US$ Million) Analysis by Application, 2019 to 2034

Figure 165: South Asia and Pacific Market Volume (Tons) Analysis by Application, 2019 to 2034

Figure 166: South Asia and Pacific Market Value Share (%) and BPS Analysis by Application, 2024 to 2034

Figure 167: South Asia and Pacific Market Y-o-Y Growth (%) Projections by Application, 2024 to 2034

Figure 168: South Asia and Pacific Market Value (US$ Million) Analysis by Source, 2019 to 2034

Figure 169: South Asia and Pacific Market Volume (Tons) Analysis by Source, 2019 to 2034

Figure 170: South Asia and Pacific Market Value Share (%) and BPS Analysis by Source, 2024 to 2034

Figure 171: South Asia and Pacific Market Y-o-Y Growth (%) Projections by Source, 2024 to 2034

Figure 172: South Asia and Pacific Market Value (US$ Million) Analysis by Product Type, 2019 to 2034

Figure 173: South Asia and Pacific Market Volume (Tons) Analysis by Product Type, 2019 to 2034

Figure 174: South Asia and Pacific Market Value Share (%) and BPS Analysis by Product Type, 2024 to 2034

Figure 175: South Asia and Pacific Market Y-o-Y Growth (%) Projections by Product Type, 2024 to 2034

Figure 176: South Asia and Pacific Market Attractiveness by Type, 2024 to 2034

Figure 177: South Asia and Pacific Market Attractiveness by Application, 2024 to 2034

Figure 178: South Asia and Pacific Market Attractiveness by Source, 2024 to 2034

Figure 179: South Asia and Pacific Market Attractiveness by Product Type, 2024 to 2034

Figure 180: South Asia and Pacific Market Attractiveness by Country, 2024 to 2034

Figure 181: East Asia Market Value (US$ Million) by Type, 2024 to 2034

Figure 182: East Asia Market Value (US$ Million) by Application, 2024 to 2034

Figure 183: East Asia Market Value (US$ Million) by Source, 2024 to 2034

Figure 184: East Asia Market Value (US$ Million) by Product Type, 2024 to 2034

Figure 185: East Asia Market Value (US$ Million) by Country, 2024 to 2034

Figure 186: East Asia Market Value (US$ Million) Analysis by Country, 2019 to 2034

Figure 187: East Asia Market Volume (Tons) Analysis by Country, 2019 to 2034

Figure 188: East Asia Market Value Share (%) and BPS Analysis by Country, 2024 to 2034

Figure 189: East Asia Market Y-o-Y Growth (%) Projections by Country, 2024 to 2034

Figure 190: East Asia Market Value (US$ Million) Analysis by Type, 2019 to 2034

Figure 191: East Asia Market Volume (Tons) Analysis by Type, 2019 to 2034

Figure 192: East Asia Market Value Share (%) and BPS Analysis by Type, 2024 to 2034

Figure 193: East Asia Market Y-o-Y Growth (%) Projections by Type, 2024 to 2034

Figure 194: East Asia Market Value (US$ Million) Analysis by Application, 2019 to 2034

Figure 195: East Asia Market Volume (Tons) Analysis by Application, 2019 to 2034

Figure 196: East Asia Market Value Share (%) and BPS Analysis by Application, 2024 to 2034

Figure 197: East Asia Market Y-o-Y Growth (%) Projections by Application, 2024 to 2034

Figure 198: East Asia Market Value (US$ Million) Analysis by Source, 2019 to 2034

Figure 199: East Asia Market Volume (Tons) Analysis by Source, 2019 to 2034

Figure 200: East Asia Market Value Share (%) and BPS Analysis by Source, 2024 to 2034

Figure 201: East Asia Market Y-o-Y Growth (%) Projections by Source, 2024 to 2034

Figure 202: East Asia Market Value (US$ Million) Analysis by Product Type, 2019 to 2034

Figure 203: East Asia Market Volume (Tons) Analysis by Product Type, 2019 to 2034

Figure 204: East Asia Market Value Share (%) and BPS Analysis by Product Type, 2024 to 2034

Figure 205: East Asia Market Y-o-Y Growth (%) Projections by Product Type, 2024 to 2034

Figure 206: East Asia Market Attractiveness by Type, 2024 to 2034

Figure 207: East Asia Market Attractiveness by Application, 2024 to 2034

Figure 208: East Asia Market Attractiveness by Source, 2024 to 2034

Figure 209: East Asia Market Attractiveness by Product Type, 2024 to 2034

Figure 210: East Asia Market Attractiveness by Country, 2024 to 2034

Figure 211: Middle East and Africa Market Value (US$ Million) by Type, 2024 to 2034

Figure 212: Middle East and Africa Market Value (US$ Million) by Application, 2024 to 2034

Figure 213: Middle East and Africa Market Value (US$ Million) by Source, 2024 to 2034

Figure 214: Middle East and Africa Market Value (US$ Million) by Product Type, 2024 to 2034

Figure 215: Middle East and Africa Market Value (US$ Million) by Country, 2024 to 2034

Figure 216: Middle East and Africa Market Value (US$ Million) Analysis by Country, 2019 to 2034

Figure 217: Middle East and Africa Market Volume (Tons) Analysis by Country, 2019 to 2034

Figure 218: Middle East and Africa Market Value Share (%) and BPS Analysis by Country, 2024 to 2034

Figure 219: Middle East and Africa Market Y-o-Y Growth (%) Projections by Country, 2024 to 2034

Figure 220: Middle East and Africa Market Value (US$ Million) Analysis by Type, 2019 to 2034

Figure 221: Middle East and Africa Market Volume (Tons) Analysis by Type, 2019 to 2034

Figure 222: Middle East and Africa Market Value Share (%) and BPS Analysis by Type, 2024 to 2034

Figure 223: Middle East and Africa Market Y-o-Y Growth (%) Projections by Type, 2024 to 2034

Figure 224: Middle East and Africa Market Value (US$ Million) Analysis by Application, 2019 to 2034

Figure 225: Middle East and Africa Market Volume (Tons) Analysis by Application, 2019 to 2034

Figure 226: Middle East and Africa Market Value Share (%) and BPS Analysis by Application, 2024 to 2034

Figure 227: Middle East and Africa Market Y-o-Y Growth (%) Projections by Application, 2024 to 2034

Figure 228: Middle East and Africa Market Value (US$ Million) Analysis by Source, 2019 to 2034

Figure 229: Middle East and Africa Market Volume (Tons) Analysis by Source, 2019 to 2034

Figure 230: Middle East and Africa Market Value Share (%) and BPS Analysis by Source, 2024 to 2034

Figure 231: Middle East and Africa Market Y-o-Y Growth (%) Projections by Source, 2024 to 2034

Figure 232: Middle East and Africa Market Value (US$ Million) Analysis by Product Type, 2019 to 2034

Figure 233: Middle East and Africa Market Volume (Tons) Analysis by Product Type, 2019 to 2034

Figure 234: Middle East and Africa Market Value Share (%) and BPS Analysis by Product Type, 2024 to 2034

Figure 235: Middle East and Africa Market Y-o-Y Growth (%) Projections by Product Type, 2024 to 2034

Figure 236: Middle East and Africa Market Attractiveness by Type, 2024 to 2034

Figure 237: Middle East and Africa Market Attractiveness by Application, 2024 to 2034

Figure 238: Middle East and Africa Market Attractiveness by Source, 2024 to 2034

Figure 239: Middle East and Africa Market Attractiveness by Product Type, 2024 to 2034

Figure 240: Middle East and Africa Market Attractiveness by Country, 2024 to 2034

Recommendations

Food and Beverage

Dietary Fiber Market

Published : January 2024

Food and Beverage

Specialty Carbohydrates Market

Published : April 2023

Food and Beverage

Refined Functional Carbohydrates Market

Published : April 2023

Food and Beverage

Functional Carbohydrates Market

Published : May 2022

Explore Food and Beverage Insights

View Reports

Fiber and Specialty Carbohydrate Market