Fiber Bottle Market Size and Share Forecast Outlook 2025 to 2035

The fiber bottle market is likely to grow to USD 2.7 billion in 2025. Demand is projected to rise to USD 5.1 billion by 2035 at 6.6% CAGR.
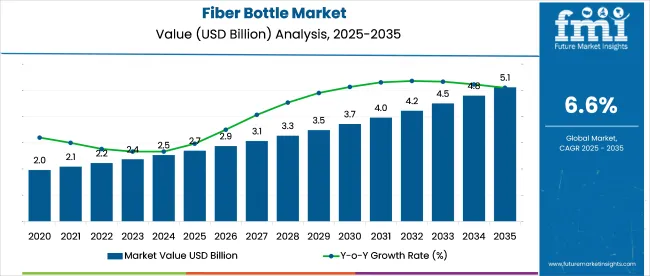
Quick Stats of Fiber Bottle Market

  • Market Value (2025): USD 2.7 billion
  • Forecast Value (2035): USD 5.1 billion
  • Forecast CAGR (2025 to 2035): 6.6%
  • Product Leader in 2025: Waterbased coating fiber bottles (58% share of protective linings)
  • Top Distribution Channel: Beverage packaging (capturing 42% of total fiber bottle usage)
  • Key Growth Region: India (highest CAGR at 8.9%)
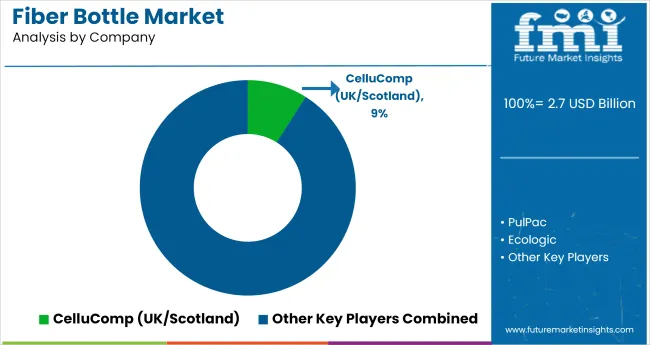
  • Leading Player: CelluComp (holding approximately 9% market share)

Fiber Bottle Market

Attribute Value
Market Size (2025) USD 2.7 billion
Market Size (2035) USD 5.1 billion
CAGR (2025 to 2035) 6.6%

Sales are driven by increasing demand across beverages, home care, and personal care products. These bottles use molded pulp or paper-based composites, often paired with minimal polymer linings to meet barrier requirements. Their lower resin content appeals to producers seeking packaging with reduced environmental load. Developments in forming, drying, and surface finishing are improving efficiency and performance. Fiber bottles are being introduced in refill systems, dry product lines, and sample SKUs, with growing acceptance among retailers updating packaging portfolios to reduce traditional plastic formats.

As of 2025, fiber bottles form a minor part of their overarching markets. In the global packaging landscape, estimated at over USD 1.2 trillion, their presence remains below 0.05%, with adoption limited to pilot-scale applications. Beverage packaging, a USD 200 billion segment, sees fiber bottles contributing around 0.1%, largely within bottled water and craft beverages. In personal care, uptake is lower-under 0.03%, with fiber formats still in testing for items like shampoo and lotion.

Paper-based packaging, a USD 400 billion market, includes fiber bottles at under 0.1%, overshadowed by folding cartons and molded trays. In compostable packaging, estimated near USD 10 billion, fiber bottles represent around 0.4% of the market, supported by interest in plastic-free rigid containers. Technical hurdles around barrier performance and industrial filling compatibility continue to restrict broader deployment.

Matthias Zachert, CEO of LANXESS AG, views fiber bottles as a structural shift in liquid packaging that requires coordinated progress across science, manufacturing, and recovery systems. He explains that LANXESS has developed bio-based barrier coatings that address oxygen and moisture pressure without hindering recyclability.

These advancements remove a key technical barrier that has historically limited fiber bottle adoption in beverages and personal care. Zachert presents this as evidence that performance and material recovery can be integrated at scale, reflecting LANXESS’s approach to engineering packaging solutions that meet commercial and environmental expectations without trade-offs.

Analyzing Fiber Bottle Market by Top Investment Segments

Adoption of fiber bottles has centered around water-based coatings and beverage applications, where shelf-life, barrier uniformity, and mold precision drive decision-making. Format conversion among liquid packaging suppliers is driven by tooling standardization, cap torque specifications, and compatibility with rotary and linear fill lines.
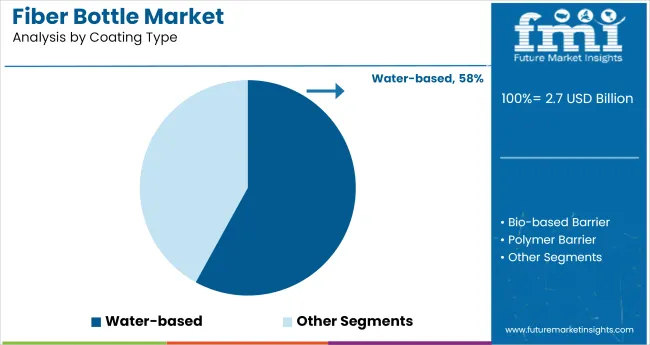
Water-Based Coatings Lead with 58% Market Share in 2025

Fiber Bottle Market Analysis By Coating Type

Water-based coatings account for 58% of fiber bottle demand due to their low curing temperatures (below 90°C) and thin-layer film uniformity (<8 microns). They offer moderate oxygen transmission rates (OTR <1.0 cc/m²/day) suitable for short-shelf-life beverages. Brands like Carlsberg, Lactalis, and Just Water have adopted these coatings for mass-scale fiber bottles, especially for chilled juices and milk drinks. Coating lines utilize UV-assisted drying or forced-air curing chambers to maintain throughput above 200 bottles/minute. Water-based barriers also ease recyclability, enabling mono-material sortation in fiber streams with no polymer residue above 1% by weight.

  • Enables full-bottle coating with dip or spray techniques across multiple neck sizes
  • Reduces VOC emissions to <25 mg/m³ under EU food contact standards
  • Compatible with in-line inspection systems using moisture content sensors at <5%

Beverage Packaging Captures 42% of End-Use Demand in 2025

Beverage applications comprise 42% of total fiber bottle usage, driven by adoption in water, flavored drinks, and dairy. The shift to molded pulp formats is fueled by interest in alternatives to PET and HDPE, particularly for 250-750 mL formats. Brands such as Nestlé, Coca-Cola, and PepsiCo are testing pilot batches across EU and USA markets. Average bottle wall thickness ranges between 0.6-1.2 mm, with vertical load-bearing capacity exceeding 6.5 kg. Bottle forming molds must retain dimensional accuracy within ±0.2 mm across production cycles to maintain fit with automated de-palletizing and filling systems.
  • Torque rating for compatible closures maintained at 0.35-0.50 Nm
  • Bottles perform under drop-test standards from 1.2 meters when dry
  • Structural rigidity achieved using 2-stage thermoforming + compression

Hybrid Structures Account for Largest Format Share

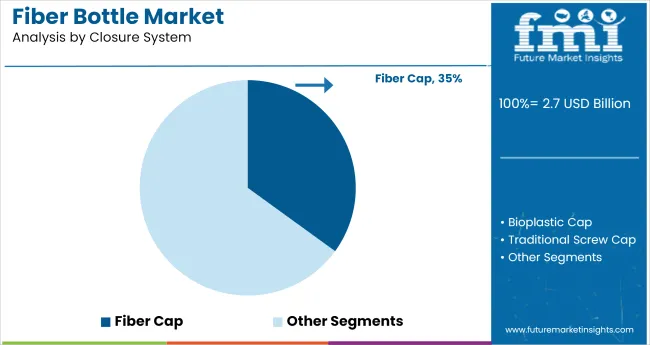
Fiber Bottle Market Analysis By Bottle Structure

Hybrid bottles with internal bioplastic or polymer liners remain the most commercially available format, especially in high-shelf-life applications like dairy or juice. Typically composed of outer molded fiber shell (60-70% by weight) and internal liner (PLA or thin PET), these designs support oxygen barrier levels <0.5 cc/m²/day. Manufacturers such as Paboco, PA Consulting, and Billerud offer hybrid formats for filling lines operating up to 220 BPM. Liner-blown formats are induction-sealed post-fill to ensure leak integrity under 2 bar internal pressure.
  • Bottle and liner separation achievable in pulper systems within 3-5 minutes
  • Hybrid formats meet migration standards under EU 10/2011 and FDA 21 CFR 177
  • Design flexibility allows multi-textured outer bottle surfaces for brand differentiation.

Fiber Caps Show Rapid Shift in Closure System Usage

Fiber Bottle Market Analysis By Closure System

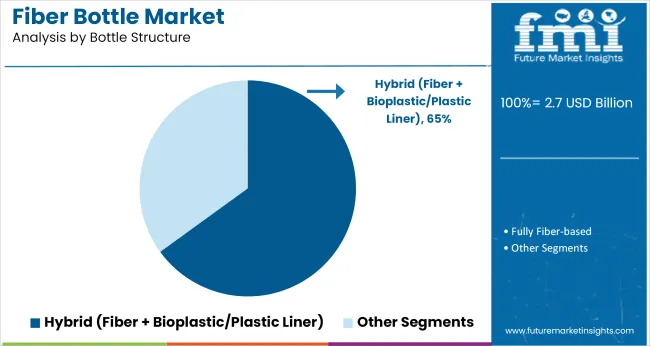
Fiber-based caps are replacing traditional screw caps in short-cycle drinks and single-serve SKUs. These caps are compression-molded from wet-formed pulp or pressed dry fiber, supporting torque thresholds of 0.3 Nm with push-and-twist locking designs. Companies like Blue Ocean Closures, Pulpex, and Stora Enso are scaling fiber cap lines with mold cycle times of 2.5-3.5 seconds. While not suitable for carbonated applications yet, fiber caps are sufficient for still beverages and personal care liquids with low vapor pressure.
  • Moisture absorption kept below 8% using hydrophobic internal linings
  • Cap dimensions must align to ±0.15 mm to match automated capping heads
  • Torque decay over 4 weeks limited to <10% in ambient storage trials

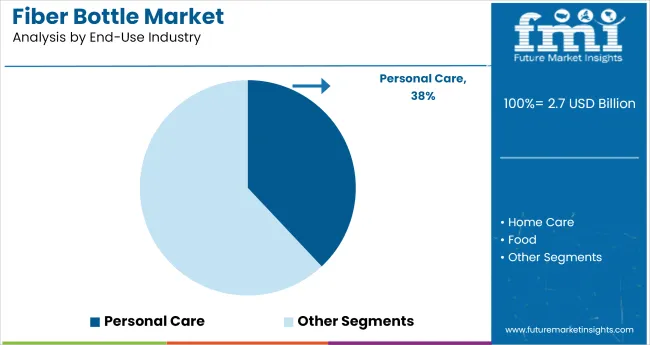
Personal Care Formats Enable Broader SKU Conversion

Fiber Bottle Market Analysis By End Use Industry

Personal care brands are adopting fiber bottles for lotions, shampoos, and cleansers in 250 mL to 500 mL formats. The emphasis is on packaging appearance and tactile feel, often achieved through micro-embossed textures on fiber shells. Manufacturers such as L’Oréal, Davines, and Seventh Generation have piloted fully fiber or hybrid bottles. Internal liners are required for chemical pH stability (pH 4-9), while spray and pump integration use snap-in fiber collars with tolerance windows under 0.3 mm.

  • Surface roughness (Ra) targeted at 8-12 microns for grip and matte finish
  • Wall thickness optimized to withstand 35-40 kPa squeeze force
  • Color printing integrated via flexo or inkjet with water-resistant inks

Top Fiber Bottle Market Dynamics

Fiber bottle adoption improved warehouse turnover, cut changeover times, and reduced product loss in Northern Europe. Field trials confirmed structural reliability in beverage and personal care uses. Despite cost pressures from pulp and biopolymer inputs, producers are offsetting expenses through localized materials and standardized closures, though automation limitations continue to affect margins.

Inventory Shifts and Line-Speed Adjustments in Fiber Bottle Filling

Beverage and personal care fillers reduced warehouse holding times after recalibrating production lines for fiber bottle formats. Across Denmark and the Netherlands, average storage time dropped from 68 to 47 days in Q1 2025 following integration of pressure-sensitive conveyors and bottle guides tailored for pulp-based structures.

Co-packers in Germany operating shared lines now clock a 23% faster changeover time when switching from PET to fiber substrates, aided by pre-molded inserts and standardized cap interfaces. UK brands restructured monthly production schedules to accommodate shorter curing cycles, leading to an 11% reduction in excess finished goods.

Performance Validation Across Beverage and Body Care Applications

Consumer field testing by Aarhus University in late 2024 reported 87% retention of structural integrity across chilled and ambient formats after 30 days of use, when using dual-layer fiber bottles with internal biopolymer lining. In Finland, trial runs of carbonated drinks in reinforced paper-based bottles showed no cap-blow failure across batches of 10,000 units.

Shampoo producers in Canada completed shelf-life equivalence testing under ASTM D4169 transport simulation, clearing the format for national rollout. French mineral water brands introduced fiber prototypes for still water, reporting 28% higher trial participation among eco-focused customer segments during store-based samplings.

Input Cost Pressure and Manufacturing Constraints

Producers faced tighter margin spreads due to pulp input inflation and resin-layer sourcing variability. Nordic fiber pulp prices moved 12% higher YoY by May 2025, while costs for thin bioplastic linings rose 8% across East Asia. Mold cycle times remained longer than PET equivalents, constraining throughput by 15-22% in high-volume lines.

Labour demands for bottle finishing added complexity at manual-trim stages. To counter rising unit economics, some producers switched to regionally sourced waste fiber blends, lowering raw material cost by 9% at the expense of lighter color consistency. Others entered co-development deals with closure makers to unify cap-fit profiles, shaving off per-unit assembly time.
Top Countries Manufacturing, Synthesizing, Distributing, and Generating Demand for Fiber Bottles

Country Wise Analysis Of Fiber Bottle Market

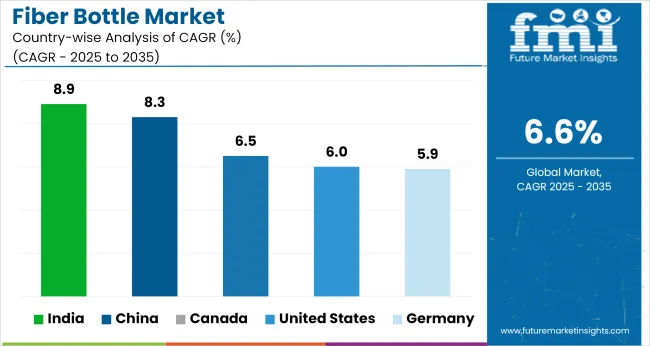
Countries CAGR (2025 to 2035)
India 8.9%
China 8.3%
Canada 6.5%
United States 6.0%
Germany 5.9%

The demand is forecast to expand at a 6.6% CAGR between 2025 and 2035. Among the five countries profiled, India (BRICS) sees the steepest upward momentum at 8.9%, followed by China (BRICS) at 8.3%. Canada (OECD) posts 6.5%, while the USA and Germany, both OECD members, trail slightly at 6.0% and 5.9%, respectively.

Compared to the global average, India exceeds by +35%, China by +26%, while Canada remains near-par, and the USA and Germany fall short by -9% and -11%. India’s domestic paper bottle capacity additions and brand-led trials across foodservice are key contributors. China shows increased fiber mold integration in FMCG categories. Canada’s moderate pace links to controlled retail pilot activity. Also,the USA and Germany reflect bottlenecks in converting conventional PET lines and sourcing molded pulp suited for bottle-grade applications.

The report covers detailed analysis of 40+ countries, with the top five countries shared as a reference

Growth Outlook for Fiber Bottle Market in the United States

The fiber bottle market in the USA is projected to grow at a CAGR of 6.0% from 2025 to 2035, with demand expected to exceed 52,000 metric tons by 2035. Early adoption is concentrated in personal care and specialty beverage segments, with brands trialing molded fiber bottles lined with thin polymer barriers. Limited barrier technology and co-packing flexibility have restricted rollout scale, but consumer acceptance in eco-alternative formats remains strong. Regulatory pressures on single-use plastics are prompting legacy players to assess fiber bottle feasibility in niche formats.

  • Over 70% of pilot projects are focused on 300-750 ml formats for liquid soaps and niche drinks.
  • PET-lined and PVOH-coated bottles make up most of the fiber bottle testing inventory.
  • Onshore capacity remains limited, with contract manufacturing centered in two USA regions.

Fiber Bottle Market Expansion Trends in Canada

Canada’s fiber bottle market is expected to grow at a CAGR of 6.5% through 2035, with annual demand likely to reach 19,000 metric tons by the end of the forecast window. Key growth drivers include small-format beverage launches and policy-aligned innovation grants supporting fiber-based alternatives. Several trials are ongoing across eastern provinces in the craft beverage and household care sectors. Retail buyers have shown positive feedback for molded bottles paired with biodegradable caps and inner linings, though mass-market scalability remains a hurdle.

  • Around 60% of current demand comes from the household cleaning and ready-to-drink tea segments.
  • Post-consumer fiber sourced from recycled cartons is the dominant feedstock in domestic trials.
  • Imports of fiber bottles rose 14% in 2024, mostly from Europe and Northeast Asia.

Demand Analysis of Fiber Bottle Market in Germany

Germany is forecasted to see fiber bottle demand grow at a CAGR of 5.9% between 2025 and 2035, with volume likely to reach 46,000 metric tons by 2035. The country’s emphasis on circular material systems and extended producer responsibility is fostering a design shift toward alternative packaging substrates. Fiber bottles are being explored in premium mineral water, floor cleaner concentrates, and refill formats for cosmetics. Local converters are collaborating with Scandinavian and Benelux suppliers for fiber preform development and barrier integration.

  • Nearly 80% of existing fiber bottle applications use cellulose derived from FSC-certified pulp.
  • Trials using bio-PET and PHA liners have gained regulatory clearance for food-contact products.
  • Over 30 regional brands are running limited-edition SKUs in fiber bottles as of 2024.

Market Forecast for Fiber Bottles in China

The fiber bottle market in China is anticipated to grow at a CAGR of 8.3% between 2025 and 2035, with demand projected to exceed 138,000 metric tons by 2035. Driven by innovation-led procurement and pressure to reduce plastic dependence, the segment is expanding across personal care and RTD beverage sectors. Fiber molding infrastructure is growing rapidly, backed by government pilot funding and private capital. Domestic companies are actively filing patents for fiber bottle forming techniques and novel barrier coatings.

  • Guangdong and Zhejiang account for more than 40% of fiber bottle production capacity.
  • In 2024, over 190 brands introduced fiber-based packaging across food and non-food SKUs.
  • PE-alternative inner linings using starch blends are being trialed at commercial scale.

Emerging Demand for Fiber Bottles in India

The fiber bottle market in India is forecast to expand at a CAGR of 8.9% over the 2025 to 2035 period, with projected demand nearing 102,000 metric tons by 2035. Domestic brands in hair oil, floor cleaner, and herbal beverage categories are piloting fiber bottles to diversify away from PET and HDPE. Cost control remains central, with most trials focusing on locally sourced bamboo pulp and recycled fiber blends. Distribution is skewed toward metro areas, where early adopters are concentrated.
  • 2024 saw the introduction of fiber bottles across 22 SKUs in the ayurvedic and wellness space.
  • Paperboard-wrapped fiber preforms are gaining attention for 200-500 ml retail products.
  • Imports remain minimal, as local tooling and mold manufacturing scale up.

Leading Fiber Bottles Manufacturers, Suppliers, and Distributors

Fiber Bottle Market Analysis By Company

The market remains highly competitive during the forecast period. The CelluComp utilizes vegetable-based nanocellulose to create durable, plastic-free containers, while PulPac's dry-forming process significantly reduces manufacturing time and energy consumption. Ecologic's composite paper-bioresin bottles demonstrate effective barrier properties without synthetic liners. Emerging solutions include RyPax'sthermally treated bamboo bottles with natural antimicrobial features and FLOW Eco Bottle's coating-free, spiral-wound construction. Industrial partners like Jabil are adopting high-speed production techniques from other manufacturing sectors.

The market faces key challenges in achieving extended product shelf life and matching plastic bottle production speeds, driving cross-industry R&D collaborations. Current developments focus on enhancing material performance while maintaining compatibility with existing filling infrastructure and end-of-life processing systems.

Recent Industry News

  • In March 2024, Coca-Cola began testing Papacks’ fully bio-based fiber bottles in Hungary, aiming for 100% renewable materials.
  • In June 2024, The EU proposed including fiber bottles in the Packaging and Packaging Waste Regulation (PPWR), potentially mandating their use for certain applications.

Leading Players

  • Ecologic
  • PulPac
  • CelluComp (UK/Scotland)
  • RyPax
  • OtaraPack
  • Papacks
  • FLOW Eco Bottle
  • Green Valley
  • Jabil
  • CMPC Maderas

Report Scope

Report Attributes Details
Market Size (2025) USD 2.7 billion
Projected Market Size (2035) USD 5.1 billion
CAGR (2025 to 2035) 6.6%
Base Year for Estimation 2024
Historical Period 2020 to 2024
Projection Period 2025 to 2035
Quantitative Units USD billion for value
Bottle Structure (Segment 1) Fully Fiber-based, Hybrid (Fiber + Bioplastic/Plastic Liner)
Coating Type (Segment 2) Water-based, Bio-based Barrier, Polymer Barrier
Closure System (Segment 3) Fiber Cap, Bioplastic Cap, Traditional Screw Cap
Application Areas (Segment 4) Dairy Products, Juices, Water, Personal Care, Home Care
End-Use Industries (Segment 5) Beverage, Personal Care, Home Care, Food
Regions Covered North America, Europe, Asia-Pacific, Latin America, Middle East & Africa
Country Covered United States, Canada, Germany, France, United Kingdom, China, Japan, India, Brazil, South Africa
Key Companies Profiled Ecologic, PulPac, CelluComp, RyPax, OtaraPack, Papacks, FLOW Eco Bottle, Green Valley, Jabil, CMPC Maderas
Additional Attributes Dollar sales analyzed across bottle structure and closure types, share by end-use sectors with rising demand from beverage and personal care categories, increasing use in dairy and juice packaging to replace traditional PET, integration into premium personal care lines and refill models, region-specific coating adaptations to comply with recyclability and composting protocols, manufacturing concentration in Europe and North America supporting cross-border supply to Asia-Pacific and Latin America

Fiber Bottles Market Analyzed by Key Investment Segments

By Bottle Structure:

Fully Fiber-based, Hybrid (Fiber + Bioplastic/Plastic Liner)

By Coating Type:

Water-based, Bio-based Barrier, Polymer Barrier

By Closure System:

Fiber Cap, Bioplastic Cap, Traditional Screw Cap

By Application:

Dairy Products, Juices, Water, Personal Care, Home Care

By End-Use Industry:

Beverage, Personal Care, Home Care, Food

By Region:

North America, Latin America, Western Europe, Eastern Europe, East Asia, South Asia & Pacific, Central Asia, Russia and Belarus, Balkan & Baltic Countries, Middle East and Africa

Table of Content

  1. Executive Summary
    • Global Market Outlook
    • Demand-side Trends
    • Supply-side Trends
    • Technology Roadmap Analysis
    • Analysis and Recommendations
  2. Market Overview
    • Market Coverage / Taxonomy
    • Market Definition / Scope / Limitations
  3. Market Background
    • Market Dynamics
      • Drivers
      • Restraints
      • Opportunity
      • Trends
    • Scenario Forecast
      • Demand in Optimistic Scenario
      • Demand in Likely Scenario
      • Demand in Conservative Scenario
    • Opportunity Map Analysis
    • Product Life Cycle Analysis
    • Supply Chain Analysis
      • Supply Side Participants and their Roles
        • Producers
        • Mid-Level Participants (Traders/ Agents/ Brokers)
        • Wholesalers and Distributors
      • Value Added and Value Created at Node in the Supply Chain
      • List of Raw Material Suppliers
      • List of Existing and Potential Buyer’s
    • Investment Feasibility Matrix
    • Value Chain Analysis
      • Profit Margin Analysis
      • Wholesalers and Distributors
      • Retailers
    • PESTLE and Porter’s Analysis
    • Regulatory Landscape
      • By Key Regions
      • By Key Countries
    • Regional Parent Market Outlook
    • Production and Consumption Statistics
    • Import and Export Statistics
  4. Global Market Analysis 2020 to 2024 and Forecast, 2025 to 2035
    • Historical Market Size Value (USD Billion) & Volume (MT) Analysis, 2020 to 2024
    • Current and Future Market Size Value (USD Billion) & Volume (MT) Projections, 2025 to 2035
      • Y-o-Y Growth Trend Analysis
      • Absolute $ Opportunity Analysis
  5. Global Market Pricing Analysis 2020 to 2024 and Forecast 2025 to 2035
  6. Global Market Analysis 2020 to 2024 and Forecast 2025 to 2035, By Bottle Structure
    • Introduction / Key Findings
    • Historical Market Size Value (USD Billion) & Volume (MT) Analysis By Bottle Structure, 2020 to 2024
    • Current and Future Market Size Value (USD Billion) & Volume (MT) Analysis and Forecast By Bottle Structure, 2025 to 2035
      • Fully Fiber-based
      • Hybrid (Fiber + Bioplastic/Plastic Liner)
    • Y-o-Y Growth Trend Analysis By Bottle Structure, 2020 to 2024
    • Absolute $ Opportunity Analysis By Bottle Structure, 2025 to 2035
  7. Global Market Analysis 2020 to 2024 and Forecast 2025 to 2035, By Coating Type
    • Introduction / Key Findings
    • Historical Market Size Value (USD Billion) & Volume (MT) Analysis By Coating Type, 2020 to 2024
    • Current and Future Market Size Value (USD Billion) & Volume (MT) Analysis and Forecast By Coating Type, 2025 to 2035
      • Water-based
      • Bio-based Barrier
      • Polymer Barrier
    • Y-o-Y Growth Trend Analysis By Coating Type, 2020 to 2024
    • Absolute $ Opportunity Analysis By Coating Type, 2025 to 2035
  8. Global Market Analysis 2020 to 2024 and Forecast 2025 to 2035, By Closure System
    • Introduction / Key Findings
    • Historical Market Size Value (USD Billion) & Volume (MT) Analysis By Closure System, 2020 to 2024
    • Current and Future Market Size Value (USD Billion) & Volume (MT) Analysis and Forecast By Closure System, 2025 to 2035
      • Fiber Cap
      • Bioplastic Cap
      • Traditional Screw Cap
    • Y-o-Y Growth Trend Analysis By Closure System, 2020 to 2024
    • Absolute $ Opportunity Analysis By Closure System, 2025 to 2035
  9. Global Market Analysis 2020 to 2024 and Forecast 2025 to 2035, By Application
    • Introduction / Key Findings
    • Historical Market Size Value (USD Billion) & Volume (MT) Analysis By Application, 2020 to 2024
    • Current and Future Market Size Value (USD Billion) & Volume (MT) Analysis and Forecast By Application, 2025 to 2035
      • Dairy Products
      • Juices
      • Water
      • Personal Care
      • Home Care
    • Y-o-Y Growth Trend Analysis By Application, 2020 to 2024
    • Absolute $ Opportunity Analysis By Application, 2025 to 2035
  10. Global Market Analysis 2020 to 2024 and Forecast 2025 to 2035, By End-Use Industry
    • Introduction / Key Findings
    • Historical Market Size Value (USD Billion) & Volume (MT) Analysis By End-Use Industry, 2020 to 2024
    • Current and Future Market Size Value (USD Billion) & Volume (MT) Analysis and Forecast By End-Use Industry, 2025 to 2035
      • Beverage
      • Personal Care
      • Home Care
      • Food
    • Y-o-Y Growth Trend Analysis By End-Use Industry, 2020 to 2024
    • Absolute $ Opportunity Analysis By End-Use Industry, 2025 to 2035
  11. Global Market Analysis 2020 to 2024 and Forecast 2025 to 2035, By Region
    • Introduction
    • Historical Market Size Value (USD Billion) & Volume (MT) Analysis By Region, 2020 to 2024
    • Current Market Size Value (USD Billion) & Volume (MT) Analysis and Forecast By Region, 2025 to 2035
      • North America
      • Latin America
      • Western Europe
      • Eastern Europe
      • East Asia
      • South Asia & Pacific
      • Middle East and Africa
    • Market Attractiveness Analysis By Region
  12. North America Market Analysis 2020 to 2024 and Forecast 2025 to 2035, By Country
    • Historical Market Size Value (USD Billion) & Volume (MT) Trend Analysis By Market Taxonomy, 2020 to 2024
    • Market Size Value (USD Billion) & Volume (MT) Forecast By Market Taxonomy, 2025 to 2035
      • By Country
        • USA
        • Canada
        • Mexico
      • By Bottle Structure
      • By Coating Type
      • By Closure System
      • By Application
      • By End-Use Industry
    • Market Attractiveness Analysis
      • By Country
      • By Bottle Structure
      • By Coating Type
      • By Closure System
      • By Application
      • By End-Use Industry
    • Key Takeaways
  13. Latin America Market Analysis 2020 to 2024 and Forecast 2025 to 2035, By Country
    • Historical Market Size Value (USD Billion) & Volume (MT) Trend Analysis By Market Taxonomy, 2020 to 2024
    • Market Size Value (USD Billion) & Volume (MT) Forecast By Market Taxonomy, 2025 to 2035
      • By Country
        • Brazil
        • Argentina
        • Rest of LATAM
      • By Bottle Structure
      • By Coating Type
      • By Closure System
      • By Application
      • By End-Use Industry
    • Market Attractiveness Analysis
      • By Country
      • By Bottle Structure
      • By Coating Type
      • By Closure System
      • By Application
      • By End-Use Industry
    • Key Takeaways
  14. Western Europe Market Analysis 2020 to 2024 and Forecast 2025 to 2035, By Country
    • Historical Market Size Value (USD Billion) & Volume (MT) Trend Analysis By Market Taxonomy, 2020 to 2024
    • Market Size Value (USD Billion) & Volume (MT) Forecast By Market Taxonomy, 2025 to 2035
      • By Country
        • Germany
        • Italy
        • France
        • UK
        • Spain
        • BENELUX
        • Nordic
        • Rest of W.Europe
      • By Bottle Structure
      • By Coating Type
      • By Closure System
      • By Application
      • By End-Use Industry
    • Market Attractiveness Analysis
      • By Country
      • By Bottle Structure
      • By Coating Type
      • By Closure System
      • By Application
      • By End-Use Industry
    • Key Takeaways
  15. Eastern Europe Market Analysis 2020 to 2024 and Forecast 2025 to 2035, By Country
    • Historical Market Size Value (USD Billion) & Volume (MT) Trend Analysis By Market Taxonomy, 2020 to 2024
    • Market Size Value (USD Billion) & Volume (MT) Forecast By Market Taxonomy, 2025 to 2035
      • By Country
        • Russia
        • Hungary
        • Poland
        • Balkan & Baltics
        • Rest of E. Europe
      • By Bottle Structure
      • By Coating Type
      • By Closure System
      • By Application
      • By End-Use Industry
    • Market Attractiveness Analysis
      • By Country
      • By Bottle Structure
      • By Coating Type
      • By Closure System
      • By Application
      • By End-Use Industry
    • Key Takeaways
  16. East Asia Market Analysis 2020 to 2024 and Forecast 2025 to 2035, By Country
    • Historical Market Size Value (USD Billion) & Volume (MT) Trend Analysis By Market Taxonomy, 2020 to 2024
    • Market Size Value (USD Billion) & Volume (MT) Forecast By Market Taxonomy, 2025 to 2035
      • By Country
        • China
        • Japan
        • South Korea
      • By Bottle Structure
      • By Coating Type
      • By Closure System
      • By Application
      • By End-Use Industry
    • Market Attractiveness Analysis
      • By Country
      • By Bottle Structure
      • By Coating Type
      • By Closure System
      • By Application
      • By End-Use Industry
    • Key Takeaways
  17. South Asia & Pacific Market Analysis 2020 to 2024 and Forecast 2025 to 2035, By Country
    • Historical Market Size Value (USD Billion) & Volume (MT) Trend Analysis By Market Taxonomy, 2020 to 2024
    • Market Size Value (USD Billion) & Volume (MT) Forecast By Market Taxonomy, 2025 to 2035
      • By Country
        • India
        • Australia & New Zealand
        • ASEAN
        • Rest of SAP
      • By Bottle Structure
      • By Coating Type
      • By Closure System
      • By Application
      • By End-Use Industry
    • Market Attractiveness Analysis
      • By Country
      • By Bottle Structure
      • By Coating Type
      • By Closure System
      • By Application
      • By End-Use Industry
    • Key Takeaways
  18. Middle East and Africa Market Analysis 2020 to 2024 and Forecast 2025 to 2035, By Country
    • Historical Market Size Value (USD Billion) & Volume (MT) Trend Analysis By Market Taxonomy, 2020 to 2024
    • Market Size Value (USD Billion) & Volume (MT) Forecast By Market Taxonomy, 2025 to 2035
      • By Country
        • GCC Countries
        • Northern Africa
        • South Africa
        • Turkiye
        • Rest of MEA
      • By Bottle Structure
      • By Coating Type
      • By Closure System
      • By Application
      • By End-Use Industry
    • Market Attractiveness Analysis
      • By Country
      • By Bottle Structure
      • By Coating Type
      • By Closure System
      • By Application
      • By End-Use Industry
    • Key Takeaways
  19. Key Countries Market Analysis
    • USA
      • Pricing Analysis
      • Market Share Analysis, 2024
        • By Bottle Structure
        • By Coating Type
        • By Closure System
        • By Application
        • By End-Use Industry
    • Canada
      • Pricing Analysis
      • Market Share Analysis, 2024
        • By Bottle Structure
        • By Coating Type
        • By Closure System
        • By Application
        • By End-Use Industry
    • Brazil
      • Pricing Analysis
      • Market Share Analysis, 2024
        • By Bottle Structure
        • By Coating Type
        • By Closure System
        • By Application
        • By End-Use Industry
    • Mexico
      • Pricing Analysis
      • Market Share Analysis, 2024
        • By Bottle Structure
        • By Coating Type
        • By Closure System
        • By Application
        • By End-Use Industry
    • Argentina
      • Pricing Analysis
      • Market Share Analysis, 2024
        • By Bottle Structure
        • By Coating Type
        • By Closure System
        • By Application
        • By End-Use Industry
  20. Market Structure Analysis
    • Competition Dashboard
    • Competition Benchmarking
    • Market Share Analysis of Top Players
      • By Regional
      • By Bottle Structure
      • By Coating Type
      • By Closure System
      • By Application
      • By End-Use Industry
  21. Competition Analysis
    • Competition Deep Dive
      • Ecologic
        • Overview
        • Product Portfolio
        • Profitability by Market Segments (Product/Age /Sales Channel/Region)
        • Sales Footprint
        • Strategy Overview
          • Marketing Strategy
          • Product Strategy
          • Channel Strategy
      • PulPac
        • Overview
        • Product Portfolio
        • Profitability by Market Segments (Product/Age /Sales Channel/Region)
        • Sales Footprint
        • Strategy Overview
          • Marketing Strategy
          • Product Strategy
          • Channel Strategy
      • CelluComp (UK/Scotland)
        • Overview
        • Product Portfolio
        • Profitability by Market Segments (Product/Age /Sales Channel/Region)
        • Sales Footprint
        • Strategy Overview
          • Marketing Strategy
          • Product Strategy
          • Channel Strategy
      • RyPax
        • Overview
        • Product Portfolio
        • Profitability by Market Segments (Product/Age /Sales Channel/Region)
        • Sales Footprint
        • Strategy Overview
          • Marketing Strategy
          • Product Strategy
          • Channel Strategy
      • OtaraPack
        • Overview
        • Product Portfolio
        • Profitability by Market Segments (Product/Age /Sales Channel/Region)
        • Sales Footprint
        • Strategy Overview
          • Marketing Strategy
          • Product Strategy
          • Channel Strategy
      • Papacks
        • Overview
        • Product Portfolio
        • Profitability by Market Segments (Product/Age /Sales Channel/Region)
        • Sales Footprint
        • Strategy Overview
          • Marketing Strategy
          • Product Strategy
          • Channel Strategy
      • FLOW Eco Bottle
        • Overview
        • Product Portfolio
        • Profitability by Market Segments (Product/Age /Sales Channel/Region)
        • Sales Footprint
        • Strategy Overview
          • Marketing Strategy
          • Product Strategy
          • Channel Strategy
      • Green Valley
        • Overview
        • Product Portfolio
        • Profitability by Market Segments (Product/Age /Sales Channel/Region)
        • Sales Footprint
        • Strategy Overview
          • Marketing Strategy
          • Product Strategy
          • Channel Strategy
      • Jabil
        • Overview
        • Product Portfolio
        • Profitability by Market Segments (Product/Age /Sales Channel/Region)
        • Sales Footprint
        • Strategy Overview
          • Marketing Strategy
          • Product Strategy
          • Channel Strategy
      • CMPC Maderas
        • Overview
        • Product Portfolio
        • Profitability by Market Segments (Product/Age /Sales Channel/Region)
        • Sales Footprint
        • Strategy Overview
          • Marketing Strategy
          • Product Strategy
          • Channel Strategy
  22. Assumptions & Acronyms Used
  23. Research Methodology

List of Tables

  • Table 1: Global Market Value (USD Billion) Forecast by Region, 2020 to 2035
  • Table 2: Global Market Volume (MT) Forecast by Region, 2020 to 2035
  • Table 3: Global Market Value (USD Billion) Forecast by Bottle Structure, 2020 to 2035
  • Table 4: Global Market Volume (MT) Forecast by Bottle Structure, 2020 to 2035
  • Table 5: Global Market Value (USD Billion) Forecast by Coating Type, 2020 to 2035
  • Table 6: Global Market Volume (MT) Forecast by Coating Type, 2020 to 2035
  • Table 7: Global Market Value (USD Billion) Forecast by Closure System, 2020 to 2035
  • Table 8: Global Market Volume (MT) Forecast by Closure System, 2020 to 2035
  • Table 9: Global Market Value (USD Billion) Forecast by Application, 2020 to 2035
  • Table 10: Global Market Volume (MT) Forecast by Application, 2020 to 2035
  • Table 11: Global Market Value (USD Billion) Forecast by End-Use Industry, 2020 to 2035
  • Table 12: Global Market Volume (MT) Forecast by End-Use Industry, 2020 to 2035
  • Table 13: North America Market Value (USD Billion) Forecast by Country, 2020 to 2035
  • Table 14: North America Market Volume (MT) Forecast by Country, 2020 to 2035
  • Table 15: North America Market Value (USD Billion) Forecast by Bottle Structure, 2020 to 2035
  • Table 16: North America Market Volume (MT) Forecast by Bottle Structure, 2020 to 2035
  • Table 17: North America Market Value (USD Billion) Forecast by Coating Type, 2020 to 2035
  • Table 18: North America Market Volume (MT) Forecast by Coating Type, 2020 to 2035
  • Table 19: North America Market Value (USD Billion) Forecast by Closure System, 2020 to 2035
  • Table 20: North America Market Volume (MT) Forecast by Closure System, 2020 to 2035
  • Table 21: North America Market Value (USD Billion) Forecast by Application, 2020 to 2035
  • Table 22: North America Market Volume (MT) Forecast by Application, 2020 to 2035
  • Table 23: North America Market Value (USD Billion) Forecast by End-Use Industry, 2020 to 2035
  • Table 24: North America Market Volume (MT) Forecast by End-Use Industry, 2020 to 2035
  • Table 25: Latin America Market Value (USD Billion) Forecast by Country, 2020 to 2035
  • Table 26: Latin America Market Volume (MT) Forecast by Country, 2020 to 2035
  • Table 27: Latin America Market Value (USD Billion) Forecast by Bottle Structure, 2020 to 2035
  • Table 28: Latin America Market Volume (MT) Forecast by Bottle Structure, 2020 to 2035
  • Table 29: Latin America Market Value (USD Billion) Forecast by Coating Type, 2020 to 2035
  • Table 30: Latin America Market Volume (MT) Forecast by Coating Type, 2020 to 2035
  • Table 31: Latin America Market Value (USD Billion) Forecast by Closure System, 2020 to 2035
  • Table 32: Latin America Market Volume (MT) Forecast by Closure System, 2020 to 2035
  • Table 33: Latin America Market Value (USD Billion) Forecast by Application, 2020 to 2035
  • Table 34: Latin America Market Volume (MT) Forecast by Application, 2020 to 2035
  • Table 35: Latin America Market Value (USD Billion) Forecast by End-Use Industry, 2020 to 2035
  • Table 36: Latin America Market Volume (MT) Forecast by End-Use Industry, 2020 to 2035
  • Table 37: Western Europe Market Value (USD Billion) Forecast by Country, 2020 to 2035
  • Table 38: Western Europe Market Volume (MT) Forecast by Country, 2020 to 2035
  • Table 39: Western Europe Market Value (USD Billion) Forecast by Bottle Structure, 2020 to 2035
  • Table 40: Western Europe Market Volume (MT) Forecast by Bottle Structure, 2020 to 2035
  • Table 41: Western Europe Market Value (USD Billion) Forecast by Coating Type, 2020 to 2035
  • Table 42: Western Europe Market Volume (MT) Forecast by Coating Type, 2020 to 2035
  • Table 43: Western Europe Market Value (USD Billion) Forecast by Closure System, 2020 to 2035
  • Table 44: Western Europe Market Volume (MT) Forecast by Closure System, 2020 to 2035
  • Table 45: Western Europe Market Value (USD Billion) Forecast by Application, 2020 to 2035
  • Table 46: Western Europe Market Volume (MT) Forecast by Application, 2020 to 2035
  • Table 47: Western Europe Market Value (USD Billion) Forecast by End-Use Industry, 2020 to 2035
  • Table 48: Western Europe Market Volume (MT) Forecast by End-Use Industry, 2020 to 2035
  • Table 49: Eastern Europe Market Value (USD Billion) Forecast by Country, 2020 to 2035
  • Table 50: Eastern Europe Market Volume (MT) Forecast by Country, 2020 to 2035
  • Table 51: Eastern Europe Market Value (USD Billion) Forecast by Bottle Structure, 2020 to 2035
  • Table 52: Eastern Europe Market Volume (MT) Forecast by Bottle Structure, 2020 to 2035
  • Table 53: Eastern Europe Market Value (USD Billion) Forecast by Coating Type, 2020 to 2035
  • Table 54: Eastern Europe Market Volume (MT) Forecast by Coating Type, 2020 to 2035
  • Table 55: Eastern Europe Market Value (USD Billion) Forecast by Closure System, 2020 to 2035
  • Table 56: Eastern Europe Market Volume (MT) Forecast by Closure System, 2020 to 2035
  • Table 57: Eastern Europe Market Value (USD Billion) Forecast by Application, 2020 to 2035
  • Table 58: Eastern Europe Market Volume (MT) Forecast by Application, 2020 to 2035
  • Table 59: Eastern Europe Market Value (USD Billion) Forecast by End-Use Industry, 2020 to 2035
  • Table 60: Eastern Europe Market Volume (MT) Forecast by End-Use Industry, 2020 to 2035
  • Table 61: East Asia Market Value (USD Billion) Forecast by Country, 2020 to 2035
  • Table 62: East Asia Market Volume (MT) Forecast by Country, 2020 to 2035
  • Table 63: East Asia Market Value (USD Billion) Forecast by Bottle Structure, 2020 to 2035
  • Table 64: East Asia Market Volume (MT) Forecast by Bottle Structure, 2020 to 2035
  • Table 65: East Asia Market Value (USD Billion) Forecast by Coating Type, 2020 to 2035
  • Table 66: East Asia Market Volume (MT) Forecast by Coating Type, 2020 to 2035
  • Table 67: East Asia Market Value (USD Billion) Forecast by Closure System, 2020 to 2035
  • Table 68: East Asia Market Volume (MT) Forecast by Closure System, 2020 to 2035
  • Table 69: East Asia Market Value (USD Billion) Forecast by Application, 2020 to 2035
  • Table 70: East Asia Market Volume (MT) Forecast by Application, 2020 to 2035
  • Table 71: East Asia Market Value (USD Billion) Forecast by End-Use Industry, 2020 to 2035
  • Table 72: East Asia Market Volume (MT) Forecast by End-Use Industry, 2020 to 2035
  • Table 73: South Asia & Pacific Market Value (USD Billion) Forecast by Country, 2020 to 2035
  • Table 74: South Asia & Pacific Market Volume (MT) Forecast by Country, 2020 to 2035
  • Table 75: South Asia & Pacific Market Value (USD Billion) Forecast by Bottle Structure, 2020 to 2035
  • Table 76: South Asia & Pacific Market Volume (MT) Forecast by Bottle Structure, 2020 to 2035
  • Table 77: South Asia & Pacific Market Value (USD Billion) Forecast by Coating Type, 2020 to 2035
  • Table 78: South Asia & Pacific Market Volume (MT) Forecast by Coating Type, 2020 to 2035
  • Table 79: South Asia & Pacific Market Value (USD Billion) Forecast by Closure System, 2020 to 2035
  • Table 80: South Asia & Pacific Market Volume (MT) Forecast by Closure System, 2020 to 2035
  • Table 81: South Asia & Pacific Market Value (USD Billion) Forecast by Application, 2020 to 2035
  • Table 82: South Asia & Pacific Market Volume (MT) Forecast by Application, 2020 to 2035
  • Table 83: South Asia & Pacific Market Value (USD Billion) Forecast by End-Use Industry, 2020 to 2035
  • Table 84: South Asia & Pacific Market Volume (MT) Forecast by End-Use Industry, 2020 to 2035
  • Table 85: Middle East and Africa Market Value (USD Billion) Forecast by Country, 2020 to 2035
  • Table 86: Middle East and Africa Market Volume (MT) Forecast by Country, 2020 to 2035
  • Table 87: Middle East and Africa Market Value (USD Billion) Forecast by Bottle Structure, 2020 to 2035
  • Table 88: Middle East and Africa Market Volume (MT) Forecast by Bottle Structure, 2020 to 2035
  • Table 89: Middle East and Africa Market Value (USD Billion) Forecast by Coating Type, 2020 to 2035
  • Table 90: Middle East and Africa Market Volume (MT) Forecast by Coating Type, 2020 to 2035
  • Table 91: Middle East and Africa Market Value (USD Billion) Forecast by Closure System, 2020 to 2035
  • Table 92: Middle East and Africa Market Volume (MT) Forecast by Closure System, 2020 to 2035
  • Table 93: Middle East and Africa Market Value (USD Billion) Forecast by Application, 2020 to 2035
  • Table 94: Middle East and Africa Market Volume (MT) Forecast by Application, 2020 to 2035
  • Table 95: Middle East and Africa Market Value (USD Billion) Forecast by End-Use Industry, 2020 to 2035
  • Table 96: Middle East and Africa Market Volume (MT) Forecast by End-Use Industry, 2020 to 2035

List of Figures

  • Figure 1: Global Market Volume (MT) Forecast 2020 to 2035
  • Figure 2: Global Market Pricing Analysis
  • Figure 3: Global Market Value (USD Billion) Forecast 2020 to 2035
  • Figure 4: Global Market Value Share and BPS Analysis by Bottle Structure, 2025 and 2035
  • Figure 5: Global Market Y-o-Y Growth Comparison by Bottle Structure, 2025 to 2035
  • Figure 6: Global Market Attractiveness Analysis by Bottle Structure
  • Figure 7: Global Market Value Share and BPS Analysis by Coating Type, 2025 and 2035
  • Figure 8: Global Market Y-o-Y Growth Comparison by Coating Type, 2025 to 2035
  • Figure 9: Global Market Attractiveness Analysis by Coating Type
  • Figure 10: Global Market Value Share and BPS Analysis by Closure System, 2025 and 2035
  • Figure 11: Global Market Y-o-Y Growth Comparison by Closure System, 2025 to 2035
  • Figure 12: Global Market Attractiveness Analysis by Closure System
  • Figure 13: Global Market Value Share and BPS Analysis by Application, 2025 and 2035
  • Figure 14: Global Market Y-o-Y Growth Comparison by Application, 2025 to 2035
  • Figure 15: Global Market Attractiveness Analysis by Application
  • Figure 16: Global Market Value Share and BPS Analysis by End-Use Industry, 2025 and 2035
  • Figure 17: Global Market Y-o-Y Growth Comparison by End-Use Industry, 2025 to 2035
  • Figure 18: Global Market Attractiveness Analysis by End-Use Industry
  • Figure 19: Global Market Value (USD Billion) Share and BPS Analysis by Region, 2025 and 2035
  • Figure 20: Global Market Y-o-Y Growth Comparison by Region, 2025 to 2035
  • Figure 21: Global Market Attractiveness Analysis by Region
  • Figure 22: North America Market Incremental $ Opportunity, 2025 to 2035
  • Figure 23: Latin America Market Incremental $ Opportunity, 2025 to 2035
  • Figure 24: Western Europe Market Incremental $ Opportunity, 2025 to 2035
  • Figure 25: Eastern Europe Market Incremental $ Opportunity, 2025 to 2035
  • Figure 26: East Asia Market Incremental $ Opportunity, 2025 to 2035
  • Figure 27: South Asia & Pacific Market Incremental $ Opportunity, 2025 to 2035
  • Figure 28: Middle East and Africa Market Incremental $ Opportunity, 2025 to 2035
  • Figure 29: North America Market Value Share and BPS Analysis by Country, 2025 and 2035
  • Figure 30: North America Market Value Share and BPS Analysis by Bottle Structure, 2025 and 2035
  • Figure 31: North America Market Y-o-Y Growth Comparison by Bottle Structure, 2025 to 2035
  • Figure 32: North America Market Attractiveness Analysis by Bottle Structure
  • Figure 33: North America Market Value Share and BPS Analysis by Coating Type, 2025 and 2035
  • Figure 34: North America Market Y-o-Y Growth Comparison by Coating Type, 2025 to 2035
  • Figure 35: North America Market Attractiveness Analysis by Coating Type
  • Figure 36: North America Market Value Share and BPS Analysis by Closure System, 2025 and 2035
  • Figure 37: North America Market Y-o-Y Growth Comparison by Closure System, 2025 to 2035
  • Figure 38: North America Market Attractiveness Analysis by Closure System
  • Figure 39: North America Market Value Share and BPS Analysis by Application, 2025 and 2035
  • Figure 40: North America Market Y-o-Y Growth Comparison by Application, 2025 to 2035
  • Figure 41: North America Market Attractiveness Analysis by Application
  • Figure 42: North America Market Value Share and BPS Analysis by End-Use Industry, 2025 and 2035
  • Figure 43: North America Market Y-o-Y Growth Comparison by End-Use Industry, 2025 to 2035
  • Figure 44: North America Market Attractiveness Analysis by End-Use Industry
  • Figure 45: Latin America Market Value Share and BPS Analysis by Country, 2025 and 2035
  • Figure 46: Latin America Market Value Share and BPS Analysis by Bottle Structure, 2025 and 2035
  • Figure 47: Latin America Market Y-o-Y Growth Comparison by Bottle Structure, 2025 to 2035
  • Figure 48: Latin America Market Attractiveness Analysis by Bottle Structure
  • Figure 49: Latin America Market Value Share and BPS Analysis by Coating Type, 2025 and 2035
  • Figure 50: Latin America Market Y-o-Y Growth Comparison by Coating Type, 2025 to 2035
  • Figure 51: Latin America Market Attractiveness Analysis by Coating Type
  • Figure 52: Latin America Market Value Share and BPS Analysis by Closure System, 2025 and 2035
  • Figure 53: Latin America Market Y-o-Y Growth Comparison by Closure System, 2025 to 2035
  • Figure 54: Latin America Market Attractiveness Analysis by Closure System
  • Figure 55: Latin America Market Value Share and BPS Analysis by Application, 2025 and 2035
  • Figure 56: Latin America Market Y-o-Y Growth Comparison by Application, 2025 to 2035
  • Figure 57: Latin America Market Attractiveness Analysis by Application
  • Figure 58: Latin America Market Value Share and BPS Analysis by End-Use Industry, 2025 and 2035
  • Figure 59: Latin America Market Y-o-Y Growth Comparison by End-Use Industry, 2025 to 2035
  • Figure 60: Latin America Market Attractiveness Analysis by End-Use Industry
  • Figure 61: Western Europe Market Value Share and BPS Analysis by Country, 2025 and 2035
  • Figure 62: Western Europe Market Value Share and BPS Analysis by Bottle Structure, 2025 and 2035
  • Figure 63: Western Europe Market Y-o-Y Growth Comparison by Bottle Structure, 2025 to 2035
  • Figure 64: Western Europe Market Attractiveness Analysis by Bottle Structure
  • Figure 65: Western Europe Market Value Share and BPS Analysis by Coating Type, 2025 and 2035
  • Figure 66: Western Europe Market Y-o-Y Growth Comparison by Coating Type, 2025 to 2035
  • Figure 67: Western Europe Market Attractiveness Analysis by Coating Type
  • Figure 68: Western Europe Market Value Share and BPS Analysis by Closure System, 2025 and 2035
  • Figure 69: Western Europe Market Y-o-Y Growth Comparison by Closure System, 2025 to 2035
  • Figure 70: Western Europe Market Attractiveness Analysis by Closure System
  • Figure 71: Western Europe Market Value Share and BPS Analysis by Application, 2025 and 2035
  • Figure 72: Western Europe Market Y-o-Y Growth Comparison by Application, 2025 to 2035
  • Figure 73: Western Europe Market Attractiveness Analysis by Application
  • Figure 74: Western Europe Market Value Share and BPS Analysis by End-Use Industry, 2025 and 2035
  • Figure 75: Western Europe Market Y-o-Y Growth Comparison by End-Use Industry, 2025 to 2035
  • Figure 76: Western Europe Market Attractiveness Analysis by End-Use Industry
  • Figure 77: Eastern Europe Market Value Share and BPS Analysis by Country, 2025 and 2035
  • Figure 78: Eastern Europe Market Value Share and BPS Analysis by Bottle Structure, 2025 and 2035
  • Figure 79: Eastern Europe Market Y-o-Y Growth Comparison by Bottle Structure, 2025 to 2035
  • Figure 80: Eastern Europe Market Attractiveness Analysis by Bottle Structure
  • Figure 81: Eastern Europe Market Value Share and BPS Analysis by Coating Type, 2025 and 2035
  • Figure 82: Eastern Europe Market Y-o-Y Growth Comparison by Coating Type, 2025 to 2035
  • Figure 83: Eastern Europe Market Attractiveness Analysis by Coating Type
  • Figure 84: Eastern Europe Market Value Share and BPS Analysis by Closure System, 2025 and 2035
  • Figure 85: Eastern Europe Market Y-o-Y Growth Comparison by Closure System, 2025 to 2035
  • Figure 86: Eastern Europe Market Attractiveness Analysis by Closure System
  • Figure 87: Eastern Europe Market Value Share and BPS Analysis by Application, 2025 and 2035
  • Figure 88: Eastern Europe Market Y-o-Y Growth Comparison by Application, 2025 to 2035
  • Figure 89: Eastern Europe Market Attractiveness Analysis by Application
  • Figure 90: Eastern Europe Market Value Share and BPS Analysis by End-Use Industry, 2025 and 2035
  • Figure 91: Eastern Europe Market Y-o-Y Growth Comparison by End-Use Industry, 2025 to 2035
  • Figure 92: Eastern Europe Market Attractiveness Analysis by End-Use Industry
  • Figure 93: East Asia Market Value Share and BPS Analysis by Country, 2025 and 2035
  • Figure 94: East Asia Market Value Share and BPS Analysis by Bottle Structure, 2025 and 2035
  • Figure 95: East Asia Market Y-o-Y Growth Comparison by Bottle Structure, 2025 to 2035
  • Figure 96: East Asia Market Attractiveness Analysis by Bottle Structure
  • Figure 97: East Asia Market Value Share and BPS Analysis by Coating Type, 2025 and 2035
  • Figure 98: East Asia Market Y-o-Y Growth Comparison by Coating Type, 2025 to 2035
  • Figure 99: East Asia Market Attractiveness Analysis by Coating Type
  • Figure 100: East Asia Market Value Share and BPS Analysis by Closure System, 2025 and 2035
  • Figure 101: East Asia Market Y-o-Y Growth Comparison by Closure System, 2025 to 2035
  • Figure 102: East Asia Market Attractiveness Analysis by Closure System
  • Figure 103: East Asia Market Value Share and BPS Analysis by Application, 2025 and 2035
  • Figure 104: East Asia Market Y-o-Y Growth Comparison by Application, 2025 to 2035
  • Figure 105: East Asia Market Attractiveness Analysis by Application
  • Figure 106: East Asia Market Value Share and BPS Analysis by End-Use Industry, 2025 and 2035
  • Figure 107: East Asia Market Y-o-Y Growth Comparison by End-Use Industry, 2025 to 2035
  • Figure 108: East Asia Market Attractiveness Analysis by End-Use Industry
  • Figure 109: South Asia & Pacific Market Value Share and BPS Analysis by Country, 2025 and 2035
  • Figure 110: South Asia & Pacific Market Value Share and BPS Analysis by Bottle Structure, 2025 and 2035
  • Figure 111: South Asia & Pacific Market Y-o-Y Growth Comparison by Bottle Structure, 2025 to 2035
  • Figure 112: South Asia & Pacific Market Attractiveness Analysis by Bottle Structure
  • Figure 113: South Asia & Pacific Market Value Share and BPS Analysis by Coating Type, 2025 and 2035
  • Figure 114: South Asia & Pacific Market Y-o-Y Growth Comparison by Coating Type, 2025 to 2035
  • Figure 115: South Asia & Pacific Market Attractiveness Analysis by Coating Type
  • Figure 116: South Asia & Pacific Market Value Share and BPS Analysis by Closure System, 2025 and 2035
  • Figure 117: South Asia & Pacific Market Y-o-Y Growth Comparison by Closure System, 2025 to 2035
  • Figure 118: South Asia & Pacific Market Attractiveness Analysis by Closure System
  • Figure 119: South Asia & Pacific Market Value Share and BPS Analysis by Application, 2025 and 2035
  • Figure 120: South Asia & Pacific Market Y-o-Y Growth Comparison by Application, 2025 to 2035
  • Figure 121: South Asia & Pacific Market Attractiveness Analysis by Application
  • Figure 122: South Asia & Pacific Market Value Share and BPS Analysis by End-Use Industry, 2025 and 2035
  • Figure 123: South Asia & Pacific Market Y-o-Y Growth Comparison by End-Use Industry, 2025 to 2035
  • Figure 124: South Asia & Pacific Market Attractiveness Analysis by End-Use Industry
  • Figure 125: Middle East and Africa Market Value Share and BPS Analysis by Country, 2025 and 2035
  • Figure 126: Middle East and Africa Market Value Share and BPS Analysis by Bottle Structure, 2025 and 2035
  • Figure 127: Middle East and Africa Market Y-o-Y Growth Comparison by Bottle Structure, 2025 to 2035
  • Figure 128: Middle East and Africa Market Attractiveness Analysis by Bottle Structure
  • Figure 129: Middle East and Africa Market Value Share and BPS Analysis by Coating Type, 2025 and 2035
  • Figure 130: Middle East and Africa Market Y-o-Y Growth Comparison by Coating Type, 2025 to 2035
  • Figure 131: Middle East and Africa Market Attractiveness Analysis by Coating Type
  • Figure 132: Middle East and Africa Market Value Share and BPS Analysis by Closure System, 2025 and 2035
  • Figure 133: Middle East and Africa Market Y-o-Y Growth Comparison by Closure System, 2025 to 2035
  • Figure 134: Middle East and Africa Market Attractiveness Analysis by Closure System
  • Figure 135: Middle East and Africa Market Value Share and BPS Analysis by Application, 2025 and 2035
  • Figure 136: Middle East and Africa Market Y-o-Y Growth Comparison by Application, 2025 to 2035
  • Figure 137: Middle East and Africa Market Attractiveness Analysis by Application
  • Figure 138: Middle East and Africa Market Value Share and BPS Analysis by End-Use Industry, 2025 and 2035
  • Figure 139: Middle East and Africa Market Y-o-Y Growth Comparison by End-Use Industry, 2025 to 2035
  • Figure 140: Middle East and Africa Market Attractiveness Analysis by End-Use Industry
  • Figure 141: Global Market - Tier Structure Analysis
  • Figure 142: Global Market - Company Share Analysis

Frequently Asked Questions

What is the projected market size for fiber bottles by 2035?

The fiber bottle market is expected to reach USD 5.1 billion by 2035, up from USD 2.7 billion in 2025.

What CAGR is the fiber bottle market anticipated to record between 2025 and 2035?

The market is projected to grow at a CAGR of 6.6% over the forecast period.

What share of protective linings in fiber bottles will water-based coatings represent in 2025?

Water-based coatings are forecast to account for 58% of protective lining usage in 2025.

How much of the fiber bottle market is allocated to beverage packaging in 2025?

Beverage applications are estimated to capture 42% of total fiber bottle demand in 2025.

Which country shows the fastest projected growth rate for fiber bottles?

India leads with a forecast CAGR of 8.9% from 2025 to 2035.

Explore Similar Insights

Future Market Insights

Fiber Bottle Market