The global fiber optic test equipment market is expected to grow from USD 1.0 billion in 2025 to USD 1.68 billion by 2035. The market is poised to expand at a 5.1% CAGR during the forecast period. Growth is being driven by rising demand across telecommunications, data centers, and industrial automation applications. Fiber optic test equipment offers critical advantages such as high-speed data transmission verification, network reliability, and performance monitoring, which make it ideal for ensuring optimal fiber optic network operations.
The surge in 5G network adoption and the increasing demand for high-bandwidth applications have created sustained demand for advanced testing solutions. Additionally, as data traffic continues to rise globally, industries are investing heavily in fiber optic infrastructure, further propelling the market for testing equipment.
Product innovation and technological advancements are further accelerating market momentum. Leading manufacturers are investing in developing more accurate, faster, and cost-effective fiber optic test solutions to meet the evolving demands of high-performance networks. From advanced fiber optic analyzers to compact, portable testing tools, the market is seeing innovations that offer improved testing capabilities for both commercial and industrial applications. Automation and remote monitoring are also becoming key trends in the industry, offering end users greater flexibility and efficiency in managing their fiber optic networks. These advancements are helping companies gain a competitive advantage while meeting the growing demand for high-quality network testing solutions.
Moreover, the fiber optic test equipment market is likely to benefit from tightening industry regulations and shifting technological priorities. Regulatory bodies such as the USA. Federal Communications Commission (FCC) and European Telecommunications Standards Institute (ETSI) are enforcing stricter standards on fiber optic networks, pushing companies to adopt high-performance test equipment that meets compliance requirements.
Regulations like the Restriction of Hazardous Substances (RoHS) and environmental directives are also encouraging manufacturers to develop eco-friendly and sustainable testing solutions. As the need for efficient, reliable, and sustainable networks becomes a priority, the fiber optic test equipment market is likely to witness increased adoption across industries seeking to maintain and optimize their fiber optic infrastructure.
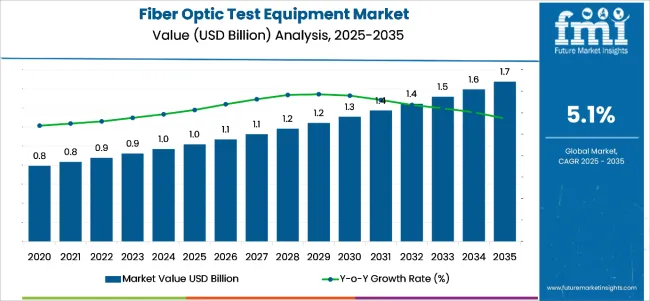
| Metric | Value |
|---|---|
| Industry Size (2025E) | USD 1.0 billion |
| Industry Value (2035F) | USD 1.68 billion |
| CAGR (2025 to 2035) | 5.1% |
The export-import dynamics in the fiber optic test equipment market are heavily influenced by the demand for high-speed broadband, telecom infrastructure expansion, and 5G deployment across emerging and developed regions. Equipment such as OTDRs, light sources, power meters, and inspection probes are primarily manufactured in technologically advanced countries and exported to high-growth telecom markets globally.
Asia-Pacific remains a major exporter of fiber optic test equipment, led by manufacturing hubs in China, Japan, and South Korea. These countries supply equipment to Europe, North America, the Middle East, and Southeast Asia to support large-scale fiber rollout and maintenance operations.
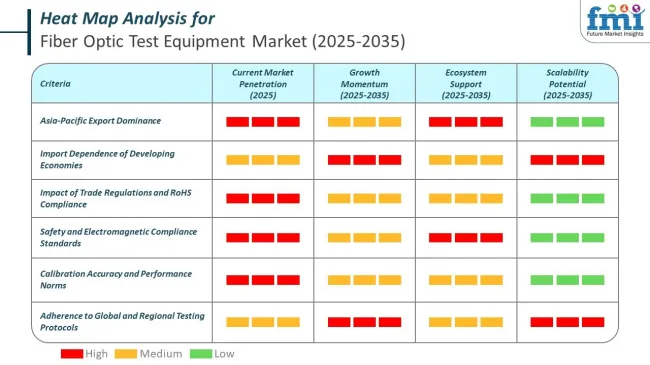
Government regulations in the fiber optic test equipment market are primarily focused on safety, electromagnetic compliance, calibration accuracy, and network performance standards. These regulations ensure that the equipment used in telecom, defense, and industrial applications is reliable, precise, and interoperable with global fiber infrastructure systems.
Several regulatory bodies and international standards influence the design, testing, and marketing of fiber optic test equipment across regions. Compliance with these norms is essential for global trade and certification.
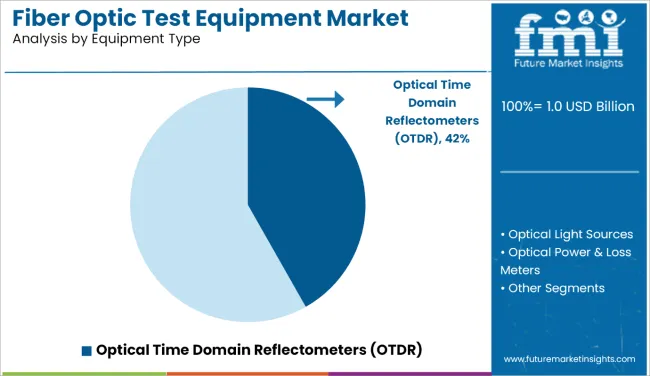
Increased deployment of fiber optic networks in telecommunications, such as telephone and computer cables; data centers, which store information over networks that it can be retrieved when needed by individual users or businesses; and industrial applications means the Fiber Optic Test Equipment Market is booming. One category of the modern Fiber Optic Test Equipment Market can be divided into different industries, equipment types and portability types.
Each of these divisions has a tendency to contribute to this rising industry. These OTDRs are widely used today in the optical fibe network deployment, operations and maintenance.
The propagation of 5G networks, with broadband services expanding and high speed data transfers have created demand for even more accurate fiber characterization now that development is critical to ensuring consistent speed throughout any optical fiber route permitted. So demand for OTDRs is growing.
In addition, compact OTDRs with real-time analytics and cloud-based data storage have been developed to meet wide-ranging user needs across many industrial sectors. Network equipment manufacturers are also integrating AI-based fault diagnostics, automated reporting features and fiber mapping (which is large scale) in order to improve overall network reliability and reduce network downtime.
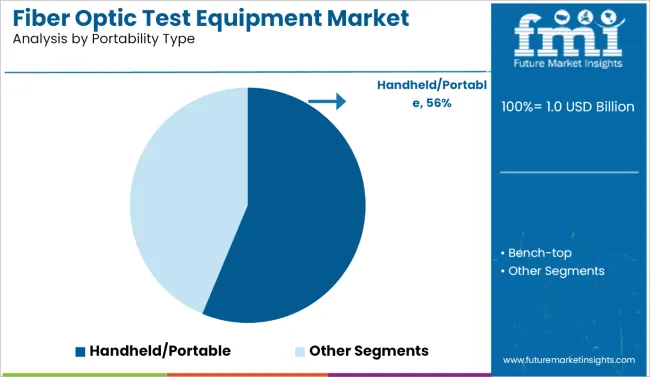
The market is segmented by portability type, including handheld/portable and bench-top fiber optic test equipment. Among these, the handheld/portable segment leads the market with an estimated 56% market share by 2025.
The rapid expansion of fiber optic networks into more diverse regions and remote areas of the world has driven up demand for portable field-ready test instruments. Convenient diagnostics tools make it possible for technicians working in outside environments-construction sites to tell whether or not there are any faults in the network at a moment’s notice-in real time.
The increasing deployment of 5G, fiber-to-the-home (FTTH) expansions and enterprise networking solutions has further heightened the need for small, lightweight battery-operated fibre-optic testing tools which Devices supply fibre health feedback on an instant basis, loss measurements. Today's devices give technicians instantaneous status checks on connectivity, No longer do they have to stop and think. This means that service can be restored quickly without days of shutdowns or substantial inconvenience.
Leading manufacturers are embedding Wi-Fi and cloud connectivity as well as touch screen interfaces and automatic test functions into portable devices. With the increasing scale of telecom operators optical fiber network build, the market for reliable easy-to-carry mirrors is expected to drive up the handheld segment's growth.
Fiber optic test equipment are a constant item of investment, and top-of-the-range stuff like OTDRs (Optical Time -Domain Reflectometers) as well as spectrum analysers are very expensive. This is a challenge for small and medium-sized businesses in the telecommunications and data center sectors.
Fiber optic test equipment requires specialized know-how and training. Most businesses are not only short of professionals able to interpret results and deal with network problems, they also lack trained technical staff.
Strong 5 G networks and the increasing demand for high-speed internet are leading to significant investments in fiber optic building materials. This expansion directly drives the demand for testing and maintenance equipment in order to guarantee network performance and life expectancy.
Innovations in automated testing.AI-powered diagnostic instruments and cloud monitoring make fiber optic network maintenance more efficient. These advances open up to a wider range of sectors testing.
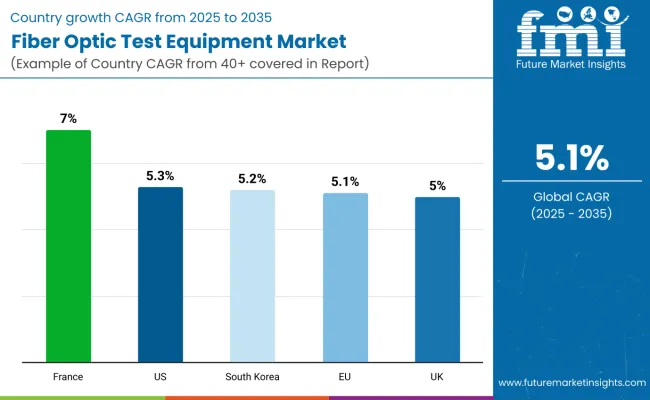
Amid the United States Fiber Optic Test Equipment Market's increasing demand for high-speed internet and the enhancement transfer medium type needed to move video, expand networks. The recent development of Internet of Things (IoT) industries has made it possible.
| Country | CAGR (2025 to 2035) |
|---|---|
| United States | 5.3% |
The fiber optic test equipment market in the United Kingdom is expanding. This is due to investments by telecommunications operators into fiber optic networks needed for digital transformation. Efficient test solutions for data centers and telecommunications infrastructure are urgently needed. Also, a broad broadband push by government policy is good for the market.
| Country | CAGR (2025 to 2035) |
|---|---|
| United Kingdom | 5.0% |
An ambitious Fiber Optic Test Equipment Market aimed at the countries of the European Union is being nourished by vigorous government action to push fiber-to-the-home (FTTH) deployment. The major countries such as Germany, France and Spain are all heavily into fiber-optic infrastructure. The demand for high-end test solutions on both telecoms and data center application sight is driving market growth.
| Country | CAGR (2025 to 2035) |
|---|---|
| European Union | 5.1% |
The Fiber Optic Test Equipment Market in South Korea is experiencing rapid expansion due to this nation's leadership in telecommunications and 5G deployment. With very high rate internet penetration and strong government backing for fiber-optic networks, the market is in urgent need of reliable testing solutions. Increasing cloud computing adoption will also fuel growth.
| Country | CAGR (2025 to 2035) |
|---|---|
| South Korea | 5.2% |
A leader in fiber optic test and measurement, VIAVI offers cutting-edge OTDR solutions and network testing tools for telecom and data center applications.
EXFO specializes in AI-driven automated fiber testing, providing innovative solutions to telecom providers for efficient network diagnostics.
Anritsu focuses on high-speed fiber loss testing and infrastructure optimization, collaborating with key network operators worldwide.
Yokogawa is recognized for its precision optical spectrum analyzers, catering to the growing demand for accurate fiber testing solutions.
Fluke is a key player in field-friendly fiber verification tools and cloud-based network monitoring software.
| Report Attributes | Details |
|---|---|
| Current Total Market Size (2025) | USD 1.0 billion |
| Projected Market Size (2035) | USD 1.68 billion |
| CAGR (2025 to 2035) | 5.1% |
| Base Year for Estimation | 2024 |
| Historical Period | 2020 to 2024 |
| Projections Period | 2025 to 2035 |
| Report Parameter | Revenue in USD million/ Volume in units |
| By Equipment Type | Optical Light Sources, Optical Power & Loss Meters, Remote Fiber Test Systems, Optical Time Domain Reflectometers, Optical Spectrum Analyzers, Other Test Equipment |
| By Portability Type | Handheld/Portable and Bench-top |
| By End Use | Telecommunication Service Providers, Network Equipment Manufacturers, Data Centers, Cable Operators, Educational & Research Institutes |
| Regions Covered | North America, Latin America, Western Europe, Eastern Europe, South Asia and Pacific, East Asia, Middle East, and Africa |
| Countries Covered | United States, Japan, Germany, India, United Kingdom, France, Italy, Brazil, Canada, South Korea, Australia, Spain, Netherlands, Saudi Arabia, Switzerland |
| Key Players | Anritsu, Keysight Technologies, Viavi Solutions, EXFO, National Instruments, and Yokogawa Electric |
| Additional Attributes | Dollar sales by value, market share analysis by region, country-wise analysis |
| Customization and Pricing | Available upon request |
The global fiber optic test equipment market is projected to reach USD 1.68 billion by 2035, growing from USD 1.0 billion in 2025, at a CAGR of 5.1%.
The optical time-domain reflectometer (OTDR) segment is expected to hold the largest share, driven by high demand for fiber network maintenance.
North America is expected to account for the largest share, driven by high investments in high-speed internet infrastructure and 5G deployment.
Rising demand for 5G networks, increased data traffic, and the need for reliable network performance testing are key drivers.
Key players include VIAVI Solutions, EXFO Inc., Anritsu Corporation, Yokogawa Electric Corporation, and Fluke Corporation.
Table 1: Global Market Value (US$ Million) Forecast by Region, 2018 to 2033
Table 2: Global Market Value (US$ Million) Forecast by Equipment Type, 2018 to 2033
Table 3: Global Market Value (US$ Million) Forecast by Portability Type, 2018 to 2033
Table 4: Global Market Value (US$ Million) Forecast by End use, 2018 to 2033
Table 5: North America Market Value (US$ Million) Forecast by Country, 2018 to 2033
Table 6: North America Market Value (US$ Million) Forecast by Equipment Type, 2018 to 2033
Table 7: North America Market Value (US$ Million) Forecast by Portability Type, 2018 to 2033
Table 8: North America Market Value (US$ Million) Forecast by End use, 2018 to 2033
Table 9: Latin America Market Value (US$ Million) Forecast by Country, 2018 to 2033
Table 10: Latin America Market Value (US$ Million) Forecast by Equipment Type, 2018 to 2033
Table 11: Latin America Market Value (US$ Million) Forecast by Portability Type, 2018 to 2033
Table 12: Latin America Market Value (US$ Million) Forecast by End use, 2018 to 2033
Table 13: Europe Market Value (US$ Million) Forecast by Country, 2018 to 2033
Table 14: Europe Market Value (US$ Million) Forecast by Equipment Type, 2018 to 2033
Table 15: Europe Market Value (US$ Million) Forecast by Portability Type, 2018 to 2033
Table 16: Europe Market Value (US$ Million) Forecast by End use, 2018 to 2033
Table 17: South Asia Market Value (US$ Million) Forecast by Country, 2018 to 2033
Table 18: South Asia Market Value (US$ Million) Forecast by Equipment Type, 2018 to 2033
Table 19: South Asia Market Value (US$ Million) Forecast by Portability Type, 2018 to 2033
Table 20: South Asia Market Value (US$ Million) Forecast by End use, 2018 to 2033
Table 21: East Asia Market Value (US$ Million) Forecast by Country, 2018 to 2033
Table 22: East Asia Market Value (US$ Million) Forecast by Equipment Type, 2018 to 2033
Table 23: East Asia Market Value (US$ Million) Forecast by Portability Type, 2018 to 2033
Table 24: East Asia Market Value (US$ Million) Forecast by End use, 2018 to 2033
Table 25: Oceania Market Value (US$ Million) Forecast by Country, 2018 to 2033
Table 26: Oceania Market Value (US$ Million) Forecast by Equipment Type, 2018 to 2033
Table 27: Oceania Market Value (US$ Million) Forecast by Portability Type, 2018 to 2033
Table 28: Oceania Market Value (US$ Million) Forecast by End use, 2018 to 2033
Table 29: MEA Market Value (US$ Million) Forecast by Country, 2018 to 2033
Table 30: MEA Market Value (US$ Million) Forecast by Equipment Type, 2018 to 2033
Table 31: MEA Market Value (US$ Million) Forecast by Portability Type, 2018 to 2033
Table 32: MEA Market Value (US$ Million) Forecast by End use, 2018 to 2033
Figure 1: Global Market Value (US$ Million) by Equipment Type, 2023 to 2033
Figure 2: Global Market Value (US$ Million) by Portability Type, 2023 to 2033
Figure 3: Global Market Value (US$ Million) by End use, 2023 to 2033
Figure 4: Global Market Value (US$ Million) by Region, 2023 to 2033
Figure 5: Global Market Value (US$ Million) Analysis by Region, 2018 to 2033
Figure 6: Global Market Value Share (%) and BPS Analysis by Region, 2023 to 2033
Figure 7: Global Market Y-o-Y Growth (%) Projections by Region, 2023 to 2033
Figure 8: Global Market Value (US$ Million) Analysis by Equipment Type, 2018 to 2033
Figure 9: Global Market Value Share (%) and BPS Analysis by Equipment Type, 2023 to 2033
Figure 10: Global Market Y-o-Y Growth (%) Projections by Equipment Type, 2023 to 2033
Figure 11: Global Market Value (US$ Million) Analysis by Portability Type, 2018 to 2033
Figure 12: Global Market Value Share (%) and BPS Analysis by Portability Type, 2023 to 2033
Figure 13: Global Market Y-o-Y Growth (%) Projections by Portability Type, 2023 to 2033
Figure 14: Global Market Value (US$ Million) Analysis by End use, 2018 to 2033
Figure 15: Global Market Value Share (%) and BPS Analysis by End use, 2023 to 2033
Figure 16: Global Market Y-o-Y Growth (%) Projections by End use, 2023 to 2033
Figure 17: Global Market Attractiveness by Equipment Type, 2023 to 2033
Figure 18: Global Market Attractiveness by Portability Type, 2023 to 2033
Figure 19: Global Market Attractiveness by End use, 2023 to 2033
Figure 20: Global Market Attractiveness by Region, 2023 to 2033
Figure 21: North America Market Value (US$ Million) by Equipment Type, 2023 to 2033
Figure 22: North America Market Value (US$ Million) by Portability Type, 2023 to 2033
Figure 23: North America Market Value (US$ Million) by End use, 2023 to 2033
Figure 24: North America Market Value (US$ Million) by Country, 2023 to 2033
Figure 25: North America Market Value (US$ Million) Analysis by Country, 2018 to 2033
Figure 26: North America Market Value Share (%) and BPS Analysis by Country, 2023 to 2033
Figure 27: North America Market Y-o-Y Growth (%) Projections by Country, 2023 to 2033
Figure 28: North America Market Value (US$ Million) Analysis by Equipment Type, 2018 to 2033
Figure 29: North America Market Value Share (%) and BPS Analysis by Equipment Type, 2023 to 2033
Figure 30: North America Market Y-o-Y Growth (%) Projections by Equipment Type, 2023 to 2033
Figure 31: North America Market Value (US$ Million) Analysis by Portability Type, 2018 to 2033
Figure 32: North America Market Value Share (%) and BPS Analysis by Portability Type, 2023 to 2033
Figure 33: North America Market Y-o-Y Growth (%) Projections by Portability Type, 2023 to 2033
Figure 34: North America Market Value (US$ Million) Analysis by End use, 2018 to 2033
Figure 35: North America Market Value Share (%) and BPS Analysis by End use, 2023 to 2033
Figure 36: North America Market Y-o-Y Growth (%) Projections by End use, 2023 to 2033
Figure 37: North America Market Attractiveness by Equipment Type, 2023 to 2033
Figure 38: North America Market Attractiveness by Portability Type, 2023 to 2033
Figure 39: North America Market Attractiveness by End use, 2023 to 2033
Figure 40: North America Market Attractiveness by Country, 2023 to 2033
Figure 41: Latin America Market Value (US$ Million) by Equipment Type, 2023 to 2033
Figure 42: Latin America Market Value (US$ Million) by Portability Type, 2023 to 2033
Figure 43: Latin America Market Value (US$ Million) by End use, 2023 to 2033
Figure 44: Latin America Market Value (US$ Million) by Country, 2023 to 2033
Figure 45: Latin America Market Value (US$ Million) Analysis by Country, 2018 to 2033
Figure 46: Latin America Market Value Share (%) and BPS Analysis by Country, 2023 to 2033
Figure 47: Latin America Market Y-o-Y Growth (%) Projections by Country, 2023 to 2033
Figure 48: Latin America Market Value (US$ Million) Analysis by Equipment Type, 2018 to 2033
Figure 49: Latin America Market Value Share (%) and BPS Analysis by Equipment Type, 2023 to 2033
Figure 50: Latin America Market Y-o-Y Growth (%) Projections by Equipment Type, 2023 to 2033
Figure 51: Latin America Market Value (US$ Million) Analysis by Portability Type, 2018 to 2033
Figure 52: Latin America Market Value Share (%) and BPS Analysis by Portability Type, 2023 to 2033
Figure 53: Latin America Market Y-o-Y Growth (%) Projections by Portability Type, 2023 to 2033
Figure 54: Latin America Market Value (US$ Million) Analysis by End use, 2018 to 2033
Figure 55: Latin America Market Value Share (%) and BPS Analysis by End use, 2023 to 2033
Figure 56: Latin America Market Y-o-Y Growth (%) Projections by End use, 2023 to 2033
Figure 57: Latin America Market Attractiveness by Equipment Type, 2023 to 2033
Figure 58: Latin America Market Attractiveness by Portability Type, 2023 to 2033
Figure 59: Latin America Market Attractiveness by End use, 2023 to 2033
Figure 60: Latin America Market Attractiveness by Country, 2023 to 2033
Figure 61: Europe Market Value (US$ Million) by Equipment Type, 2023 to 2033
Figure 62: Europe Market Value (US$ Million) by Portability Type, 2023 to 2033
Figure 63: Europe Market Value (US$ Million) by End use, 2023 to 2033
Figure 64: Europe Market Value (US$ Million) by Country, 2023 to 2033
Figure 65: Europe Market Value (US$ Million) Analysis by Country, 2018 to 2033
Figure 66: Europe Market Value Share (%) and BPS Analysis by Country, 2023 to 2033
Figure 67: Europe Market Y-o-Y Growth (%) Projections by Country, 2023 to 2033
Figure 68: Europe Market Value (US$ Million) Analysis by Equipment Type, 2018 to 2033
Figure 69: Europe Market Value Share (%) and BPS Analysis by Equipment Type, 2023 to 2033
Figure 70: Europe Market Y-o-Y Growth (%) Projections by Equipment Type, 2023 to 2033
Figure 71: Europe Market Value (US$ Million) Analysis by Portability Type, 2018 to 2033
Figure 72: Europe Market Value Share (%) and BPS Analysis by Portability Type, 2023 to 2033
Figure 73: Europe Market Y-o-Y Growth (%) Projections by Portability Type, 2023 to 2033
Figure 74: Europe Market Value (US$ Million) Analysis by End use, 2018 to 2033
Figure 75: Europe Market Value Share (%) and BPS Analysis by End use, 2023 to 2033
Figure 76: Europe Market Y-o-Y Growth (%) Projections by End use, 2023 to 2033
Figure 77: Europe Market Attractiveness by Equipment Type, 2023 to 2033
Figure 78: Europe Market Attractiveness by Portability Type, 2023 to 2033
Figure 79: Europe Market Attractiveness by End use, 2023 to 2033
Figure 80: Europe Market Attractiveness by Country, 2023 to 2033
Figure 81: South Asia Market Value (US$ Million) by Equipment Type, 2023 to 2033
Figure 82: South Asia Market Value (US$ Million) by Portability Type, 2023 to 2033
Figure 83: South Asia Market Value (US$ Million) by End use, 2023 to 2033
Figure 84: South Asia Market Value (US$ Million) by Country, 2023 to 2033
Figure 85: South Asia Market Value (US$ Million) Analysis by Country, 2018 to 2033
Figure 86: South Asia Market Value Share (%) and BPS Analysis by Country, 2023 to 2033
Figure 87: South Asia Market Y-o-Y Growth (%) Projections by Country, 2023 to 2033
Figure 88: South Asia Market Value (US$ Million) Analysis by Equipment Type, 2018 to 2033
Figure 89: South Asia Market Value Share (%) and BPS Analysis by Equipment Type, 2023 to 2033
Figure 90: South Asia Market Y-o-Y Growth (%) Projections by Equipment Type, 2023 to 2033
Figure 91: South Asia Market Value (US$ Million) Analysis by Portability Type, 2018 to 2033
Figure 92: South Asia Market Value Share (%) and BPS Analysis by Portability Type, 2023 to 2033
Figure 93: South Asia Market Y-o-Y Growth (%) Projections by Portability Type, 2023 to 2033
Figure 94: South Asia Market Value (US$ Million) Analysis by End use, 2018 to 2033
Figure 95: South Asia Market Value Share (%) and BPS Analysis by End use, 2023 to 2033
Figure 96: South Asia Market Y-o-Y Growth (%) Projections by End use, 2023 to 2033
Figure 97: South Asia Market Attractiveness by Equipment Type, 2023 to 2033
Figure 98: South Asia Market Attractiveness by Portability Type, 2023 to 2033
Figure 99: South Asia Market Attractiveness by End use, 2023 to 2033
Figure 100: South Asia Market Attractiveness by Country, 2023 to 2033
Figure 101: East Asia Market Value (US$ Million) by Equipment Type, 2023 to 2033
Figure 102: East Asia Market Value (US$ Million) by Portability Type, 2023 to 2033
Figure 103: East Asia Market Value (US$ Million) by End use, 2023 to 2033
Figure 104: East Asia Market Value (US$ Million) by Country, 2023 to 2033
Figure 105: East Asia Market Value (US$ Million) Analysis by Country, 2018 to 2033
Figure 106: East Asia Market Value Share (%) and BPS Analysis by Country, 2023 to 2033
Figure 107: East Asia Market Y-o-Y Growth (%) Projections by Country, 2023 to 2033
Figure 108: East Asia Market Value (US$ Million) Analysis by Equipment Type, 2018 to 2033
Figure 109: East Asia Market Value Share (%) and BPS Analysis by Equipment Type, 2023 to 2033
Figure 110: East Asia Market Y-o-Y Growth (%) Projections by Equipment Type, 2023 to 2033
Figure 111: East Asia Market Value (US$ Million) Analysis by Portability Type, 2018 to 2033
Figure 112: East Asia Market Value Share (%) and BPS Analysis by Portability Type, 2023 to 2033
Figure 113: East Asia Market Y-o-Y Growth (%) Projections by Portability Type, 2023 to 2033
Figure 114: East Asia Market Value (US$ Million) Analysis by End use, 2018 to 2033
Figure 115: East Asia Market Value Share (%) and BPS Analysis by End use, 2023 to 2033
Figure 116: East Asia Market Y-o-Y Growth (%) Projections by End use, 2023 to 2033
Figure 117: East Asia Market Attractiveness by Equipment Type, 2023 to 2033
Figure 118: East Asia Market Attractiveness by Portability Type, 2023 to 2033
Figure 119: East Asia Market Attractiveness by End use, 2023 to 2033
Figure 120: East Asia Market Attractiveness by Country, 2023 to 2033
Figure 121: Oceania Market Value (US$ Million) by Equipment Type, 2023 to 2033
Figure 122: Oceania Market Value (US$ Million) by Portability Type, 2023 to 2033
Figure 123: Oceania Market Value (US$ Million) by End use, 2023 to 2033
Figure 124: Oceania Market Value (US$ Million) by Country, 2023 to 2033
Figure 125: Oceania Market Value (US$ Million) Analysis by Country, 2018 to 2033
Figure 126: Oceania Market Value Share (%) and BPS Analysis by Country, 2023 to 2033
Figure 127: Oceania Market Y-o-Y Growth (%) Projections by Country, 2023 to 2033
Figure 128: Oceania Market Value (US$ Million) Analysis by Equipment Type, 2018 to 2033
Figure 129: Oceania Market Value Share (%) and BPS Analysis by Equipment Type, 2023 to 2033
Figure 130: Oceania Market Y-o-Y Growth (%) Projections by Equipment Type, 2023 to 2033
Figure 131: Oceania Market Value (US$ Million) Analysis by Portability Type, 2018 to 2033
Figure 132: Oceania Market Value Share (%) and BPS Analysis by Portability Type, 2023 to 2033
Figure 133: Oceania Market Y-o-Y Growth (%) Projections by Portability Type, 2023 to 2033
Figure 134: Oceania Market Value (US$ Million) Analysis by End use, 2018 to 2033
Figure 135: Oceania Market Value Share (%) and BPS Analysis by End use, 2023 to 2033
Figure 136: Oceania Market Y-o-Y Growth (%) Projections by End use, 2023 to 2033
Figure 137: Oceania Market Attractiveness by Equipment Type, 2023 to 2033
Figure 138: Oceania Market Attractiveness by Portability Type, 2023 to 2033
Figure 139: Oceania Market Attractiveness by End use, 2023 to 2033
Figure 140: Oceania Market Attractiveness by Country, 2023 to 2033
Figure 141: MEA Market Value (US$ Million) by Equipment Type, 2023 to 2033
Figure 142: MEA Market Value (US$ Million) by Portability Type, 2023 to 2033
Figure 143: MEA Market Value (US$ Million) by End use, 2023 to 2033
Figure 144: MEA Market Value (US$ Million) by Country, 2023 to 2033
Figure 145: MEA Market Value (US$ Million) Analysis by Country, 2018 to 2033
Figure 146: MEA Market Value Share (%) and BPS Analysis by Country, 2023 to 2033
Figure 147: MEA Market Y-o-Y Growth (%) Projections by Country, 2023 to 2033
Figure 148: MEA Market Value (US$ Million) Analysis by Equipment Type, 2018 to 2033
Figure 149: MEA Market Value Share (%) and BPS Analysis by Equipment Type, 2023 to 2033
Figure 150: MEA Market Y-o-Y Growth (%) Projections by Equipment Type, 2023 to 2033
Figure 151: MEA Market Value (US$ Million) Analysis by Portability Type, 2018 to 2033
Figure 152: MEA Market Value Share (%) and BPS Analysis by Portability Type, 2023 to 2033
Figure 153: MEA Market Y-o-Y Growth (%) Projections by Portability Type, 2023 to 2033
Figure 154: MEA Market Value (US$ Million) Analysis by End use, 2018 to 2033
Figure 155: MEA Market Value Share (%) and BPS Analysis by End use, 2023 to 2033
Figure 156: MEA Market Y-o-Y Growth (%) Projections by End use, 2023 to 2033
Figure 157: MEA Market Attractiveness by Equipment Type, 2023 to 2033
Figure 158: MEA Market Attractiveness by Portability Type, 2023 to 2033
Figure 159: MEA Market Attractiveness by End use, 2023 to 2033
Figure 160: MEA Market Attractiveness by Country, 2023 to 2033


Full Research Suite comprises of:
Market outlook & trends analysis
Interviews & case studies
Strategic recommendations
Vendor profiles & capabilities analysis
5-year forecasts
8 regions and 60+ country-level data splits
Market segment data splits
12 months of continuous data updates
DELIVERED AS:
PDF EXCEL ONLINE
Fiber to the Home Market Size and Share Forecast Outlook 2025 to 2035
Fiber Based Packaging Market Size and Share Forecast Outlook 2025 to 2035
Fiber Lid Market Forecast and Outlook 2025 to 2035
Fiberglass Tanks Market Size and Share Forecast Outlook 2025 to 2035
Fiber Sorter Market Size and Share Forecast Outlook 2025 to 2035
Fiber Reinforced Polymer Panel and Sheet Market Size and Share Forecast Outlook 2025 to 2035
Fiber Laser Market Size and Share Forecast Outlook 2025 to 2035
Fiberglass Market Size and Share Forecast Outlook 2025 to 2035
Fiber Reinforced Plastic (FRP) Panels & Sheets Market Size and Share Forecast Outlook 2025 to 2035
Fiberglass Fabric Market Size and Share Forecast Outlook 2025 to 2035
Fiberglass Duct Wrap Insulation Market Size and Share Forecast Outlook 2025 to 2035
Fiber-Based Blister Pack Market Analysis - Size and Share Forecast Outlook 2025 to 2035
Fiber Laser Coding System Market Size and Share Forecast Outlook 2025 to 2035
Fiber Reinforced Polymer (FRP) Rebars Market Size and Share Forecast Outlook 2025 to 2035
Fiber Supplements Market Size and Share Forecast Outlook 2025 to 2035
Fiberglass Filters Market Size and Share Forecast Outlook 2025 to 2035
Fiberglass Light Poles Market Size and Share Forecast Outlook 2025 to 2035
Fiberboard Packaging Market Size and Share Forecast Outlook 2025 to 2035
Fiber Bottle Market Analysis-Size, Share, and Forecast Outlook 2025 to 2035
Fiber-reinforced Plastic (FRP) Recycling Market Growth- Trends and Forecast 2025-2035

Thank you!
You will receive an email from our Business Development Manager. Please be sure to check your SPAM/JUNK folder too.
Chat With
MaRIA