Fiberglass Light Poles Market Size and Share Forecast Outlook 2025 to 2035

The Fiberglass Light Poles Market is estimated to be valued at USD 468.0 million in 2025 and is projected to reach USD 692.8 million by 2035, registering a compound annual growth rate (CAGR) of 4.0% over the forecast period.
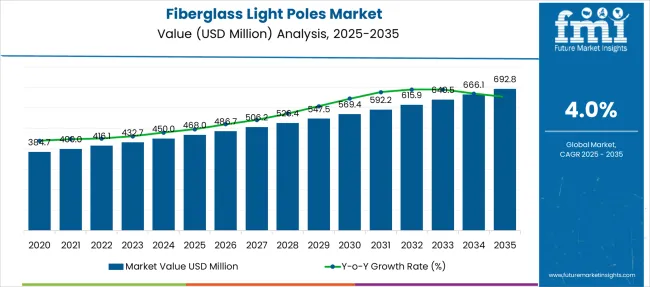
Quick Stats for Fiberglass Light Poles Market

  • Fiberglass Light Poles Market Value (2025): USD 468.0 million
  • Fiberglass Light Poles Market Forecast Value (2035): USD 692.8 million
  • Fiberglass Light Poles Market Forecast CAGR: 4.0%
  • Leading Segment in Fiberglass Light Poles Market in 2025: Round Tapered Fiberglass Pole (61.0%)
  • Key Growth Regions in Fiberglass Light Poles Market: North America, Asia-Pacific, Europe
  • Top Key Players in Fiberglass Light Poles Market: Valmont Industries, Inc., Aeron Composite Pvt Ltd., Alliance Composites, Inc., Creative Composite, Elsewedy Electric, Jindal Power Corporation, Lithonia Lighting (Acuity Brands), Main Street Lighting, Inc., NAFCO International, Inc., Nantong Wellgrid Composite Material Co., Ltd., PLP Composite Technologies, Inc., Shanghai Tung Hsing Composites Co., Ltd., Wood Preservers, Inc.

Fiberglass Light Poles Market Market Value Analysis

Fiberglass Light Poles Market Key Takeaways

Metric Value
Fiberglass Light Poles Market Estimated Value in (2025 E) USD 468.0 million
Fiberglass Light Poles Market Forecast Value in (2035 F) USD 692.8 million
Forecast CAGR (2025 to 2035) 4.0%

Why is the Fiberglass Light Poles Market Growing?

The fiberglass light poles market is witnessing steady expansion driven by increased adoption in urban infrastructure, commercial lighting, and smart city projects. Enhanced performance characteristics such as corrosion resistance, lightweight structure, and electrical non-conductivity have positioned fiberglass as a preferred alternative to traditional metal poles in moisture-prone and high-voltage environments.

With municipalities focusing on infrastructure modernization and long-term maintenance cost reduction, demand has been rising steadily across developed and developing regions. Manufacturers are investing in UV-resistant coatings, modular pole assemblies, and compatibility with IoT-enabled lighting systems, further expanding the product's applicability.

As sustainability standards tighten, fiberglass poles—offering recyclability and lower lifecycle emissions—are being integrated into energy-efficient lighting programs, making them a strategic component in future-ready urban infrastructure..

Segmental Analysis

The fiberglass light poles market is segmented by type, application type and geographic regions. The fiberglass light poles market is divided by type into Round Tapered Fiberglass Pole and Square Straight Fiberglass Pole. In terms of application, the fiberglass light poles market is classified into Commercial, Residential, and Government. Regionally, the fiberglass light poles industry is classified into North America, Latin America, Western Europe, Eastern Europe, Balkan & Baltic Countries, Russia & Belarus, Central Asia, East Asia, South Asia & Pacific, and the Middle East & Africa.
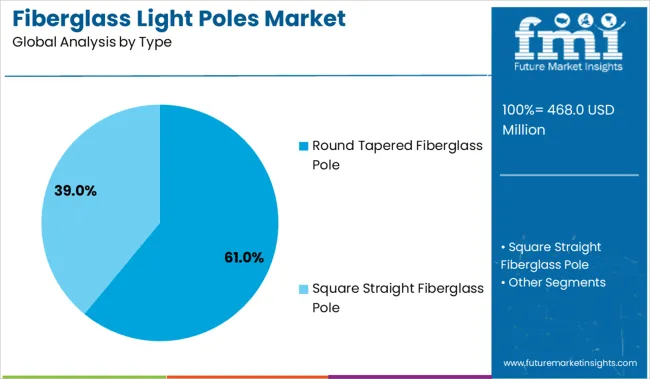
Insights into the Round Tapered Fiberglass Pole Type Segment

Fiberglass Light Poles Market Analysis By Type

Round tapered fiberglass poles are projected to hold 61.0% of the total market revenue in 2025, establishing them as the leading type segment. Their widespread acceptance is being driven by a blend of aesthetic appeal, structural efficiency, and adaptability to varying wind load conditions.

The tapered design enhances stability and wind resistance while minimizing material usage, making it suitable for both low- and high-mounting applications. This segment has benefited from widespread municipal deployment in roadways, pedestrian zones, and waterfronts due to ease of installation and lower long-term maintenance requirements.

Their non-conductive and corrosion-resistant features make them ideal for coastal and humid environments. As urban planning authorities continue to prioritize safety, cost-efficiency, and modern design integration, the round tapered variant remains the go-to solution in large-scale lighting installations..
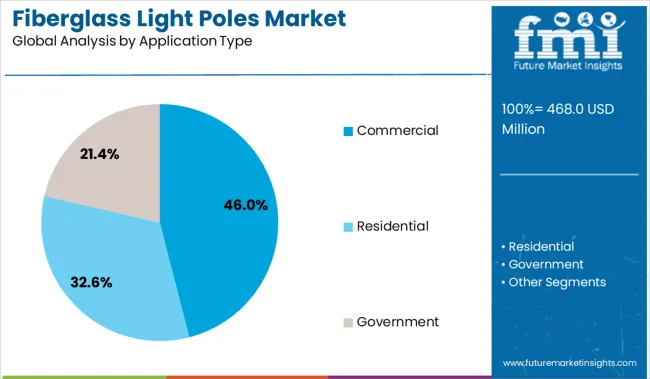
Insights into the Commercial Application Type Segment

Fiberglass Light Poles Market Analysis By Application Type

The commercial sector is anticipated to account for 46.0% of the fiberglass light poles market revenue by 2025, making it the leading application segment. This dominance is being reinforced by the growing use of fiberglass poles in business parks, retail complexes, parking facilities, and hospitality zones where durability and visual uniformity are critical.

The segment has seen a surge in deployment due to lightweight handling during installation, reduced need for grounding, and long-term savings on repainting and anti-corrosion treatments. As property developers and facility managers seek long-lasting lighting infrastructure with minimal upkeep, fiberglass poles have gained traction as a cost-effective and aesthetically versatile solution.

Furthermore, the demand for smart-ready poles in commercial campuses and outdoor advertising integration is expanding the functional value of fiberglass poles in this sector..

What are the Drivers, Restraints, and Key Trends of the Fiberglass Light Poles Market?

The fiberglass light poles market is gaining momentum due to rising demand for corrosion-resistant, lightweight alternatives to steel and concrete. Cost efficiency, grid upgrades, and aesthetic integration are further driving public and municipal adoption.

Preference Shift Towards Corrosion-Resistant, Lightweight Materials

The fiberglass light poles market has been observed to benefit from a growing shift toward materials with superior corrosion resistance and lower installation weight. Steel and aluminum alternatives have often been criticized for higher maintenance and degradation under moisture-prone or coastal conditions. Fiberglass poles have been increasingly adopted for their non-conductive, weather-resilient, and impact-resistant characteristics. Preference has been notably strong across infrastructure replacement programs, particularly in the North American and European utility sectors. Pole manufacturers are expected to gain market share through resin formulation customization, height configuration flexibility, and lifecycle optimization. Passive adoption has been seen in regions with retrofitting mandates and stringent public safety norms, where fiberglass poles are preferred over legacy concrete and wood structures.

Cost-Efficiency, Energy Grid Expansion, and Aesthetic Integration

Demand acceleration has been linked to energy distribution upgrades and urban lighting redesigns. Fiberglass poles have been increasingly valued for their low labor costs, easier on-site handling, and compatibility with LED smart lighting systems. Aesthetic integration into landscaping and architectural lighting plans has been prioritized in commercial and residential districts, where traditional poles fail to deliver visual uniformity. Several municipalities and contractors have leaned toward fiberglass designs to comply with new grid modernization standards and weather event resilience. The cost-to-performance ratio has been cited as favorable, especially when factoring in reduced corrosion treatments and extended service life. As government-funded grid enhancement projects are scaled, fiberglass poles are likely to witness increased bid preference and procurement in public tenders.
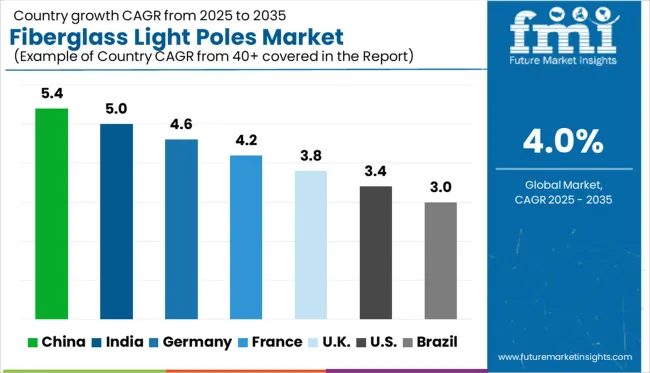
Analysis of Fiberglass Light Poles Market By Key Countries

Fiberglass Light Poles Market Cagr Analysis By Country

Country CAGR
China 5.4%
India 5.0%
Germany 4.6%
France 4.2%
UK 3.8%
USA 3.4%
Brazil 3.0%

The global fiberglass light poles market is growing at a CAGR of 4.0% from 2025 to 2035, yet several nations, particularly within BRICS and key OECD regions, are exceeding this pace. China leads with a CAGR of 5.4%, fueled by widespread urban infrastructure renewal, rising investment in smart cities, and domestic production scale-up of composite materials. India follows at 5.0%, driven by aggressive rural electrification programs, rapid highway expansion, and increasing ASEAN-linked smart infrastructure collaborations. Germany, a prominent OECD player, is growing at 4.6%, supported by mandates favoring lightweight and corrosion-resistant materials for public infrastructure and transport hubs. The UK and USA lag behind with 3.8% and 3.4% growth, respectively, constrained by legacy grid systems, slower public infrastructure budgets, and delayed procurement modernization. The disparity reflects stronger demand fundamentals and government-led project pipelines in BRICS and Asian markets. The report analyzes over 40 countries, with the top five highlighted above.
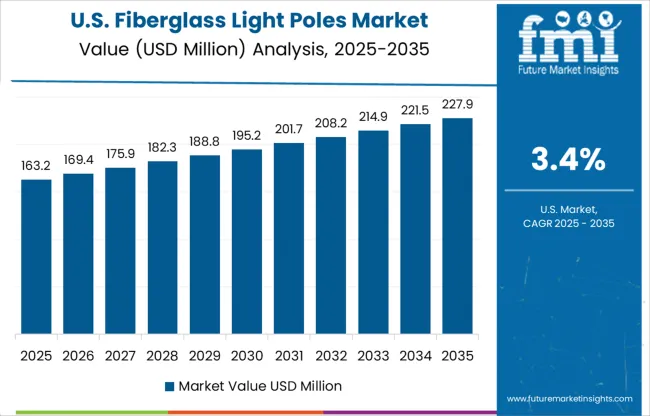
Demand Outlook for Fiberglass Light Poles Market in the United States

Fiberglass Light Poles Market Country Value Analysis

The CAGR of the fiberglass light poles market in the United States remained nearly 3.4% during 2020–2024, held back by long-standing procurement inertia among legacy infrastructure operators. However, for 2025–2035, the CAGR is estimated to rise to 4.6% as grid modernization and coastal infrastructure upgrades push fiberglass adoption forward. Cost pressures and rising climate risks have increased attention toward corrosion-free, durable pole materials in hurricane-prone states. Municipal procurement strategies are being revised to accommodate lifecycle cost analysis, where fiberglass emerges as a long-term winner over steel and concrete. Smart city programs are expected to further expand the fiberglass pole footprint through integrated lighting and communications hardware.

  • Smart grid projects accounted for over 38% of fiberglass pole orders in 2025.
  • FEMA-backed disaster recovery grants supported retrofitting in 11 states.
  • Utility-led installations using composite materials expanded 2.3× from 2026–2030.

Sales Analysis of Fiberglass Light Poles Market in the United Kingdom

The CAGR in the United Kingdom improved from 3.6% during 2020–2024 to 4.0% in the 2025–2035 forecast window, influenced by regulatory pressure on carbon-neutral public infrastructure. Local councils began favoring fiberglass over aluminum for pedestrian zones, coastal promenades, and energy-efficient public spaces. The market saw heightened interest in smart poles, particularly for integrating surveillance, EV charging, and 5G modules. Historically slow due to high upfront cost concerns, adoption accelerated post-2024 as import logistics stabilized and domestic resin processing capabilities scaled up. Retrofitting mandates and ecological preservation plans contributed to a more structured rollout of fiberglass poles across England and Wales.

  • Local authority tenders specifying fiberglass tripled from 2025 to 2028.
  • Passive adoption was strongest in coastal counties such as Cornwall and Norfolk.
  • Smart pole variants captured over 22.8% of the UK’s fiberglass segment by 2029

In-Depth Analysis of Fiberglass Light Poles Market in India

The CAGR in India increased from 5.0% during 2020–2024 to 6.3% across 2025–2035, fueled by street lighting upgrades in urban clusters and smart village schemes. Fiberglass poles gained acceptance due to their lower weight, easy installation, and compatibility with solar lighting modules. Programs such as UJALA and Smart Cities Mission promoted composite-based lighting as part of energy conservation drives. Tier 2 and Tier 3 cities started adopting fiberglass solutions due to the limited availability of crane infrastructure required for heavier pole types. Investments by domestic fiberglass firms and JV agreements for composite pole production have made India a rapidly expanding market.
  • Over 80 municipal corporations adopted fiberglass pole tenders between 2025–2028.
  • State-level electrification programs added over 1.1 million poles using fiberglass.
  • Rooftop solar-linked lighting deployments in rural India preferred fiberglass due to transport ease.

Opportunity Analysis of Fiberglass Light Poles Market in Germany

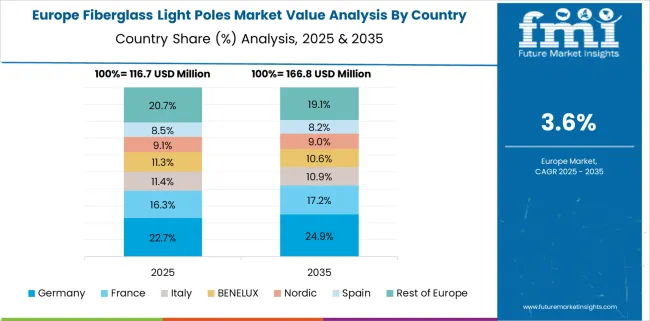
Fiberglass Light Poles Market Europe Country Market Share Analysis, 2025 & 2035

The CAGR in Germany moved from 4.6% in 2020–2024 to an estimated 5.3% during 2025–2035, driven by the federal push for durable, low-maintenance street lighting structures. Municipalities facing rising repair costs associated with rusting steel poles began transitioning to fiberglass alternatives, especially in high-rainfall zones. Sustainability-linked bond programs influenced procurement decisions at the city level, where lifecycle emissions and disposal costs became key factors. German engineering firms expanded partnerships with composite technology players to design impact-resistant poles suitable for autobahns and industrial estates. Competitive pricing and lifecycle savings have repositioned fiberglass from niche to mainstream in the public lighting space.

  • Berlin, Hamburg, and Munich collectively drove 41% of Germany’s fiberglass pole demand in 2025.
  • Tender announcements specified corrosion-proof materials in over 70 districts.
  • Smart lighting pole deployments using fiberglass grew by 3.8× between 2026–2030.

Demand Analysis for Fiberglass Light Poles Market in China

The CAGR in China stood at 5.4% between 2020 and 2024 and is projected to reach 6.8% from 2025 to 2035, enabled by large-scale infrastructure development and decarbonization targets. Government-led initiatives across smart cities, new townships, and expressway corridors have promoted the shift from galvanized steel to fiberglass light poles. Procurement volumes surged through 2023–2025, with urban municipal contracts preferring composite materials for their strength-to-weight benefits. Integration of 5G nodes and real-time environmental sensors in pole systems has become a standard across Tier 1 cities. Domestic manufacturers have scaled production capacity, making China a volume leader in fiberglass pole manufacturing.
  • Over 60% of smart pole installations in Beijing and Shenzhen utilized fiberglass in 2025.
  • Local sourcing policies favored provincial vendors in Jiangsu and Zhejiang.
  • Export volumes of fiberglass poles from China grew at a 12.1% CAGR post-2026.

Competitive Landscape of Fiberglass Light Poles Market

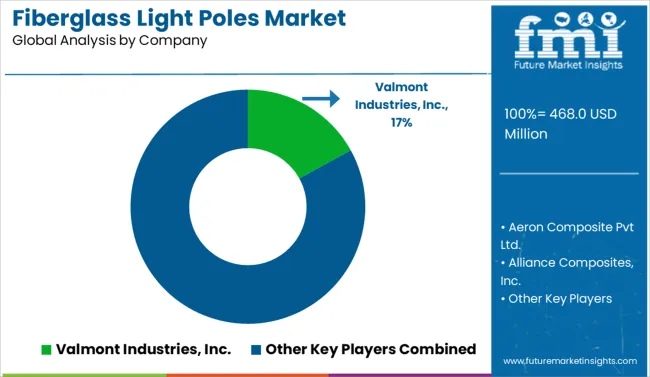
Fiberglass Light Poles Market Analysis By Company

The fiberglass light poles market is driven by a mix of established manufacturers and regional specialists focused on durability, corrosion resistance, and smart lighting compatibility. Key players like Valmont Industries, Inc., Lithonia Lighting (Acuity Brands), and Elsewedy Electric are scaling innovation through advanced composite materials and pole-integrated controls for urban, highway, and utility lighting projects. These companies emphasize longer service life and lower maintenance, addressing growing municipal mandates. Regionally strong firms such as Aeron Composite Pvt Ltd., Nantong Wellgrid Composite Material, and PLP Composite Technologies, Inc., cater to BRICS and ASEAN infrastructure developments with lightweight, easy-to-install poles suitable for extreme environments. Creative Composite, Wood Preservers, and Jindal Power Corporation are also expanding their share in smart city and rural electrification projects. This global competition is fostering pricing optimization, material diversification, and region-specific pole designs for accelerating grid modernization.

Key Developments in Fiberglass Light Poles Market

In July 2024, Valmont announced a partnership with renewable energy developers to supply composite utility and light poles for wind and solar projects, signaling a strategic alignment with green infrastructure.

Scope of the Report

Item Value
Quantitative Units USD 468.0 Million
Type Round Tapered Fiberglass Pole and Square Straight Fiberglass Pole
Application Type Commercial, Residential, and Government
Regions Covered North America, Europe, Asia-Pacific, Latin America, Middle East & Africa
Country Covered United States, Canada, Germany, France, United Kingdom, China, Japan, India, Brazil, South Africa
Key Companies Profiled Valmont Industries, Inc., Aeron Composite Pvt Ltd., Alliance Composites, Inc., Creative Composite, Elsewedy Electric, Jindal Power Corporation, Lithonia Lighting (Acuity Brands), Main Street Lighting, Inc., NAFCO International, Inc., Nantong Wellgrid Composite Material Co., Ltd., PLP Composite Technologies, Inc., Shanghai Tung Hsing Composites Co., Ltd., and Wood Preservers, Inc.
Additional Attributes Dollar sales, regional share, government procurement trends, smart city adoption rates, utility retrofitting demand, key competitors, and growth in coastal infrastructure zones.

Fiberglass Light Poles Market by Segments

Type:

  • Round Tapered Fiberglass Pole
  • Square Straight Fiberglass Pole

Application Type:

  • Commercial
  • Residential
  • Government

Region:

  • North America
    • USA/li>
    • Canada
    • Mexico
  • Latin America
    • Brazil
    • Chile
    • Rest of Latin America
  • Western Europe
    • Germany
    • UK
    • Italy
    • Spain
    • France
    • Nordic
    • BENELUX
    • Rest of Western Europe
  • Eastern Europe
    • Russia
    • Poland
    • Hungary
    • Balkan & Baltic
    • Rest of Eastern Europe
  • East Asia
    • China
    • Japan
    • South Korea
  • South Asia and Pacific
    • India
    • ASEAN
    • Australia & New Zealand
    • Rest of South Asia and Pacific
  • Middle East & Africa
    • Kingdom of Saudi Arabia
    • Other GCC Countries
    • Turkiye
    • South Africa
    • Other African Union
    • Rest of Middle East & Africa

Table of Content

  1. Executive Summary
    • Global Market Outlook
    • Demand-side Trends
    • Supply-side Trends
    • Technology Roadmap Analysis
    • Analysis and Recommendations
  2. Market Overview
    • Market Coverage / Taxonomy
    • Market Definition / Scope / Limitations
  3. Market Background
    • Market Dynamics
      • Drivers
      • Restraints
      • Opportunity
      • Trends
    • Scenario Forecast
      • Demand in Optimistic Scenario
      • Demand in Likely Scenario
      • Demand in Conservative Scenario
    • Opportunity Map Analysis
    • Product Life Cycle Analysis
    • Supply Chain Analysis
    • Investment Feasibility Matrix
    • Value Chain Analysis
    • PESTLE and Porter’s Analysis
    • Regulatory Landscape
    • Regional Parent Market Outlook
    • Production and Consumption Statistics
    • Import and Export Statistics
  4. Global Residential Heating Equipment Market Analysis 2020-2024 and Forecast, 2025-2035
    • Historical Market Size Value (US$ Mn) Analysis, 2020-2024
    • Current and Future Market Size Value (US$ Mn) Projections, 2025-2035
      • Y-o-Y Growth Trend Analysis
      • Absolute $ Opportunity Analysis
  5. Global Residential Heating Equipment Market Pricing Analysis 2020-2024 and Forecast 2025-2035
  6. Global Residential Heating Equipment Market Analysis 2020-2024 and Forecast 2025-2035, By Technology Type
    • Introduction / Key Findings
    • Historical Market Size Value (US$ Mn) Analysis By Technology Type , 2020-2024
    • Current and Future Market Size Value (US$ Mn) Analysis and Forecast By Technology Type , 2025-2035
      • Heat pump
      • Boiler
      • Furnace
      • Water heater
      • Others
    • Y-o-Y Growth Trend Analysis By Technology Type , 2020-2024
    • Absolute $ Opportunity Analysis By Technology Type , 2025-2035
  7. Global Residential Heating Equipment Market Analysis 2020-2024 and Forecast 2025-2035, By Application Type
    • Introduction / Key Findings
    • Historical Market Size Value (US$ Mn) Analysis By Application Type, 2020-2024
    • Current and Future Market Size Value (US$ Mn) Analysis and Forecast By Application Type, 2025-2035
      • Single-family
      • Multi-family
    • Y-o-Y Growth Trend Analysis By Application Type, 2020-2024
    • Absolute $ Opportunity Analysis By Application Type, 2025-2035
  8. Global Residential Heating Equipment Market Analysis 2020-2024 and Forecast 2025-2035, By Sales Channel
    • Introduction / Key Findings
    • Historical Market Size Value (US$ Mn) Analysis By Sales Channel, 2020-2024
    • Current and Future Market Size Value (US$ Mn) Analysis and Forecast By Sales Channel, 2025-2035
      • Dealer
      • Online
      • Retail
    • Y-o-Y Growth Trend Analysis By Sales Channel, 2020-2024
    • Absolute $ Opportunity Analysis By Sales Channel, 2025-2035
  9. Global Residential Heating Equipment Market Analysis 2020-2024 and Forecast 2025-2035, By Region
    • Introduction
    • Historical Market Size Value (US$ Mn) Analysis By Region, 2020-2024
    • Current Market Size Value (US$ Mn) Analysis and Forecast By Region, 2025-2035
      • North America
      • Latin America
      • Western Europe
      • Eastern Europe
      • East Asia
      • South Asia and Pacific
      • Middle East & Africa
    • Market Attractiveness Analysis By Region
  10. North America Residential Heating Equipment Market Analysis 2020-2024 and Forecast 2025-2035, By Country
    • Historical Market Size Value (US$ Mn) Trend Analysis By Market Taxonomy, 2020-2024
    • Market Size Value (US$ Mn) Forecast By Market Taxonomy, 2025-2035
      • By Country
        • USA
        • Canada
        • Mexico
      • By Technology Type
      • By Application Type
      • By Sales Channel
    • Market Attractiveness Analysis
      • By Country
      • By Technology Type
      • By Application Type
      • By Sales Channel
    • Key Takeaways
  11. Latin America Residential Heating Equipment Market Analysis 2020-2024 and Forecast 2025-2035, By Country
    • Historical Market Size Value (US$ Mn) Trend Analysis By Market Taxonomy, 2020-2024
    • Market Size Value (US$ Mn) Forecast By Market Taxonomy, 2025-2035
      • By Country
        • Brazil
        • Chile
        • Rest of Latin America
      • By Technology Type
      • By Application Type
      • By Sales Channel
    • Market Attractiveness Analysis
      • By Country
      • By Technology Type
      • By Application Type
      • By Sales Channel
    • Key Takeaways
  12. Western Europe Residential Heating Equipment Market Analysis 2020-2024 and Forecast 2025-2035, By Country
    • Historical Market Size Value (US$ Mn) Trend Analysis By Market Taxonomy, 2020-2024
    • Market Size Value (US$ Mn) Forecast By Market Taxonomy, 2025-2035
      • By Country
        • Germany
        • UK
        • Italy
        • Spain
        • France
        • Nordic
        • BENELUX
        • Rest of Western Europe
      • By Technology Type
      • By Application Type
      • By Sales Channel
    • Market Attractiveness Analysis
      • By Country
      • By Technology Type
      • By Application Type
      • By Sales Channel
    • Key Takeaways
  13. Eastern Europe Residential Heating Equipment Market Analysis 2020-2024 and Forecast 2025-2035, By Country
    • Historical Market Size Value (US$ Mn) Trend Analysis By Market Taxonomy, 2020-2024
    • Market Size Value (US$ Mn) Forecast By Market Taxonomy, 2025-2035
      • By Country
        • Russia
        • Poland
        • Hungary
        • Balkan & Baltic
        • Rest of Eastern Europe
      • By Technology Type
      • By Application Type
      • By Sales Channel
    • Market Attractiveness Analysis
      • By Country
      • By Technology Type
      • By Application Type
      • By Sales Channel
    • Key Takeaways
  14. East Asia Residential Heating Equipment Market Analysis 2020-2024 and Forecast 2025-2035, By Country
    • Historical Market Size Value (US$ Mn) Trend Analysis By Market Taxonomy, 2020-2024
    • Market Size Value (US$ Mn) Forecast By Market Taxonomy, 2025-2035
      • By Country
        • China
        • Japan
        • South Korea
      • By Technology Type
      • By Application Type
      • By Sales Channel
    • Market Attractiveness Analysis
      • By Country
      • By Technology Type
      • By Application Type
      • By Sales Channel
    • Key Takeaways
  15. South Asia and Pacific Residential Heating Equipment Market Analysis 2020-2024 and Forecast 2025-2035, By Country
    • Historical Market Size Value (US$ Mn) Trend Analysis By Market Taxonomy, 2020-2024
    • Market Size Value (US$ Mn) Forecast By Market Taxonomy, 2025-2035
      • By Country
        • India
        • ASEAN
        • Australia & New Zealand
        • Rest of South Asia and Pacific
      • By Technology Type
      • By Application Type
      • By Sales Channel
    • Market Attractiveness Analysis
      • By Country
      • By Technology Type
      • By Application Type
      • By Sales Channel
    • Key Takeaways
  16. Middle East & Africa Residential Heating Equipment Market Analysis 2020-2024 and Forecast 2025-2035, By Country
    • Historical Market Size Value (US$ Mn) Trend Analysis By Market Taxonomy, 2020-2024
    • Market Size Value (US$ Mn) Forecast By Market Taxonomy, 2025-2035
      • By Country
        • Kingdom of Saudi Arabia
        • Other GCC Countries
        • Turkiye
        • South Africa
        • Other African Union
        • Rest of Middle East & Africa
      • By Technology Type
      • By Application Type
      • By Sales Channel
    • Market Attractiveness Analysis
      • By Country
      • By Technology Type
      • By Application Type
      • By Sales Channel
    • Key Takeaways
  17. Key Countries Residential Heating Equipment Market Analysis
    • USA
      • Pricing Analysis
      • Market Share Analysis, 2024
        • By Technology Type
        • By Application Type
        • By Sales Channel
    • Canada
      • Pricing Analysis
      • Market Share Analysis, 2024
        • By Technology Type
        • By Application Type
        • By Sales Channel
    • Mexico
      • Pricing Analysis
      • Market Share Analysis, 2024
        • By Technology Type
        • By Application Type
        • By Sales Channel
    • Brazil
      • Pricing Analysis
      • Market Share Analysis, 2024
        • By Technology Type
        • By Application Type
        • By Sales Channel
    • Chile
      • Pricing Analysis
      • Market Share Analysis, 2024
        • By Technology Type
        • By Application Type
        • By Sales Channel
    • Germany
      • Pricing Analysis
      • Market Share Analysis, 2024
        • By Technology Type
        • By Application Type
        • By Sales Channel
    • UK
      • Pricing Analysis
      • Market Share Analysis, 2024
        • By Technology Type
        • By Application Type
        • By Sales Channel
    • Italy
      • Pricing Analysis
      • Market Share Analysis, 2024
        • By Technology Type
        • By Application Type
        • By Sales Channel
    • Spain
      • Pricing Analysis
      • Market Share Analysis, 2024
        • By Technology Type
        • By Application Type
        • By Sales Channel
    • France
      • Pricing Analysis
      • Market Share Analysis, 2024
        • By Technology Type
        • By Application Type
        • By Sales Channel
    • India
      • Pricing Analysis
      • Market Share Analysis, 2024
        • By Technology Type
        • By Application Type
        • By Sales Channel
    • ASEAN
      • Pricing Analysis
      • Market Share Analysis, 2024
        • By Technology Type
        • By Application Type
        • By Sales Channel
    • Australia & New Zealand
      • Pricing Analysis
      • Market Share Analysis, 2024
        • By Technology Type
        • By Application Type
        • By Sales Channel
    • China
      • Pricing Analysis
      • Market Share Analysis, 2024
        • By Technology Type
        • By Application Type
        • By Sales Channel
    • Japan
      • Pricing Analysis
      • Market Share Analysis, 2024
        • By Technology Type
        • By Application Type
        • By Sales Channel
    • South Korea
      • Pricing Analysis
      • Market Share Analysis, 2024
        • By Technology Type
        • By Application Type
        • By Sales Channel
    • Russia
      • Pricing Analysis
      • Market Share Analysis, 2024
        • By Technology Type
        • By Application Type
        • By Sales Channel
    • Poland
      • Pricing Analysis
      • Market Share Analysis, 2024
        • By Technology Type
        • By Application Type
        • By Sales Channel
    • Hungary
      • Pricing Analysis
      • Market Share Analysis, 2024
        • By Technology Type
        • By Application Type
        • By Sales Channel
    • Kingdom of Saudi Arabia
      • Pricing Analysis
      • Market Share Analysis, 2024
        • By Technology Type
        • By Application Type
        • By Sales Channel
    • Turkiye
      • Pricing Analysis
      • Market Share Analysis, 2024
        • By Technology Type
        • By Application Type
        • By Sales Channel
    • South Africa
      • Pricing Analysis
      • Market Share Analysis, 2024
        • By Technology Type
        • By Application Type
        • By Sales Channel
  18. Market Structure Analysis
    • Competition Dashboard
    • Competition Benchmarking
    • Market Share Analysis of Top Players
      • By Regional
      • By Technology Type
      • By Application Type
      • By Sales Channel
  19. Competition Analysis
    • Competition Deep Dive
      • Rheem Manufacturing Company
        • Overview
        • Product Portfolio
        • Profitability by Market Segments (Product/Age /Sales Channel/Region)
        • Sales Footprint
        • Strategy Overview
          • Marketing Strategy
          • Product Strategy
          • Channel Strategy
      • A.O. Smith
      • Ariston Holding
      • Arovast Corporation
      • BDR Thermea Group
      • Bradford White Corporation
      • Carrier Corporation
      • Crane
      • DAIKIN INDUSTRIES
      • Ferroli
      • GE Appliances
      • Havells India
      • Hoval
      • Johnson Control International
      • Lennox International
      • LG Electronics
      • Panasonic Corporation
      • Rinnai America
      • Robert Bosch
      • SAMSUNG
  20. Assumptions & Acronyms Used
  21. Research Methodology

List of Tables

  • Table 1: Global Residential Heating Equipment Market Value (US$ Mn) Forecast by Region, 2020-2035
  • Table 2: North America Residential Heating Equipment Market Value (US$ Mn) Forecast by Country, 2020-2035
  • Table 3: Latin America Residential Heating Equipment Market Value (US$ Mn) Forecast by Country, 2020-2035
  • Table 4: Western Europe Residential Heating Equipment Market Value (US$ Mn) Forecast by Country, 2020-2035
  • Table 5: Eastern Europe Residential Heating Equipment Market Value (US$ Mn) Forecast by Country, 2020-2035
  • Table 6: East Asia Residential Heating Equipment Market Value (US$ Mn) Forecast by Country, 2020-2035
  • Table 7: South Asia and Pacific Residential Heating Equipment Market Value (US$ Mn) Forecast by Country, 2020-2035
  • Table 8: Middle East & Africa Residential Heating Equipment Market Value (US$ Mn) Forecast by Country, 2020-2035

List of Figures

  • Figure 1: Global Residential Heating Equipment Market Pricing Analysis
  • Figure 2: Global Residential Heating Equipment Market Value (US$ Mn) Forecast 2020–2035
  • Figure 3: Global Residential Heating Equipment Market Value (US$ Mn) Share and BPS Analysis by Region, 2025 and 2035
  • Figure 4: Global Residential Heating Equipment Market Y-o-Y Growth Comparison by Region, 2025–2035
  • Figure 5: Global Residential Heating Equipment Market Attractiveness Analysis by Region
  • Figure 6: North America Residential Heating Equipment Market Incremental $ Opportunity, 2025–2035
  • Figure 7: Latin America Residential Heating Equipment Market Incremental $ Opportunity, 2025–2035
  • Figure 8: Western Europe Residential Heating Equipment Market Incremental $ Opportunity, 2025–2035
  • Figure 9: Eastern Europe Residential Heating Equipment Market Incremental $ Opportunity, 2025–2035
  • Figure 10: East Asia Residential Heating Equipment Market Incremental $ Opportunity, 2025–2035
  • Figure 11: South Asia and Pacific Residential Heating Equipment Market Incremental $ Opportunity, 2025–2035
  • Figure 12: Middle East & Africa Residential Heating Equipment Market Incremental $ Opportunity, 2025–2035
  • Figure 13: North America Residential Heating Equipment Market Value Share and BPS Analysis by Country, 2025 and 2035
  • Figure 14: Latin America Residential Heating Equipment Market Value Share and BPS Analysis by Country, 2025 and 2035
  • Figure 15: Western Europe Residential Heating Equipment Market Value Share and BPS Analysis by Country, 2025 and 2035
  • Figure 16: Eastern Europe Residential Heating Equipment Market Value Share and BPS Analysis by Country, 2025 and 2035
  • Figure 17: East Asia Residential Heating Equipment Market Value Share and BPS Analysis by Country, 2025 and 2035
  • Figure 18: South Asia and Pacific Residential Heating Equipment Market Value Share and BPS Analysis by Country, 2025 and 2035
  • Figure 19: Middle East & Africa Residential Heating Equipment Market Value Share and BPS Analysis by Country, 2025 and 2035
  • Figure 20: Global Residential Heating Equipment Market – Tier Structure Analysis
  • Figure 21: Global Residential Heating Equipment Market – Company Share Analysis

Frequently Asked Questions

How big is the fiberglass light poles market in 2025?

The global fiberglass light poles market is estimated to be valued at USD 468.0 million in 2025.

What will be the size of fiberglass light poles market in 2035?

The market size for the fiberglass light poles market is projected to reach USD 692.8 million by 2035.

How much will be the fiberglass light poles market growth between 2025 and 2035?

The fiberglass light poles market is expected to grow at a 4.0% CAGR between 2025 and 2035.

What are the key product types in the fiberglass light poles market?

The key product types in fiberglass light poles market are round tapered fiberglass pole and square straight fiberglass pole.

Which application type segment to contribute significant share in the fiberglass light poles market in 2025?

In terms of application type, commercial segment to command 46.0% share in the fiberglass light poles market in 2025.

Explore Similar Insights

Future Market Insights

Fiberglass Light Poles Market