The global fiberglass market is projected to reach USD 19.9 billion by 2035, recording an absolute increase of USD 8.0 billion over the forecast period. The market is valued at USD 11.9 billion in 2025 and is set to rise at a CAGR of 5.3% during the assessment period. The overall market size is expected to grow by nearly 1.7 times during the same period, supported by increasing demand for lightweight composite materials worldwide, driving demand for efficient glass fiber reinforcement systems and increasing investments in renewable energy, construction infrastructure, and automotive manufacturing projects globally. Raw material price volatility and environmental concerns regarding glass fiber production may pose challenges to market expansion.
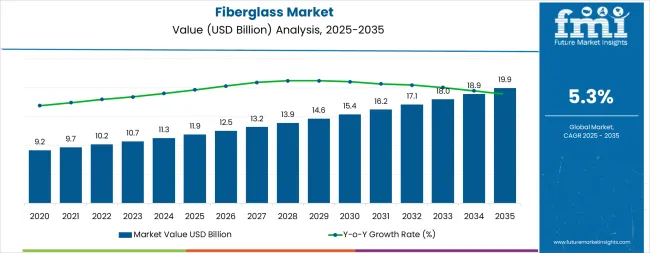
Between 2025 and 2030, the market is projected to expand from USD 11.9 billion to USD 15.4 billion, resulting in a value increase of USD 3.5 billion, which represents 43.8% of the total forecast growth for the decade. This phase of development will be shaped by rising demand for renewable energy and construction applications, product innovation in composite technologies and lightweight material systems, as well as expanding integration with green building initiatives and automotive electrification programs. Companies are establishing competitive positions through investment in advanced glass fiber formulations, green production solutions, and strategic market expansion across construction, automotive, and wind energy applications.
From 2030 to 2035, the market is forecast to grow from USD 15.4 billion to USD 19.9 billion, adding another USD 4.5 billion, which constitutes 56.2% of the overall ten-year expansion. This period is expected to be characterized by the expansion of specialized glass fiber systems, including advanced E-Glass formulations and integrated composite solutions tailored for specific industry requirements, strategic collaborations between fiberglass manufacturers and end-user industries, and an enhanced focus on production efficiency and environmental sustainability. The growing focus on lightweight materials and circular economy initiatives will drive demand for advanced, high-performance fiberglass solutions across diverse industrial applications.
| Metric | Value |
|---|---|
| Market Value (2025) | USD 11.9 billion |
| Market Forecast Value (2035) | USD 19.9 billion |
| Forecast CAGR (2025-2035) | 5.3% |
The fiberglass market grows by enabling manufacturers to achieve superior strength-to-weight ratios and exceptional durability in various applications, ranging from construction insulation to wind turbine blades. Industrial manufacturers face mounting pressure to reduce weight and improve energy efficiency, with fiberglass composite solutions typically providing 30-50% weight reduction compared to traditional materials like steel and concrete, making glass fiber essential for competitive manufacturing operations. The construction industry's need for energy-efficient insulation materials creates demand for advanced fiberglass solutions that can minimize heat transfer, enhance building performance, and ensure consistent thermal resistance across diverse climatic conditions.
Government initiatives promoting renewable energy adoption and ecofriendly construction standards drive adoption in wind energy, construction insulation, and automotive light weighting applications, where material performance has a direct impact on energy efficiency and operational costs. The automotive sector's transition toward electric vehicles accelerate demand for lightweight composite materials that extend battery range and improve vehicle performance. Fluctuating raw material prices for silica sand and energy-intensive manufacturing processes may limit adoption rates among cost-sensitive manufacturers and developing regions with limited access to advanced production technologies.
The market is segmented by product type, application, glass type, and region. By product type, the market is divided into rovings, mats, fabrics, and strands & yarn. Based on application, the market is categorized into construction, automotive, wind energy, pipes & tanks, marine, aerospace & defence, sports & leisure, and other applications. By glass type, the market is segmented into E-Glass, ECR-Glass, S-Glass, C-Glass, and other glass types. Regionally, the market is divided into Asia Pacific, Europe, North America, Latin America, and Middle East & Africa.
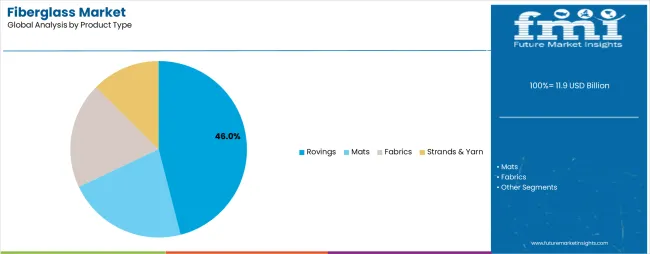
The rovings segment represents the dominant force in the market, capturing approximately 46.0% of total market share in 2025. This advanced product category encompasses formulations featuring continuous glass fiber strands bundled together, including direct rovings (27.0% share) and assembled rovings (19.0% share) that enable superior mechanical properties and processing efficiency characteristics. The rovings segment's market leadership stems from its exceptional versatility and cost-effectiveness, with products suitable for pultrusion, filament winding, and spray-up applications while maintaining consistent fiber integrity and mechanical performance across diverse manufacturing processes.
The mats segment maintains a substantial 22.0% market share, serving manufacturers who require random fiber orientation for molding applications. Fabrics hold an 18.0% share through woven and non-woven textile applications, while strands & yarn account for 14.0% market share in specialty applications.
Key technological advantages driving the rovings segment include:
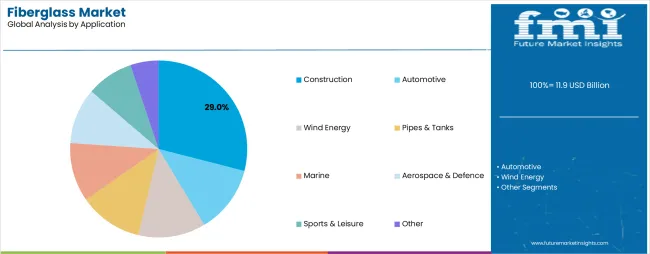
Construction applications dominate the market with approximately 29.0% market share in 2025, reflecting the critical role of glass fiber materials in building insulation, roofing systems, and structural reinforcement supporting global infrastructure development initiatives. The construction segment's market leadership is reinforced by accelerating urbanization, government green building policies, and rising demand for energy-efficient building solutions that directly correlate with thermal insulation performance quality. Within construction, insulation accounts for 12.0% of total market share, roofing & panels represent 9.0%, and rebar & structural applications capture 8.0%.
The automotive segment represents the second-largest application category, capturing 21.0% market share through lightweight composite requirements for vehicle body panels, interior components, and structural elements. This segment benefits from growing demand for weight reduction solutions that improve fuel efficiency and extend electric vehicle battery range in increasingly stringent emissions environments.
The wind energy segment accounts for 17.0% market share, serving turbine blade manufacturers requiring high-strength, lightweight composite materials. Pipes & tanks applications capture 9.0% market share through corrosion-resistant infrastructure solutions, marine represents 8.0%, aerospace & defence accounts for 7.0%, sports & leisure holds 5.0%, while other applications represent 4.0% of the market.
Key market dynamics supporting application growth include:
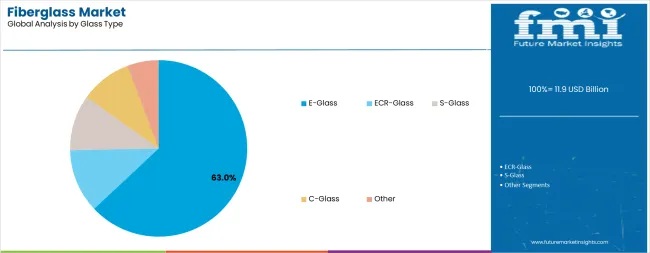
E-Glass dominates the market with approximately 63.0% market share in 2025, reflecting its widespread adoption as the standard reinforcement material across diverse applications due to its balanced properties and cost-effectiveness. The E-Glass segment's market leadership is supported by its excellent mechanical properties, good electrical insulation characteristics, and broad applicability across construction, automotive, and wind energy sectors. Within E-Glass, woven fabrics account for 23.0% of total market share, direct-roving forms represent 22.0%, and chopped strands capture 18.0%.
ECR-Glass represents the second-largest glass type category, capturing 14.0% market share through enhanced corrosion resistance for chemical processing and marine applications. S-Glass accounts for 9.0% market share, serving high-performance aerospace and defense requirements where superior strength properties justify premium pricing. C-Glass holds 8.0% market share in acid-resistant applications, while other glass types represent 6.0% of the market.
Key factors driving E-Glass segment dominance include:
The market is driven by three concrete demand factors tied to performance optimization outcomes. First, renewable energy sector growth and wind turbine capacity expansion create increasing demand for high-performance glass fiber solutions, with global wind energy installations projected to grow by 12-15% annually in major markets worldwide, requiring specialized composite materials for increasingly larger turbine blade designs. Second, construction industry transformation toward energy-efficient buildings drives adoption of superior insulation materials, with manufacturers seeking thermal resistance improvements and fire safety compliance that fiberglass products uniquely provide. Third, automotive industry electrification accelerates lightweight material adoption, as electric vehicle manufacturers require 15-20% vehicle weight reduction to maximize battery range and improve vehicle efficiency, making glass fiber composites essential for competitive product development.
Market restraints include raw material price volatility that can impact production costs and profitability margins, particularly during periods of supply chain disruption or energy price fluctuations affecting silica sand processing and glass melting operations. Environmental concerns regarding glass fiber production energy intensity pose another significant challenge, as manufacturing processes require substantial thermal energy inputs and generate emissions, potentially causing regulatory pressure and increased compliance costs. Technical limitations in recycling and end-of-life disposal create additional complexity for manufacturers, as composite materials reinforced with glass fibers present challenges for circular economy initiatives and waste management systems.
Key trends indicate accelerated adoption in Asia-Pacific markets, particularly India and China, where rapid infrastructure development and renewable energy deployment drive comprehensive fiberglass system integration across construction and manufacturing sectors. Technology advancement trends toward bio-based resin compatibility and recyclable composite development enable next-generation product offerings that address environmental sustainability concerns while maintaining mechanical performance requirements. Market dynamics favor manufacturers that invest in lower-embodied-carbon glass fiber production, capacity optimization for regional demand centers, and strategic partnerships with end-user industries seeking comprehensive composite solutions. The market thesis could face disruption if alternative reinforcement technologies such as carbon fiber achieve significant cost reductions or if circular composite recycling breakthroughs alter material selection preferences across key application segments.
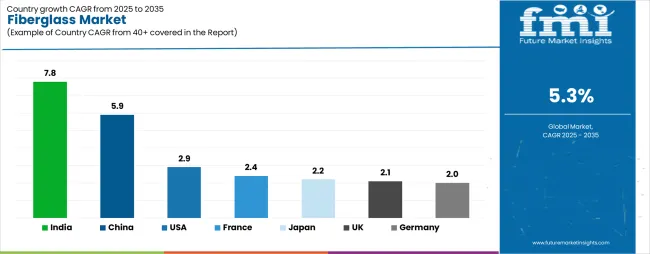
| Country | CAGR (2025-2035) |
|---|---|
| India | 7.8% |
| China | 5.9% |
| USA | 2.9% |
| France | 2.4% |
| Japan | 2.2% |
| UK | 2.1% |
| Germany | 2.0% |
The global market is projected to grow steadily between 2025 and 2035, driven by rising demand in construction, automotive, aerospace, and renewable energy sectors. India leads with a CAGR of 7.8%, supported by rapid infrastructure development, expanding automotive manufacturing, and growing demand for lightweight composite materials. China follows at 5.9%, driven by steady industrial growth, increasing renewable energy projects, and expansion in construction activities. The United States records a 2.9% CAGR, reflecting stable demand for fiberglass in insulation, aerospace, and automotive applications. France grows at 2.4%, supported by steady adoption in building and industrial sectors. Japan and the United Kingdom record growth rates of 2.2% and 2.1% respectively, driven by consistent demand in industrial manufacturing and transportation. Germany shows the lowest growth at 2.0%, reflecting a mature market with moderate expansion opportunities.
The report covers an in-depth analysis of 40+ countries, top-performing countries are highlighted below.
India demonstrates the strongest growth potential in the market with a CAGR of 7.8% through 2035. The country's leadership position stems from large urban infrastructure development, massive wind energy build-out under national renewable energy targets, and automotive sector adoption of lightweight composite materials for emissions compliance. Growth is concentrated in major manufacturing regions, including Maharashtra, Gujarat, Tamil Nadu, and Karnataka, where construction projects and wind turbine manufacturing facilities are implementing advanced fiberglass solutions for enhanced product performance and cost competitiveness. Distribution channels through established chemical suppliers and direct manufacturer relationships expand deployment across insulation manufacturing, automotive component production, and wind blade fabrication facilities. The country's renewable energy targets and housing development initiatives provide policy support for advanced materials adoption, including high-performance fiberglass system integration.
Key market factors:
In major industrial centers including Zhejiang, Jiangsu, Shandong, and Hebei, the adoption of fiberglass systems is accelerating across wind turbine blade manufacturing, construction materials production, and automotive component facilities, driven by renewable energy targets and export manufacturing competitiveness. The market demonstrates strong growth momentum with a CAGR of 5.9% through 2035, linked to comprehensive wind and solar capacity expansion and increasing focus on high-specification composite materials for international markets. Chinese manufacturers are implementing advanced glass fiber production technologies and quality control platforms to enhance product performance while meeting growing demand for wind energy components and composite materials in domestic and export markets. The country's renewable energy leadership creates constant demand for high-performance fiberglass solutions, while ongoing capacity additions in rovings and fabrics strengthen export availability.
Key market characteristics:
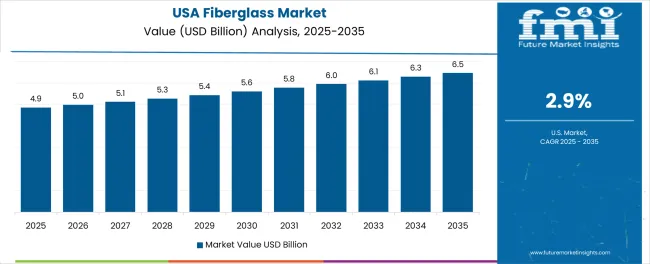
The United States' advanced composite industry demonstrates sophisticated implementation of fiberglass systems, with documented case studies showing significant performance improvements in aerospace applications through optimized glass fiber composite solutions. The country's manufacturing infrastructure in major industrial states, including Texas, California, North Carolina, and Arizona, showcases integration of advanced fiberglass technologies with existing production systems, leveraging expertise in composite engineering and precision manufacturing. American manufacturers prioritize aerospace-grade quality standards and automotive lightweighting requirements, creating demand for high-performance glass fiber solutions that support innovation initiatives and regulatory compliance. The market maintains steady growth through focus on technology development and advanced manufacturing capabilities, with a CAGR of 2.9% through 2035.
Key development areas:
France's market expansion is driven by aerospace composite manufacturing leadership, including advanced applications in aircraft structures and interior components, wind energy program development supporting offshore installations, and comprehensive energy-efficient construction requirements across residential and commercial sectors. The country demonstrates promising growth potential with a CAGR of 2.4% through 2035, supported by government renewable energy programs and aerospace industry innovation initiatives. French manufacturers face competitive pressure from international suppliers but maintain technology leadership through bio-based resin research and development programs that enhance environmental sustainability while meeting stringent performance requirements. Growing aerospace production rates and wind energy targets create compelling business cases for advanced fiberglass system adoption, particularly in composite manufacturing regions where material innovation has direct impact on international competitiveness.
Market characteristics:
Japan's market demonstrates sophisticated implementation focused on precision engineering and quality excellence optimization, with documented integration of advanced composite systems achieving performance improvements in automotive and robotics applications. The country maintains steady growth momentum with a CAGR of 2.2% through 2035, driven by manufacturers' focus on quality standards and continuous improvement methodologies that align with lean manufacturing principles applied to composite material processing operations. Major industrial regions, including Kanto, Kansai, Chubu, and Kyushu, showcase advanced deployment of precision composite platforms where glass fiber systems integrate seamlessly with existing quality control programs and comprehensive manufacturing management systems.
Key market characteristics:
In England, Scotland, Wales, and Northern Ireland, manufacturing facilities are implementing fiberglass solutions to support offshore wind turbine blade production and enhance building insulation performance, with documented case studies showing efficiency improvements through optimized composite applications. The market shows moderate growth potential with a CAGR of 2.1% through 2035, linked to offshore wind expansion programs, green building code implementations, and marine composite innovation initiatives. British manufacturers are adopting advanced glass fiber systems and quality control technologies to enhance product performance while maintaining environmental standards demanded by UK regulations and international export markets. The country's offshore wind development creates steady demand for large-scale turbine blade manufacturing that requires advanced fiberglass composite solutions.
Market development factors:
Germany's advanced automotive industry demonstrates sophisticated implementation of fiberglass composite systems, with documented applications in vehicle lightweighting programs and structural component development for electric vehicle platforms. The country's manufacturing infrastructure in major industrial centers, including Baden-Württemberg, Bavaria, North Rhine-Westphalia, and Lower Saxony, showcases integration of advanced composite technologies with automotive production systems, leveraging expertise in materials engineering and precision manufacturing. German manufacturers prioritize sustainability and circular economy principles, creating demand for recyclable composite solutions and lower-embodied-carbon glass fiber materials that support environmental initiatives. The market maintains steady growth through focus on automotive innovation and onshore wind repowering projects, with a CAGR of 2.0% through 2035.
Key development areas:
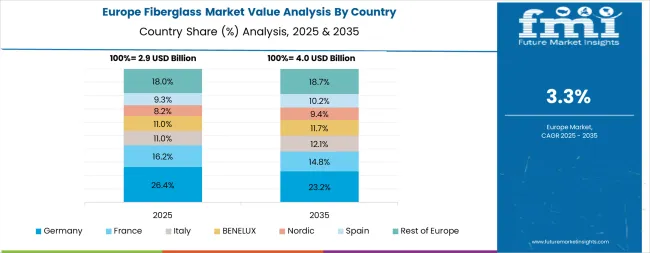
The fiberglass market in Europe is projected to demonstrate steady growth through 2035, driven by renewable energy expansion, automotive light weighting requirements, and energy-efficient construction initiatives. Germany is expected to maintain its leadership position with approximately 22% market share in 2025, supported by its extensive automotive manufacturing infrastructure and major composite production facilities in Stuttgart, Munich, and Frankfurt regions.
France follows with approximately 16% share in 2025, driven by comprehensive aerospace composite programs and offshore wind energy development initiatives. The United Kingdom holds approximately 14% share, supported by offshore wind expansion in the North Sea and Atlantic waters requiring large-scale turbine blade manufacturing capabilities. Italy commands approximately 11% market share through construction applications and marine composite manufacturing, while Spain accounts for approximately 9% driven by wind energy installations and building insulation demand.
The Nordic region is anticipated to maintain approximately 9% share, attributed to offshore wind projects and green construction initiatives across Sweden, Norway, Denmark, and Finland. Benelux countries hold approximately 7% share through chemical industry integration and port infrastructure applications. Central and Eastern Europe, including Poland, Czech Republic, and Hungary, represents approximately 8% share driven by automotive component manufacturing and construction sector expansion. The Rest of Europe accounts for approximately 4% of regional market share.
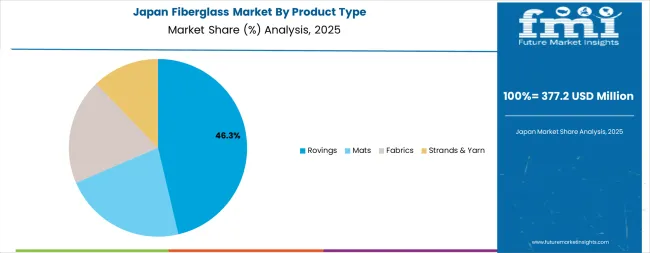
The Japanese market demonstrates a mature and quality-focused landscape, characterized by sophisticated integration of rovings and woven fabric systems with existing precision manufacturing infrastructure across automotive production facilities, robotics manufacturers, and specialized composite application centers. Japan's focus on manufacturing excellence and quality standards drives demand for high-consistency glass fiber solutions that support kaizen continuous improvement initiatives and statistical process control requirements in precision composite operations. The market benefits from strong partnerships between international fiberglass providers like Owens Corning, Saint-Gobain, and domestic materials leaders, including Nippon Electric Glass, Nittobo, and Asahi Fiber Glass, creating comprehensive service ecosystems that prioritize material consistency and application precision programs. Manufacturing centers in Tokyo, Osaka, Nagoya, and other major industrial areas showcase advanced quality control implementations where glass fiber systems achieve exceptional performance consistency through integrated monitoring programs.
The South Korean market is characterized by strong international technology provider presence, with companies like Owens Corning, Saint-Gobain, and 3B-the fibreglass company maintaining significant positions through comprehensive system integration and technical services capabilities for automotive manufacturing and renewable energy applications. The market is demonstrating growing focus on advanced composite development and precision manufacturing capabilities, as Korean manufacturers increasingly demand customized solutions that integrate with domestic automotive production infrastructure and sophisticated quality control systems deployed across Hyundai, Kia, and other major automotive complexes. Local composite manufacturers and regional specialty materials producers are gaining market share through strategic partnerships with global providers, offering specialized services including Korean market customization and technical support programs for automotive and wind energy applications. The competitive landscape shows increasing collaboration between multinational fiberglass companies and Korean composite specialists, creating hybrid service models that combine international materials expertise with local manufacturing knowledge and quality management systems.
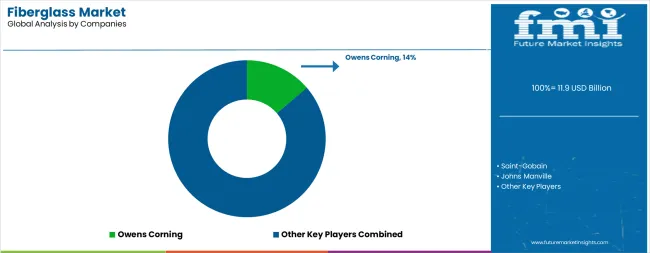
The market features approximately 20-25 meaningful players with moderate concentration, where the top three companies control roughly 35-42% of global market share through established production platforms and extensive manufacturing networks. Competition centers on product quality, technical performance, and manufacturing scale rather than price competition alone. The leading company, Owens Corning, commands approximately 14.0% of global market share through comprehensive product portfolios, manufacturing excellence, and strong brand recognition across construction insulation and composite materials segments.
Market leaders include Owens Corning, Saint-Gobain, and Johns Manville, which maintain competitive advantages through comprehensive glass fiber solution portfolios, global manufacturing networks, and deep expertise in insulation materials and composite reinforcement sectors, creating high switching costs for customers. These companies leverage research and development capabilities and ongoing technical support relationships to defend market positions while expanding into adjacent applications including wind energy and automotive composites.
Challengers encompass China Jushi Co., Ltd. and Chongqing Polycomp International, which compete through manufacturing scale advantages and strong regional presence in Asia-Pacific markets. Technology specialists, including Taishan Fiberglass, Nippon Electric Glass, 3B-the fibreglass company, AGY Holding, and Nittobo, focus on specific glass fiber formulations or vertical applications, offering differentiated capabilities in specialty glass types, customization services, and specialized performance characteristics.
Regional players and emerging glass fiber producers create competitive pressure through cost-effective solutions and rapid capacity expansion capabilities, particularly in high-growth markets including India and China, where local presence provides advantages in customer service and market responsiveness. Market dynamics favor companies that combine advanced glass fiber production technologies with comprehensive technical support offerings that address the complete material lifecycle from formulation development through ongoing application optimization and customer collaboration programs.
Fiberglass represents specialized glass fiber reinforcement materials that enable manufacturers to achieve 30-50% weight reduction compared to traditional materials like steel and concrete, delivering superior strength-to-weight ratios and exceptional durability with excellent thermal insulation and corrosion resistance in demanding applications. With the market projected to grow from USD 11.9 billion in 2025 to USD 19.9 billion by 2035 at a 5.3% CAGR, these glass fiber systems offer compelling advantages - lightweight performance, energy efficiency, and design flexibility - making them essential for construction applications (29% market share), automotive lightweighting (21% share), and wind energy sectors seeking alternatives to heavier materials that compromise efficiency through excessive weight. Scaling market adoption and technological advancement requires coordinated action across renewable energy policy, construction standards development, glass fiber manufacturers, application industries, and materials science investment capital.
| Item | Value |
|---|---|
| Quantitative Units | USD 11.9 billion |
| Product Type | Rovings (Direct rovings, Assembled rovings), Mats, Fabrics, Strands & Yarn |
| Application | Construction (Insulation, Roofing & panels, Rebar & structural), Automotive, Wind Energy, Pipes & Tanks, Marine, Aerospace & Defence, Sports & Leisure, Other |
| Glass Type | E-Glass (Direct-roving forms, Chopped strands, Woven fabrics), ECR-Glass, S-Glass, C-Glass, Other |
| Regions Covered | Asia Pacific, Europe, North America, Latin America, Middle East & Africa |
| Country Covered | India, China, the USA, France, Japan, the UK, Germany, and 40+ countries |
| Key Companies Profiled | Owens Corning, Saint-Gobain, Johns Manville, China Jushi Co., Ltd., Chongqing Polycomp International, Taishan Fiberglass, Nippon Electric Glass, 3B-the fibreglass company, AGY Holding, Nittobo |
| Additional Attributes | Dollar sales by product type, application, and glass type categories, regional adoption trends across Asia Pacific, Europe, and North America, competitive landscape with glass fiber manufacturers and composite integrators, manufacturing facility requirements and specifications, integration with renewable energy initiatives and automotive lightweighting programs, innovations in glass fiber technology and composite systems, and development of specialized formulations with enhanced performance and ecofriendly capabilities. |
The global fiberglass market is estimated to be valued at USD 11.9 billion in 2025.
The market size for the fiberglass market is projected to reach USD 19.9 billion by 2035.
The fiberglass market is expected to grow at a 5.3% CAGR between 2025 and 2035.
The key product types in fiberglass market are rovings, mats, fabrics and strands & yarn.
In terms of application, construction segment to command 29.0% share in the fiberglass market in 2025.


Our Research Products

The "Full Research Suite" delivers actionable market intel, deep dives on markets or technologies, so clients act faster, cut risk, and unlock growth.

The Leaderboard benchmarks and ranks top vendors, classifying them as Established Leaders, Leading Challengers, or Disruptors & Challengers.

Locates where complements amplify value and substitutes erode it, forecasting net impact by horizon

We deliver granular, decision-grade intel: market sizing, 5-year forecasts, pricing, adoption, usage, revenue, and operational KPIs—plus competitor tracking, regulation, and value chains—across 60 countries broadly.

Spot the shifts before they hit your P&L. We track inflection points, adoption curves, pricing moves, and ecosystem plays to show where demand is heading, why it is changing, and what to do next across high-growth markets and disruptive tech

Real-time reads of user behavior. We track shifting priorities, perceptions of today’s and next-gen services, and provider experience, then pace how fast tech moves from trial to adoption, blending buyer, consumer, and channel inputs with social signals (#WhySwitch, #UX).

Partner with our analyst team to build a custom report designed around your business priorities. From analysing market trends to assessing competitors or crafting bespoke datasets, we tailor insights to your needs.
Supplier Intelligence
Discovery & Profiling
Capacity & Footprint
Performance & Risk
Compliance & Governance
Commercial Readiness
Who Supplies Whom
Scorecards & Shortlists
Playbooks & Docs
Category Intelligence
Definition & Scope
Demand & Use Cases
Cost Drivers
Market Structure
Supply Chain Map
Trade & Policy
Operating Norms
Deliverables
Buyer Intelligence
Account Basics
Spend & Scope
Procurement Model
Vendor Requirements
Terms & Policies
Entry Strategy
Pain Points & Triggers
Outputs
Pricing Analysis
Benchmarks
Trends
Should-Cost
Indexation
Landed Cost
Commercial Terms
Deliverables
Brand Analysis
Positioning & Value Prop
Share & Presence
Customer Evidence
Go-to-Market
Digital & Reputation
Compliance & Trust
KPIs & Gaps
Outputs
Full Research Suite comprises of:
Market outlook & trends analysis
Interviews & case studies
Strategic recommendations
Vendor profiles & capabilities analysis
5-year forecasts
8 regions and 60+ country-level data splits
Market segment data splits
12 months of continuous data updates
DELIVERED AS:
PDF EXCEL ONLINE
Fiberglass Centrifugal Fan Market Size and Share Forecast Outlook 2025 to 2035
Fiberglass Tanks Market Size and Share Forecast Outlook 2025 to 2035
Fiberglass Fabric Market Size and Share Forecast Outlook 2025 to 2035
Fiberglass Duct Wrap Insulation Market Size and Share Forecast Outlook 2025 to 2035
Fiberglass Filters Market Size and Share Forecast Outlook 2025 to 2035
Fiberglass Light Poles Market Size and Share Forecast Outlook 2025 to 2035
Fiberglass Electrical Enclosure Market Analysis - Size, Share & Forecast 2025 to 2035
Fiberglass Cloth Market
High Temperature Fiberglass Filter Media Market Size and Share Forecast Outlook 2025 to 2035

Thank you!
You will receive an email from our Business Development Manager. Please be sure to check your SPAM/JUNK folder too.
Chat With
MaRIA