Light Management System Market Overview for 2024 to 2034

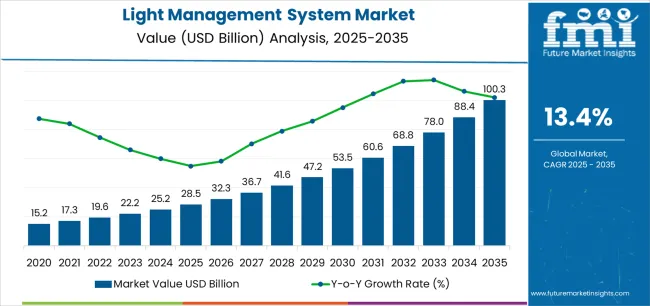
The light management system market is expected to grow at a CAGR of 14.1% during the projected period. The market value is projected to increase from USD 25 billion in 2024 to USD 93 billion by 2034.

Attributes Details
Light Management System Market Size, 2024 USD 25 billion
Projected Market Size, 2034 USD 93 billion
Value-based CAGR (2024 to 2034) 14.1%

Light Management System Market Size, Analysis, and Insights

  • Increasing need for productivity and safety light management systems are integral to industrial areas.
  • Growing trend of smart homes and buildings is driving the demand for light management systems. The light management systems are integrated with other smart home technologies to provide an enhanced user experience and energy-efficient lighting solutions.
  • Increasing adoption of smart home technologies is stimulating the demand for light management systems.
  • Increasing use of LED lighting is known for its low power consumption, longer lifespan, and high energy efficiency, which has increased demand for light management systems that can help maximize the benefits of LED lighting by providing efficient control and management.
  • Increasing focus on sustainability and energy conservation.
  • Governments across the world are implementing various regulations and initiatives to promote sustainable practices, and this has led to an increased demand for energy-efficient lighting solutions.
  • Growing trend of urbanization and the adoption of smart city initiatives are fueling market growth.
  • Governments are investing heavily in the development of smart cities, which require efficient lighting solutions to ensure safety, security, and sustainability.
  • Light management systems are likely to play a crucial role in providing these solutions, thereby driving the demand for light management systems in the market.

Key Opportunities in the Light Management System Market

  • Development of wireless technologies is expected to create lucrative opportunities during the forecast period. Wireless technologies enable more advanced lighting control capabilities, such as occupancy sensing, daylight harvesting, and color tuning, which can improve energy efficiency and user experience.
  • Increasing emphasis on sustainability and environmental responsibility is driving the demand for energy-efficient and eco-friendly lighting solutions, which presents an opportunity for manufacturers to develop innovative products that are both energy-efficient and environmentally friendly, such as those that use renewable energy sources or incorporate recycled materials.
  • Growth of smart cities and the Internet of Things (IoT) is driving the demand for intelligent lighting systems that can be remotely monitored and controlled. This can enable real-time adjustments to lighting levels in response to changing environmental conditions or user preferences, resulting in greater energy efficiency and cost savings.

Challenges in the Light Management System Market

  • The lack of standardization in the industry is likely to hamper market growth over the coming years. With so many different types of lighting systems available, it is likely to be difficult for manufacturers and consumers to agree on a set of standards that will ensure consistency and interoperability between different systems.
  • With the rise of smart homes and the Internet of Things (IoT), lighting systems are becoming more interconnected and intelligent than ever before.
  • IoT and smart homes create new opportunities for automation and control, but it also requires new levels of expertise and technical know-how to design, install, and maintain these systems.
  • Increasing competition from other sectors is expected to restrict the growth of the market.
  • For example, the rise of smart home automation systems has led to increased competition for lighting control and management. Similarly, advances in wireless communication technologies are enabling new types of lighting systems that can be controlled remotely through smartphones and other devices.

Category-wise Insights

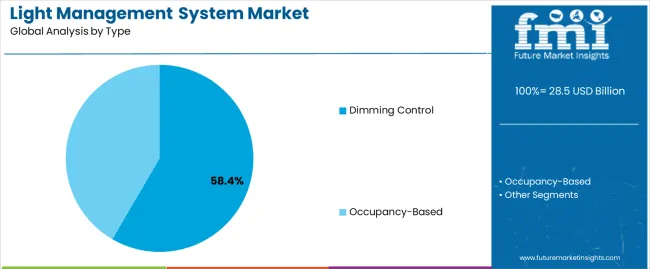
In terms of Type, the Dimming Control Segment Leads the Market Growth

Attributes Details
Top Type Dimming Control
CAGR (2024 to 2034) 13.9%
  • Emergence of smart lighting systems can be controlled remotely through mobile applications or voice commands, which is driving the demand for dimming control solutions.
  • LED lighting technology is also contributing to the growth of the dimming control segment. Dimming control allows users to maximize the energy-saving potential of LED lighting, while also enhancing the visual comfort and ambiance of the space.
  • Increasing need for energy-efficient lighting solutions in various industries is driving demand for the dimming control solutions. In commercial buildings, lighting accounts for a significant portion of energy consumption, making it a prime target for energy-saving measures.

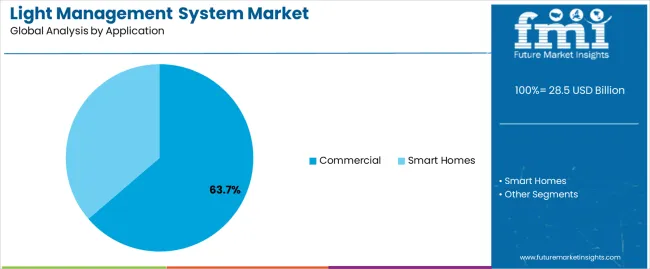
In terms of Application, the Smart Homes Segment is dominating the Market

Attributes Details
Top Application Smart Homes
CAGR (2024 to 2034) 13.6%
  • The smart homes segment is dominating the light management system market due to the increasing adoption of smart home technology and the growing trend of home automation.
  • Increasing availability of affordable and user-friendly smart home devices, such as smart lighting systems, is making it easier for consumers to adopt these solutions, which is further driving the growth of the segment.
  • Increasing adoption of smart home technology in emerging economies, such as China and India, is also contributing to the segment’s growth. These countries are witnessing rapid urbanization, rising disposable incomes, and growing awareness about energy-efficient solutions, which are further fueling the segment’s growth.

Country-wise insights

Countries CAGR through 2034
United States 14.4%
United Kingdom 15.6%
China 15.0%
Japan 15.7%
South Korea 16.3%

Growing Trend of Smart Homes and Building Automation in the United States

  • The United States has been witnessing a significant increase in demand for light management systems due to the growing number of energy-efficient building initiatives.
  • The government has been providing incentives to promote the adoption of energy-saving technologies, which has led to the increased demand for light management systems in both commercial and residential sectors.
  • The growing trend of smart homes and building automation systems also contributes to the rise in the United States market.

Focus on Reducing Carbon Emissions in the United Kingdom

  • The United Kingdom is another country where the market for light management systems has been growing rapidly.
  • The government's focus on reducing carbon emissions has led to the implementation of policies that promote the use of energy-efficient technologies. As a result, there has been a growing demand for light management systems in both commercial and residential buildings.

Government Investing Heavily in the Semiconductor Industry in China

  • Rapid growth of the Chinese economy has led to a surge in demand for commercial and residential buildings. As more people move into cities and the demand for office space increases, there is a corresponding need for advanced lighting systems that can meet the needs of these buildings.
  • The Chinese market for light management systems is highly competitive, with a large number of both domestic and international players vying for market share.
  • Companies operating in this space need high-quality products at competitive prices, while also providing excellent customer service and support.

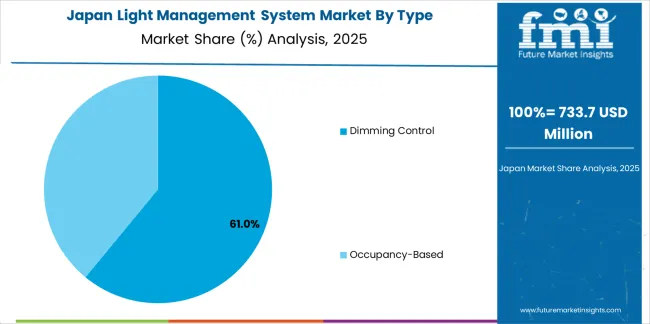
Increasing Usage of Advanced Lighting Systems in Commercial, Residential, and Industrial Spaces in Japan

  • Increasing urbanization and industrialization in the country have led to a surge in demand for smart lighting solutions.
  • The use of advanced lighting systems in commercial, residential, and industrial spaces has become a necessity to improve energy efficiency, enhance productivity, and reduce maintenance costs.
  • The Japanese government has been promoting the use of IoT-based lighting systems, which has further fueled the growth of the light management system market in the country. The integration of IoT technology with lighting systems enables real-time monitoring, remote control, and automation of lighting operations, resulting in improved energy savings and enhanced comfort levels.

Increasing Demand for Energy-Efficient Lighting Solutions in South Korea

  • South Korea is a country that has been at the forefront of technological innovation and development.
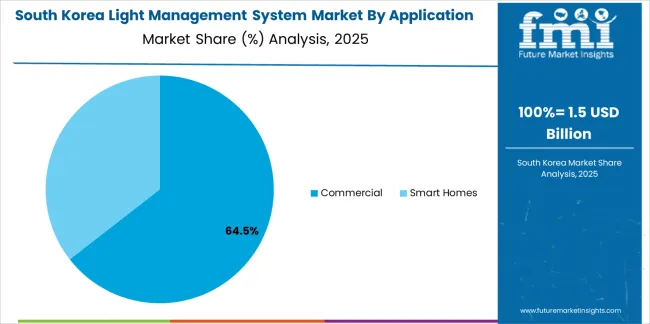
  • Increasing demand for energy-efficient lighting solutions. With a growing concern for the environment and the need to reduce energy costs, both residential and commercial customers in South Korea are turning towards light management systems that can help them achieve these goals. These systems allow for better control over lighting, enabling users to adjust the lighting levels based on their needs and preferences.

Competitive Landscape

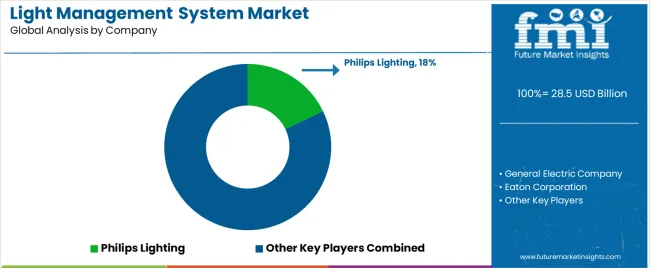
The market is quite diverse and rapidly evolving. Companies are constantly working to innovate and improve their products to stay ahead of the competition. Additionally, many smaller players in the market are also competing for market share. Overall, the light management system market is highly competitive, with companies offering a wide range of products and services to meet the needs of their customers.

Recent Development in the Light Management System Market

  • In 2023, ABB is set to launch its latest innovation, the Cylon Smart Building Management System, at the upcoming Light Middle East 2023 event. This new system promises to revolutionize the way light management is handled in commercial and residential buildings, and offers a comprehensive solution for all your lighting needs.

Key Market Players

  • Philips Lighting
  • General Electric Company
  • Eaton Corporation
  • Honeywell International Inc.
  • OSRAM Licht AG
  • Schneider Electric SE
  • Acuity Brands Lighting Inc.
  • Cree Inc.
  • Legrand SA
  • Lutron Electronics Co. Inc.
  • Leviton Manufacturing Co., Inc.
  • Hubbell Incorporated
  • Zumtobel Group AG
  • Digital Lumens Inc.
  • Hafele Group

Key Coverage in the Light Management System Market Report

  • Networked Lighting Control System Market Landscape
  • Light Management System Industry Assessment
  • Commercial Lighting Management System Market Overview
  • LED Lighting Management Pricing Outlook
  • Smart Lighting System Market Trends Analysis

Key Market Segments

By Type:

  • Dimming Control
  • Occupancy-Based

By Application:

  • Smart Homes
  • Commercial

By Region:

  • North America
  • Latin America
  • East Asia
  • South Asia
  • Europe
  • Oceania
  • MEA

Table of Content

  • 1. Executive Summary
  • 2. Market Overview
  • 3. Market Background
  • 4. Global Market Analysis 2019 to 2023 and Forecast, 2024 to 2034
  • 5. Global Market Analysis 2019 to 2023 and Forecast 2024 to 2034, By Type
    • 5.1. Dimming Control
    • 5.2. Occupancy-Based
  • 6. Global Market Analysis 2019 to 2023 and Forecast 2024 to 2034, By Application
    • 6.1. Smart Homes
    • 6.2. Commercial
  • 7. Global Market Analysis 2019 to 2023 and Forecast 2024 to 2034, By Region
    • 7.1. North America
    • 7.2. Latin America
    • 7.3. Western Europe
    • 7.4. Eastern Europe
    • 7.5. South Asia and Pacific
    • 7.6. East Asia
    • 7.7. Middle East and Africa
  • 8. North America Market Analysis 2019 to 2023 and Forecast 2024 to 2034, By Country
  • 9. Latin America Market Analysis 2019 to 2023 and Forecast 2024 to 2034, By Country
  • 10. Western Europe Market Analysis 2019 to 2023 and Forecast 2024 to 2034, By Country
  • 11. Eastern Europe Market Analysis 2019 to 2023 and Forecast 2024 to 2034, By Country
  • 12. South Asia and Pacific Market Analysis 2019 to 2023 and Forecast 2024 to 2034, By Country
  • 13. East Asia Market Analysis 2019 to 2023 and Forecast 2024 to 2034, By Country
  • 14. Middle East and Africa Market Analysis 2019 to 2023 and Forecast 2024 to 2034, By Country
  • 15. Key Countries Market Analysis
    • 15.1. By Application
  • 16. Market Structure Analysis
  • 17. Competition Analysis
    • 17.1. Schneider Electric
    • 17.2. ABB
    • 17.3. Eaton
    • 17.4. Siemens
    • 17.5. Philips Lighting
    • 17.6. Osram
    • 17.7. GE
    • 17.8. Legrand
    • 17.9. Acuity
    • 17.10. Lutron
    • 17.11. Honeywell
    • 17.12. Zumtobel Group
  • 18. Assumptions & Acronyms Used
  • 19. Research Methodology

List of Tables

Table 1: Global Market Value (US$ Million) Forecast by Region, 2019 to 2034

Table 2: Global Market Value (US$ Million) Forecast by Type, 2019 to 2034

Table 3: Global Market Value (US$ Million) Forecast by Application, 2019 to 2034

Table 4: North America Market Value (US$ Million) Forecast by Country, 2019 to 2034

Table 5: North America Market Value (US$ Million) Forecast by Type, 2019 to 2034

Table 6: North America Market Value (US$ Million) Forecast by Application, 2019 to 2034

Table 7: Latin America Market Value (US$ Million) Forecast by Country, 2019 to 2034

Table 8: Latin America Market Value (US$ Million) Forecast by Type, 2019 to 2034

Table 9: Latin America Market Value (US$ Million) Forecast by Application, 2019 to 2034

Table 10: Western Europe Market Value (US$ Million) Forecast by Country, 2019 to 2034

Table 11: Western Europe Market Value (US$ Million) Forecast by Type, 2019 to 2034

Table 12: Western Europe Market Value (US$ Million) Forecast by Application, 2019 to 2034

Table 13: Eastern Europe Market Value (US$ Million) Forecast by Country, 2019 to 2034

Table 14: Eastern Europe Market Value (US$ Million) Forecast by Type, 2019 to 2034

Table 15: Eastern Europe Market Value (US$ Million) Forecast by Application, 2019 to 2034

Table 16: South Asia and Pacific Market Value (US$ Million) Forecast by Country, 2019 to 2034

Table 17: South Asia and Pacific Market Value (US$ Million) Forecast by Type, 2019 to 2034

Table 18: South Asia and Pacific Market Value (US$ Million) Forecast by Application, 2019 to 2034

Table 19: East Asia Market Value (US$ Million) Forecast by Country, 2019 to 2034

Table 20: East Asia Market Value (US$ Million) Forecast by Type, 2019 to 2034

Table 21: East Asia Market Value (US$ Million) Forecast by Application, 2019 to 2034

Table 22: Middle East and Africa Market Value (US$ Million) Forecast by Country, 2019 to 2034

Table 23: Middle East and Africa Market Value (US$ Million) Forecast by Type, 2019 to 2034

Table 24: Middle East and Africa Market Value (US$ Million) Forecast by Application, 2019 to 2034

List of Figures

Figure 1: Global Market Value (US$ Million) by Type, 2024 to 2034

Figure 2: Global Market Value (US$ Million) by Application, 2024 to 2034

Figure 3: Global Market Value (US$ Million) by Region, 2024 to 2034

Figure 4: Global Market Value (US$ Million) Analysis by Region, 2019 to 2034

Figure 5: Global Market Value Share (%) and BPS Analysis by Region, 2024 to 2034

Figure 6: Global Market Y-o-Y Growth (%) Projections by Region, 2024 to 2034

Figure 7: Global Market Value (US$ Million) Analysis by Type, 2019 to 2034

Figure 8: Global Market Value Share (%) and BPS Analysis by Type, 2024 to 2034

Figure 9: Global Market Y-o-Y Growth (%) Projections by Type, 2024 to 2034

Figure 10: Global Market Value (US$ Million) Analysis by Application, 2019 to 2034

Figure 11: Global Market Value Share (%) and BPS Analysis by Application, 2024 to 2034

Figure 12: Global Market Y-o-Y Growth (%) Projections by Application, 2024 to 2034

Figure 13: Global Market Attractiveness by Type, 2024 to 2034

Figure 14: Global Market Attractiveness by Application, 2024 to 2034

Figure 15: Global Market Attractiveness by Region, 2024 to 2034

Figure 16: North America Market Value (US$ Million) by Type, 2024 to 2034

Figure 17: North America Market Value (US$ Million) by Application, 2024 to 2034

Figure 18: North America Market Value (US$ Million) by Country, 2024 to 2034

Figure 19: North America Market Value (US$ Million) Analysis by Country, 2019 to 2034

Figure 20: North America Market Value Share (%) and BPS Analysis by Country, 2024 to 2034

Figure 21: North America Market Y-o-Y Growth (%) Projections by Country, 2024 to 2034

Figure 22: North America Market Value (US$ Million) Analysis by Type, 2019 to 2034

Figure 23: North America Market Value Share (%) and BPS Analysis by Type, 2024 to 2034

Figure 24: North America Market Y-o-Y Growth (%) Projections by Type, 2024 to 2034

Figure 25: North America Market Value (US$ Million) Analysis by Application, 2019 to 2034

Figure 26: North America Market Value Share (%) and BPS Analysis by Application, 2024 to 2034

Figure 27: North America Market Y-o-Y Growth (%) Projections by Application, 2024 to 2034

Figure 28: North America Market Attractiveness by Type, 2024 to 2034

Figure 29: North America Market Attractiveness by Application, 2024 to 2034

Figure 30: North America Market Attractiveness by Country, 2024 to 2034

Figure 31: Latin America Market Value (US$ Million) by Type, 2024 to 2034

Figure 32: Latin America Market Value (US$ Million) by Application, 2024 to 2034

Figure 33: Latin America Market Value (US$ Million) by Country, 2024 to 2034

Figure 34: Latin America Market Value (US$ Million) Analysis by Country, 2019 to 2034

Figure 35: Latin America Market Value Share (%) and BPS Analysis by Country, 2024 to 2034

Figure 36: Latin America Market Y-o-Y Growth (%) Projections by Country, 2024 to 2034

Figure 37: Latin America Market Value (US$ Million) Analysis by Type, 2019 to 2034

Figure 38: Latin America Market Value Share (%) and BPS Analysis by Type, 2024 to 2034

Figure 39: Latin America Market Y-o-Y Growth (%) Projections by Type, 2024 to 2034

Figure 40: Latin America Market Value (US$ Million) Analysis by Application, 2019 to 2034

Figure 41: Latin America Market Value Share (%) and BPS Analysis by Application, 2024 to 2034

Figure 42: Latin America Market Y-o-Y Growth (%) Projections by Application, 2024 to 2034

Figure 43: Latin America Market Attractiveness by Type, 2024 to 2034

Figure 44: Latin America Market Attractiveness by Application, 2024 to 2034

Figure 45: Latin America Market Attractiveness by Country, 2024 to 2034

Figure 46: Western Europe Market Value (US$ Million) by Type, 2024 to 2034

Figure 47: Western Europe Market Value (US$ Million) by Application, 2024 to 2034

Figure 48: Western Europe Market Value (US$ Million) by Country, 2024 to 2034

Figure 49: Western Europe Market Value (US$ Million) Analysis by Country, 2019 to 2034

Figure 50: Western Europe Market Value Share (%) and BPS Analysis by Country, 2024 to 2034

Figure 51: Western Europe Market Y-o-Y Growth (%) Projections by Country, 2024 to 2034

Figure 52: Western Europe Market Value (US$ Million) Analysis by Type, 2019 to 2034

Figure 53: Western Europe Market Value Share (%) and BPS Analysis by Type, 2024 to 2034

Figure 54: Western Europe Market Y-o-Y Growth (%) Projections by Type, 2024 to 2034

Figure 55: Western Europe Market Value (US$ Million) Analysis by Application, 2019 to 2034

Figure 56: Western Europe Market Value Share (%) and BPS Analysis by Application, 2024 to 2034

Figure 57: Western Europe Market Y-o-Y Growth (%) Projections by Application, 2024 to 2034

Figure 58: Western Europe Market Attractiveness by Type, 2024 to 2034

Figure 59: Western Europe Market Attractiveness by Application, 2024 to 2034

Figure 60: Western Europe Market Attractiveness by Country, 2024 to 2034

Figure 61: Eastern Europe Market Value (US$ Million) by Type, 2024 to 2034

Figure 62: Eastern Europe Market Value (US$ Million) by Application, 2024 to 2034

Figure 63: Eastern Europe Market Value (US$ Million) by Country, 2024 to 2034

Figure 64: Eastern Europe Market Value (US$ Million) Analysis by Country, 2019 to 2034

Figure 65: Eastern Europe Market Value Share (%) and BPS Analysis by Country, 2024 to 2034

Figure 66: Eastern Europe Market Y-o-Y Growth (%) Projections by Country, 2024 to 2034

Figure 67: Eastern Europe Market Value (US$ Million) Analysis by Type, 2019 to 2034

Figure 68: Eastern Europe Market Value Share (%) and BPS Analysis by Type, 2024 to 2034

Figure 69: Eastern Europe Market Y-o-Y Growth (%) Projections by Type, 2024 to 2034

Figure 70: Eastern Europe Market Value (US$ Million) Analysis by Application, 2019 to 2034

Figure 71: Eastern Europe Market Value Share (%) and BPS Analysis by Application, 2024 to 2034

Figure 72: Eastern Europe Market Y-o-Y Growth (%) Projections by Application, 2024 to 2034

Figure 73: Eastern Europe Market Attractiveness by Type, 2024 to 2034

Figure 74: Eastern Europe Market Attractiveness by Application, 2024 to 2034

Figure 75: Eastern Europe Market Attractiveness by Country, 2024 to 2034

Figure 76: South Asia and Pacific Market Value (US$ Million) by Type, 2024 to 2034

Figure 77: South Asia and Pacific Market Value (US$ Million) by Application, 2024 to 2034

Figure 78: South Asia and Pacific Market Value (US$ Million) by Country, 2024 to 2034

Figure 79: South Asia and Pacific Market Value (US$ Million) Analysis by Country, 2019 to 2034

Figure 80: South Asia and Pacific Market Value Share (%) and BPS Analysis by Country, 2024 to 2034

Figure 81: South Asia and Pacific Market Y-o-Y Growth (%) Projections by Country, 2024 to 2034

Figure 82: South Asia and Pacific Market Value (US$ Million) Analysis by Type, 2019 to 2034

Figure 83: South Asia and Pacific Market Value Share (%) and BPS Analysis by Type, 2024 to 2034

Figure 84: South Asia and Pacific Market Y-o-Y Growth (%) Projections by Type, 2024 to 2034

Figure 85: South Asia and Pacific Market Value (US$ Million) Analysis by Application, 2019 to 2034

Figure 86: South Asia and Pacific Market Value Share (%) and BPS Analysis by Application, 2024 to 2034

Figure 87: South Asia and Pacific Market Y-o-Y Growth (%) Projections by Application, 2024 to 2034

Figure 88: South Asia and Pacific Market Attractiveness by Type, 2024 to 2034

Figure 89: South Asia and Pacific Market Attractiveness by Application, 2024 to 2034

Figure 90: South Asia and Pacific Market Attractiveness by Country, 2024 to 2034

Figure 91: East Asia Market Value (US$ Million) by Type, 2024 to 2034

Figure 92: East Asia Market Value (US$ Million) by Application, 2024 to 2034

Figure 93: East Asia Market Value (US$ Million) by Country, 2024 to 2034

Figure 94: East Asia Market Value (US$ Million) Analysis by Country, 2019 to 2034

Figure 95: East Asia Market Value Share (%) and BPS Analysis by Country, 2024 to 2034

Figure 96: East Asia Market Y-o-Y Growth (%) Projections by Country, 2024 to 2034

Figure 97: East Asia Market Value (US$ Million) Analysis by Type, 2019 to 2034

Figure 98: East Asia Market Value Share (%) and BPS Analysis by Type, 2024 to 2034

Figure 99: East Asia Market Y-o-Y Growth (%) Projections by Type, 2024 to 2034

Figure 100: East Asia Market Value (US$ Million) Analysis by Application, 2019 to 2034

Figure 101: East Asia Market Value Share (%) and BPS Analysis by Application, 2024 to 2034

Figure 102: East Asia Market Y-o-Y Growth (%) Projections by Application, 2024 to 2034

Figure 103: East Asia Market Attractiveness by Type, 2024 to 2034

Figure 104: East Asia Market Attractiveness by Application, 2024 to 2034

Figure 105: East Asia Market Attractiveness by Country, 2024 to 2034

Figure 106: Middle East and Africa Market Value (US$ Million) by Type, 2024 to 2034

Figure 107: Middle East and Africa Market Value (US$ Million) by Application, 2024 to 2034

Figure 108: Middle East and Africa Market Value (US$ Million) by Country, 2024 to 2034

Figure 109: Middle East and Africa Market Value (US$ Million) Analysis by Country, 2019 to 2034

Figure 110: Middle East and Africa Market Value Share (%) and BPS Analysis by Country, 2024 to 2034

Figure 111: Middle East and Africa Market Y-o-Y Growth (%) Projections by Country, 2024 to 2034

Figure 112: Middle East and Africa Market Value (US$ Million) Analysis by Type, 2019 to 2034

Figure 113: Middle East and Africa Market Value Share (%) and BPS Analysis by Type, 2024 to 2034

Figure 114: Middle East and Africa Market Y-o-Y Growth (%) Projections by Type, 2024 to 2034

Figure 115: Middle East and Africa Market Value (US$ Million) Analysis by Application, 2019 to 2034

Figure 116: Middle East and Africa Market Value Share (%) and BPS Analysis by Application, 2024 to 2034

Figure 117: Middle East and Africa Market Y-o-Y Growth (%) Projections by Application, 2024 to 2034

Figure 118: Middle East and Africa Market Attractiveness by Type, 2024 to 2034

Figure 119: Middle East and Africa Market Attractiveness by Application, 2024 to 2034

Figure 120: Middle East and Africa Market Attractiveness by Country, 2024 to 2034

Frequently Asked Questions

How Big is the Light Management System Market in 2024?

The market is currently valued at around USD 25 billion in 2024.

What is China’s Market Outlook?

The market in China is expected to progress at a CAGR of 15.0% over the forecast period.

Which Type Segment Contributes More to the Light Management System Market?

The dimming control segment is expected to register a 13.9% CAGR from 2024 to 2034.

What is the United States Market Outlook?

The United States market is expected to grow at a 14.4% CAGR from 2024 to 2034.

What is the Projected Value of the Market by 2034?

The market is set to reach a valuation of USD 93 billion by 2034.

What Was the Historical CAGR for the Global Market?

The demand for light management systems increased at a 17.2% CAGR from 2019 to 2023.

Explore Vertical Solution Insights

Future Market Insights

Light Management System Market