Catalog Management System Market
Catalogue Management Facilitates the Creation of Specialized and Seasonal Catalogues for a Wide Range of Sectors, Resulting in New Business Opportunities.
Analysis of Catalog Management System Market by Product Catalog and Service Catalog
Catalog Management System Market Outlook (2023 to 2033)
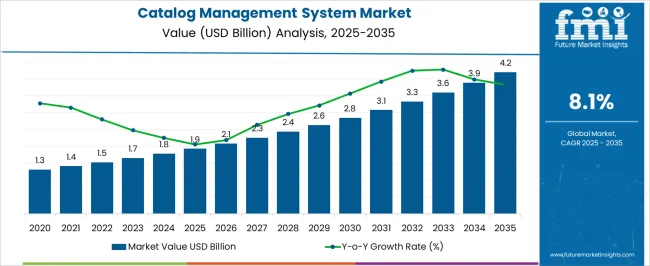
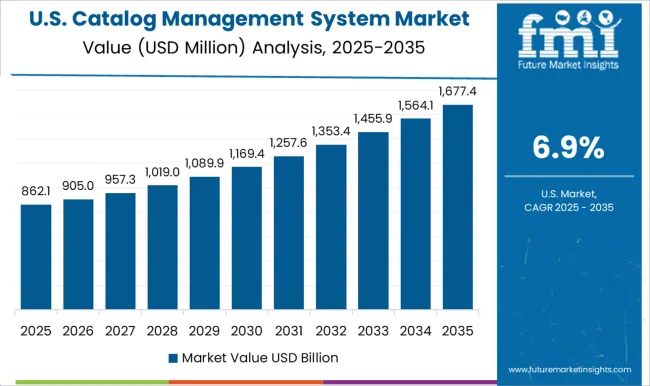
The catalog management system market size is projected to be valued at US$ 1,650.1 million in 2023 and is expected to rise to US$ 3,606.5 million by 2033. The sales of catalog management systems are expected to expand at a significant CAGR of 8.1% during the forecast period.
Businesses and SMEs in Retail and E-commerce might Increasingly Employ Catalog Management Systems Software as Cloud Computing Becomes Main Mainstream.
The catalog management systems market is fragmented since several firms compete in it. Factors projected to boost the sales of catalog management system software among companies and SMEs across a variety of sectors are increased cloud adoption and digital transformation.
Vendors in the market could expect additional prospects in developing nations throughout Asia Pacific and the Middle East and Africa (MEA). The demand for catalog management systems software manufacturers is now profitable, as multiple firms from various sectors are significantly implementing digital transformation across their enterprises.
Data shows the notable market in the sales of catalog management systems software vendors during COVID. It is because such software and solutions assisted organizations in categorizing and consolidating product or service data into a single digital point of location for organizations and their end customers i.e. buyers. Additionally, for businesses, the systems management and preserve product and service information, saving time and reducing human labor.
Attribute | Details |
---|---|
Catalog Management System Market Estimated Size (2023) |
US$ 1,650.1 million |
Catalog Management System Market CAGR (2023 to 2033) |
8.1% |
Catalog Management System Market Forecasted Size (2033) |
US$ 3,606.5 million |
Don't pay for what you don't need
Customize your report by selecting specific countries or regions and save 30%!
What are the Key Contributors to the Catalog Management Systems Market Growth?
Customer experience, staff efficiency, and overall company performance are improved by catalog management solutions. Because of expanding consumer demand for catalog management systems, internet access, and increased smartphone penetration, the eCommerce business has been developing at a breakneck speed. Moreover, the amount of money spent on the Internet has surged over the world. The eCommerce business is quickly expanding in nations such as the Philippines, Mexico, India, and China.
Catalog management systems aid in the reduction of service delivery costs, the enhancement of customer experience, staff efficiency, and the general operation of enterprises. Customers have a better shopping experience which enhances the sales of catalog management systems solutions since they provide extensive information on every product. These advantages assist firms in saving time and automating the updating of product information on eCommerce platforms.
What are the Limits to the Catalog Management Systems Market?
Data collection and transfer from one channel to another demand catalog management systems are the key hindrances. Catalog management systems are also engaged in data synchronization and publication across channels. Furthermore, sales of catalog management systems might lead to highly abstracted data sets due to a lack of sufficient information about security standards and their implementation.
The main reason for the slow adoption and demand for catalog management systems solutions is concerns regarding data security. Users are hesitant to use these solutions because they are afraid of losing their critical master and reference data owing to data mistakes that occur during compilation or upgrade.
Users believe that their data privacy is in danger, that there might be no responsibility for data losses or thefts, and no mitigation might be offered. Furthermore, people are concerned about the security of their data. As a result, businesses choose providers that can adjust their existing systems to manage product information and compete.
Find your sweet spots for generating winning opportunities in this market.
Talk to AnalystWhat are the Emerging Trends in the Catalog Management Systems Market?
Companies in areas like healthcare, retail, and BFSI have been investing in and implementing emerging technologies like AI and ML to expand and remain ahead of their competition. Automatic product categorization, anomaly detection, enrichment procedures through the selection of data from reputable sources, product rating, and contextual suggestions are all available with sales of catalog management systems.
Demand for catalog management systems solutions driven by AI may produce automatic insights regarding data problems and build an integrated picture of data from numerous systems. In turn, they allow customers to better understand their items. Furthermore, AI-enabled chatbots can improve consumer pleasure and experience, leading to increased revenues and profitability.
By sensing upcoming data quality issues and suggesting appropriate solutions to improve data matching and avoid data inconsistencies, ML enabled the demand for catalog management systems solutions. Consequently, this is going to assist organizations in managing compliance, driving data-based digital transformation, and achieving better operational efficiency.
IBM, for example, has begun to provide ML-enabled catalog management systems. It is anticipated that demand for such solutions might grow, spurring new improvements in demand for catalog management systems software.
How are Some Challenges Stifling Catalog Management Systems Market Growth?
The catalog needs for any business vary depending on the items or services supplied. There is no set structure that businesses adopt. Despite the benefits of catalog management systems in terms of cleansing, consolidation, and enrichment, businesses must adopt a governance strategy that maintains consistency across product catalogs to achieve consistent data. Similarly, while creating strategies for improved interfaces with current systems, data from systems with insufficient information or data inconsistencies must also be taken into account.
Get the data you need at a Fraction of the cost
Personalize your report by choosing insights you need
and save 40%!
Comparative View of the Catalog Management System Market
Catalog Management System Market:
Attributes | Catalog Management System Market |
---|---|
CAGR (2023 to 2033) |
8.1% |
Market Value (2033) |
US$ 3,606.5 million |
Growth Factor |
Increased client demand, internet access, and smartphone use are likely to certainly drive the e-commerce market for catalog management systems. |
Opportunity |
The market for catalog management software is significant as firms from all industries implement digital transformation. |
Mission Management Systems Market:
Attributes | Mission Management Systems Market |
---|---|
CAGR (2023 to 2033) |
12.0% |
Market Value (2033) |
US$ 45.48 billion |
Growth Factor |
Mission management systems improve situational awareness by integrating air, ground, and naval forces. |
Opportunity |
The growing need for increased situational awareness, and emergency and search and rescue management to drive the market in the approaching years. |
Identity Verification Market:
Attributes | Identity Verification Market |
---|---|
CAGR (2023 to 2033) |
14.8% |
Market Value (2033) |
US$ 14.94 billion |
Growth Factor |
The digitization of services provided to general citizens around the world has increased the demand for identity verification technologies, supporting the global identity verification market's significant growth. |
Opportunity |
The identity verification market is expected to be driven by increased awareness of the security and benefits of self-assessment identity verification in the coming years. |
What is the Segmentation Outlook for the Catalog Management Systems Market?
Product Catalog Share is a Crucial Factor to Consider in the Catalog Management Systems Market
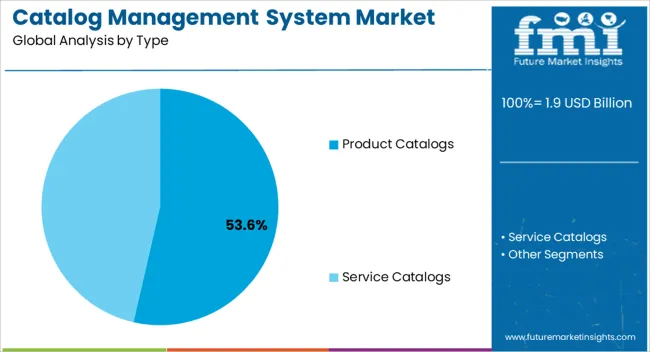
The product catalog segment is holding a significant share of 62.3% in the global market. The distribution of the product catalog share among different providers indicates the market presence and competitiveness of each company. Moreover, the product catalog share in the catalog management systems market is influenced by market trends, technological advancements, and customer demands.
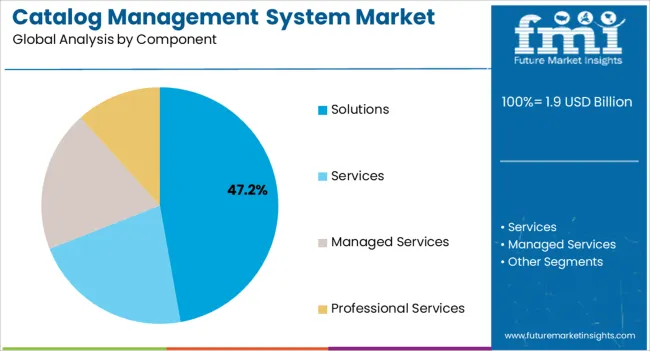
Companies that continuously update and expand their product catalogs are likely to attract many customers and gain a significant share of the market. The solution segment by component for the catalog management systems market is predicted to rise at a prominent CAGR of 7.5% by 2033 due to the factors such as:
- Requirement for professional and managed services to ensure the seamless operation of product information
- Manage data in a single repository.
Sales of catalog management systems solutions are significantly boosting to reduce downtime during the pre-and post-installation. It can also be improved in businesses at diverse locations by providing active help from trained personnel. These services give the required assistance to maintain business process efficiency, boost enterprise growth, and eliminate unnecessary operational costs.
Many Businesses Prefer the On-premise Deployment Model
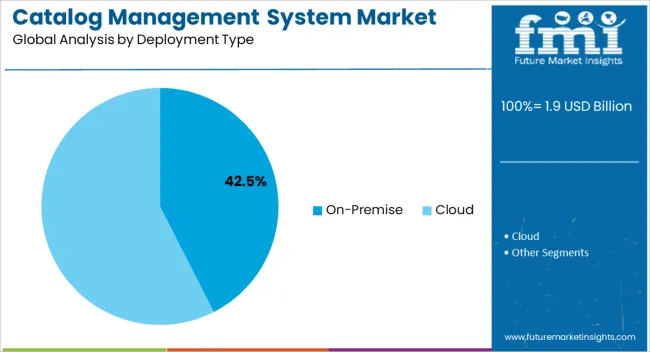
The on-premise segment holds a commanding share of 57.3% of the market. This segment caters to organizations that prioritize maintaining their catalog management software within their premises.
Certain industries, such as government, healthcare, and finance, often have strict regulations and compliance requirements that necessitate on-premise deployment. These organizations prefer to have complete control over their data and maintain it within their secure environment.
The cloud sector is likely to have a large proportion of the catalog management systems market, which is expanding significantly at a CAGR of 7.2% owing to enterprises in many areas quickly embracing the cloud for digital transformation. When opposed to SMEs, leading firms choose the on-premises option since the budget allocation for clearing the demand for catalog management systems software products and services in company equipment is often high.
Regional Analysis of Catalog Management System Market
North America Holds a Significant Position in the Catalog Management Systems Market
North America is a prominent hub in the global market capturing a significant share of 27.4% of the global market. The region is known for its advanced technological infrastructure, strong presence of key industry players, and large customer base. Businesses in North America across various sectors such as retail, e-commerce, and healthcare extensively utilize catalog management systems to efficiently organize and showcase their products and services.
The region's focus on data-driven decision-making and the adoption of advanced technologies, such as artificial intelligence and machine learning, further fuel the demand for catalog management systems.
The United Kingdom’s Advanced Business Landscape, Technological Infrastructure, and Emphasis on E-commerce Contribute to its Importance in the Market.
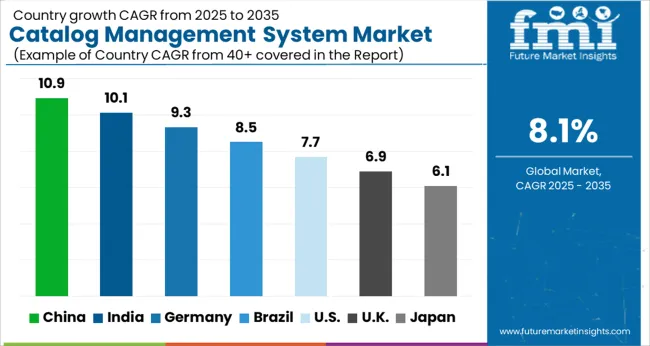
The United Kingdom is expanding at a transforming rate of 7.4% during the analysis period. The catalog management systems market in the United Kingdom benefits from various factors that promote its growth and development. The country has a well-established and highly competitive retail industry, both online and offline.
With the increasing popularity of e-commerce, businesses in the United Kingdom are focusing on effective management and organization of their product catalogs to provide an enhanced shopping experience to their customers. Furthermore, the United Kingdom boasts a thriving digital economy and has witnessed significant growth in the adoption of digital technologies.
China Offers Immense Opportunities for Businesses to Adopt Catalog Management Systems and Enhance their Operations.
China is set to become one of the most notable markets in the world, recording a CAGR of 9.2% between 2023 and 2033. China's e-commerce landscape is one of the large and most dynamic in the world. The country has experienced tremendous growth in online retail, with consumers increasingly turning to online platforms for their shopping needs.
Catalog management systems have become integral to digital strategies adopted by businesses in China as they seek to centralize and optimize their product data, ensuring consistency and accuracy across various sales channels. By leveraging catalog management systems, businesses in China can streamline their catalog management processes, and improve data quality, ultimately boosting customer engagement and loyalty.
Manufacturers are Focusing on Advanced Technologies
Suppliers have used several organic and inorganic development techniques to meet the need for catalog management systems, including:
- New product launches
- Product updates
- Partnerships and agreements
- Business expansions
- Mergers and acquisitions.
The study provides a thorough competitive analysis of the catalog management systems industry, including company profiles, recent advancements, and key market strategies.
Latest Developments
- In November 2020, Salsify teamed with e-Comas, an Amazon consultation, account management, and content optimization service. The collaboration aims to employ Salsify's technology to provide brand makers in Europe, the Middle East, and Africa (EMEA) with Amazon digital shelf excellence.
- In June 2020, Oracle released the Oracle Product Information Management version 12.1 installation guide. In this new edition, users may simply create responsibilities, users, suppliers, and customers, as well as set up item catalogs and categories and item templates, manage item statuses, change item catalog policies, define new item requests, manage display formats, and define report templates.
Scope of the Report
Attribute | Details |
---|---|
Growth Rate |
CAGR of 8.1% from 2023 to 2033 |
Base Year of Estimation |
2022 |
Historical Data |
2018 to 2022 |
Forecast Period |
2023 to 2033 |
Quantitative Units |
Revenue in US$ million and Volume in Units and F-CAGR from 2023 to 2033 |
Report Coverage |
Revenue Forecast, Volume Forecast, Company Ranking, Competitive Landscape, growth factors, Trends, and Pricing Analysis |
Key Segments Covered |
|
Regions Covered |
|
Key Countries Profiled |
|
Key Companies Profiled |
|
Customization & Pricing |
Available upon Request |
Key Segments Covered in the Catalog Management System Market Report
By Type:
- Product Catalogs
- Service Catalogs
By Component:
- Solutions
- Services
- Managed Services
- Professional Services
By Deployment Type:
- On-premise
- Cloud
By Organization Size:
- Large Enterprises
- SMEs
By Vertical:
- BFSI
- Retail and E-Commerce
- Telecom
- IT
- Media and Entertainment
- Travel and Hospitality
- Others
By Region:
- North America
- Latin America
- Western Europe
- Eastern Europe
- Asia Pacific Excluding Japan (APEJ)
- Japan
- The Middle East & Africa (MEA)
Frequently Asked Questions
What is the Estimated Catalog Management System Market Value in 2023?
The global catalog management system market is estimated to be valued at US$ 1,650.1 million in 2023.
What is the Growth Outlook of the Global Catalog Management System Market?
The catalog management system market is likely to expand at a CAGR of 8.1% from 2023 to 2033.
What is the Projected Value of the Catalog Management System Market by 2033?
The catalog management system market is projected to reach a valuation of US$ 3,606.5 million by 2033.
Which Region Dominates the Global Catalog Management System Market?
North America is projected to lead the global catalog management system market by 2033.
Table of Content
1. Executive Summary 1.1. Global Market Outlook 1.2. Demand-side Trends 1.3. Supply-side Trends 1.4. Technology Roadmap Analysis 1.5. Analysis and Recommendations 2. Market Overview 2.1. Market Coverage / Taxonomy 2.2. Market Definition / Scope / Limitations 3. Market Background 3.1. Market Dynamics 3.1.1. Drivers 3.1.2. Restraints 3.1.3. Opportunity 3.1.4. Trends 3.2. Scenario Forecast 3.2.1. Demand in Optimistic Scenario 3.2.2. Demand in Likely Scenario 3.2.3. Demand in Conservative Scenario 3.3. Opportunity Map Analysis 3.4. Investment Feasibility Matrix 3.5. PESTLE and Porter’s Analysis 3.6. Regulatory Landscape 3.6.1. By Key Regions 3.6.2. By Key Countries 3.7. Regional Parent Market Outlook 4. Global Market Analysis 2018 to 2022 and Forecast, 2023 to 2033 4.1. Historical Market Size Value (US$ Million) Analysis, 2018 to 2022 4.2. Current and Future Market Size Value (US$ Million) Projections, 2023 to 2033 4.2.1. Y-o-Y Growth Trend Analysis 4.2.2. Absolute $ Opportunity Analysis 5. Global Market Analysis 2018 to 2022 and Forecast 2023 to 2033, By Type 5.1. Introduction / Key Findings 5.2. Historical Market Size Value (US$ Million) Analysis By Type, 2018 to 2022 5.3. Current and Future Market Size Value (US$ Million) Analysis and Forecast By Type, 2023 to 2033 5.3.1. Product Catalogs 5.3.2. Service Catalogs 5.4. Y-o-Y Growth Trend Analysis By Type, 2018 to 2022 5.5. Absolute $ Opportunity Analysis By Type, 2023 to 2033 6. Global Market Analysis 2018 to 2022 and Forecast 2023 to 2033, By Component 6.1. Introduction / Key Findings 6.2. Historical Market Size Value (US$ Million) Analysis By Component, 2018 to 2022 6.3. Current and Future Market Size Value (US$ Million) Analysis and Forecast By Component, 2023 to 2033 6.3.1. Solutions 6.3.2. Services 6.3.2.1. Managed Services 6.3.2.2. Professional Services 6.4. Y-o-Y Growth Trend Analysis By Component, 2018 to 2022 6.5. Absolute $ Opportunity Analysis By Component, 2023 to 2033 7. Global Market Analysis 2018 to 2022 and Forecast 2023 to 2033, By Deployment Type 7.1. Introduction / Key Findings 7.2. Historical Market Size Value (US$ Million) Analysis By Deployment Type , 2018 to 2022 7.3. Current and Future Market Size Value (US$ Million) Analysis and Forecast By Deployment Type , 2023 to 2033 7.3.1. On-premises 7.3.2. Cloud 7.4. Y-o-Y Growth Trend Analysis By Deployment Type , 2018 to 2022 7.5. Absolute $ Opportunity Analysis By Deployment Type , 2023 to 2033 8. Global Market Analysis 2018 to 2022 and Forecast 2023 to 2033, By Organization Size 8.1. Introduction / Key Findings 8.2. Historical Market Size Value (US$ Million) Analysis By Organization Size, 2018 to 2022 8.3. Current and Future Market Size Value (US$ Million) Analysis and Forecast By Organization Size, 2023 to 2033 8.3.1. Large Enterprises 8.3.2. SMEs 8.4. Y-o-Y Growth Trend Analysis By Organization Size, 2018 to 2022 8.5. Absolute $ Opportunity Analysis By Organization Size, 2023 to 2033 9. Global Market Analysis 2018 to 2022 and Forecast 2023 to 2033, By Vertical 9.1. Introduction / Key Findings 9.2. Historical Market Size Value (US$ Million) Analysis By Vertical, 2018 to 2022 9.3. Current and Future Market Size Value (US$ Million) Analysis and Forecast By Vertical, 2023 to 2033 9.3.1. BFSI 9.3.2. Retail and E-Commerce 9.3.3. Telecom 9.3.4. IT 9.3.5. Media and Entertainment 9.3.6. Travel and Hospitality 9.3.7. Others 9.4. Y-o-Y Growth Trend Analysis By Vertical, 2018 to 2022 9.5. Absolute $ Opportunity Analysis By Vertical, 2023 to 2033 10. Global Market Analysis 2018 to 2022 and Forecast 2023 to 2033, By Region 10.1. Introduction 10.2. Historical Market Size Value (US$ Million) Analysis By Region, 2018 to 2022 10.3. Current Market Size Value (US$ Million) Analysis and Forecast By Region, 2023 to 2033 10.3.1. North America 10.3.2. Latin America 10.3.3. Europe 10.3.4. South Asia 10.3.5. East Asia 10.3.6. Oceania 10.3.7. MEA 10.4. Market Attractiveness Analysis By Region 11. North America Market Analysis 2018 to 2022 and Forecast 2023 to 2033, By Country 11.1. Historical Market Size Value (US$ Million) Trend Analysis By Market Taxonomy, 2018 to 2022 11.2. Market Size Value (US$ Million) Forecast By Market Taxonomy, 2023 to 2033 11.2.1. By Country 11.2.1.1. U.S. 11.2.1.2. Canada 11.2.2. By Type 11.2.3. By Component 11.2.4. By Deployment Type 11.2.5. By Organization Size 11.2.6. By Vertical 11.3. Market Attractiveness Analysis 11.3.1. By Country 11.3.2. By Type 11.3.3. By Component 11.3.4. By Deployment Type 11.3.5. By Organization Size 11.3.6. By Vertical 11.4. Key Takeaways 12. Latin America Market Analysis 2018 to 2022 and Forecast 2023 to 2033, By Country 12.1. Historical Market Size Value (US$ Million) Trend Analysis By Market Taxonomy, 2018 to 2022 12.2. Market Size Value (US$ Million) Forecast By Market Taxonomy, 2023 to 2033 12.2.1. By Country 12.2.1.1. Brazil 12.2.1.2. Mexico 12.2.1.3. Rest of Latin America 12.2.2. By Type 12.2.3. By Component 12.2.4. By Deployment Type 12.2.5. By Organization Size 12.2.6. By Vertical 12.3. Market Attractiveness Analysis 12.3.1. By Country 12.3.2. By Type 12.3.3. By Component 12.3.4. By Deployment Type 12.3.5. By Organization Size 12.3.6. By Vertical 12.4. Key Takeaways 13. Europe Market Analysis 2018 to 2022 and Forecast 2023 to 2033, By Country 13.1. Historical Market Size Value (US$ Million) Trend Analysis By Market Taxonomy, 2018 to 2022 13.2. Market Size Value (US$ Million) Forecast By Market Taxonomy, 2023 to 2033 13.2.1. By Country 13.2.1.1. Germany 13.2.1.2. U.K. 13.2.1.3. France 13.2.1.4. Spain 13.2.1.5. Italy 13.2.1.6. Rest of Europe 13.2.2. By Type 13.2.3. By Component 13.2.4. By Deployment Type 13.2.5. By Organization Size 13.2.6. By Vertical 13.3. Market Attractiveness Analysis 13.3.1. By Country 13.3.2. By Type 13.3.3. By Component 13.3.4. By Deployment Type 13.3.5. By Organization Size 13.3.6. By Vertical 13.4. Key Takeaways 14. South Asia Market Analysis 2018 to 2022 and Forecast 2023 to 2033, By Country 14.1. Historical Market Size Value (US$ Million) Trend Analysis By Market Taxonomy, 2018 to 2022 14.2. Market Size Value (US$ Million) Forecast By Market Taxonomy, 2023 to 2033 14.2.1. By Country 14.2.1.1. India 14.2.1.2. Malaysia 14.2.1.3. Singapore 14.2.1.4. Thailand 14.2.1.5. Rest of South Asia 14.2.2. By Type 14.2.3. By Component 14.2.4. By Deployment Type 14.2.5. By Organization Size 14.2.6. By Vertical 14.3. Market Attractiveness Analysis 14.3.1. By Country 14.3.2. By Type 14.3.3. By Component 14.3.4. By Deployment Type 14.3.5. By Organization Size 14.3.6. By Vertical 14.4. Key Takeaways 15. East Asia Market Analysis 2018 to 2022 and Forecast 2023 to 2033, By Country 15.1. Historical Market Size Value (US$ Million) Trend Analysis By Market Taxonomy, 2018 to 2022 15.2. Market Size Value (US$ Million) Forecast By Market Taxonomy, 2023 to 2033 15.2.1. By Country 15.2.1.1. China 15.2.1.2. Japan 15.2.1.3. South Korea 15.2.2. By Type 15.2.3. By Component 15.2.4. By Deployment Type 15.2.5. By Organization Size 15.2.6. By Vertical 15.3. Market Attractiveness Analysis 15.3.1. By Country 15.3.2. By Type 15.3.3. By Component 15.3.4. By Deployment Type 15.3.5. By Organization Size 15.3.6. By Vertical 15.4. Key Takeaways 16. Oceania Market Analysis 2018 to 2022 and Forecast 2023 to 2033, By Country 16.1. Historical Market Size Value (US$ Million) Trend Analysis By Market Taxonomy, 2018 to 2022 16.2. Market Size Value (US$ Million) Forecast By Market Taxonomy, 2023 to 2033 16.2.1. By Country 16.2.1.1. Australia 16.2.1.2. New Zealand 16.2.2. By Type 16.2.3. By Component 16.2.4. By Deployment Type 16.2.5. By Organization Size 16.2.6. By Vertical 16.3. Market Attractiveness Analysis 16.3.1. By Country 16.3.2. By Type 16.3.3. By Component 16.3.4. By Deployment Type 16.3.5. By Organization Size 16.3.6. By Vertical 16.4. Key Takeaways 17. MEA Market Analysis 2018 to 2022 and Forecast 2023 to 2033, By Country 17.1. Historical Market Size Value (US$ Million) Trend Analysis By Market Taxonomy, 2018 to 2022 17.2. Market Size Value (US$ Million) Forecast By Market Taxonomy, 2023 to 2033 17.2.1. By Country 17.2.1.1. GCC Countries 17.2.1.2. South Africa 17.2.1.3. Israel 17.2.1.4. Rest of MEA 17.2.2. By Type 17.2.3. By Component 17.2.4. By Deployment Type 17.2.5. By Organization Size 17.2.6. By Vertical 17.3. Market Attractiveness Analysis 17.3.1. By Country 17.3.2. By Type 17.3.3. By Component 17.3.4. By Deployment Type 17.3.5. By Organization Size 17.3.6. By Vertical 17.4. Key Takeaways 18. Key Countries Market Analysis 18.1. U.S. 18.1.1. Pricing Analysis 18.1.2. Market Share Analysis, 2022 18.1.2.1. By Type 18.1.2.2. By Component 18.1.2.3. By Deployment Type 18.1.2.4. By Organization Size 18.1.2.5. By Vertical 18.2. Canada 18.2.1. Pricing Analysis 18.2.2. Market Share Analysis, 2022 18.2.2.1. By Type 18.2.2.2. By Component 18.2.2.3. By Deployment Type 18.2.2.4. By Organization Size 18.2.2.5. By Vertical 18.3. Brazil 18.3.1. Pricing Analysis 18.3.2. Market Share Analysis, 2022 18.3.2.1. By Type 18.3.2.2. By Component 18.3.2.3. By Deployment Type 18.3.2.4. By Organization Size 18.3.2.5. By Vertical 18.4. Mexico 18.4.1. Pricing Analysis 18.4.2. Market Share Analysis, 2022 18.4.2.1. By Type 18.4.2.2. By Component 18.4.2.3. By Deployment Type 18.4.2.4. By Organization Size 18.4.2.5. By Vertical 18.5. Germany 18.5.1. Pricing Analysis 18.5.2. Market Share Analysis, 2022 18.5.2.1. By Type 18.5.2.2. By Component 18.5.2.3. By Deployment Type 18.5.2.4. By Organization Size 18.5.2.5. By Vertical 18.6. U.K. 18.6.1. Pricing Analysis 18.6.2. Market Share Analysis, 2022 18.6.2.1. By Type 18.6.2.2. By Component 18.6.2.3. By Deployment Type 18.6.2.4. By Organization Size 18.6.2.5. By Vertical 18.7. France 18.7.1. Pricing Analysis 18.7.2. Market Share Analysis, 2022 18.7.2.1. By Type 18.7.2.2. By Component 18.7.2.3. By Deployment Type 18.7.2.4. By Organization Size 18.7.2.5. By Vertical 18.8. Spain 18.8.1. Pricing Analysis 18.8.2. Market Share Analysis, 2022 18.8.2.1. By Type 18.8.2.2. By Component 18.8.2.3. By Deployment Type 18.8.2.4. By Organization Size 18.8.2.5. By Vertical 18.9. Italy 18.9.1. Pricing Analysis 18.9.2. Market Share Analysis, 2022 18.9.2.1. By Type 18.9.2.2. By Component 18.9.2.3. By Deployment Type 18.9.2.4. By Organization Size 18.9.2.5. By Vertical 18.10. India 18.10.1. Pricing Analysis 18.10.2. Market Share Analysis, 2022 18.10.2.1. By Type 18.10.2.2. By Component 18.10.2.3. By Deployment Type 18.10.2.4. By Organization Size 18.10.2.5. By Vertical 18.11. Malaysia 18.11.1. Pricing Analysis 18.11.2. Market Share Analysis, 2022 18.11.2.1. By Type 18.11.2.2. By Component 18.11.2.3. By Deployment Type 18.11.2.4. By Organization Size 18.11.2.5. By Vertical 18.12. Singapore 18.12.1. Pricing Analysis 18.12.2. Market Share Analysis, 2022 18.12.2.1. By Type 18.12.2.2. By Component 18.12.2.3. By Deployment Type 18.12.2.4. By Organization Size 18.12.2.5. By Vertical 18.13. Thailand 18.13.1. Pricing Analysis 18.13.2. Market Share Analysis, 2022 18.13.2.1. By Type 18.13.2.2. By Component 18.13.2.3. By Deployment Type 18.13.2.4. By Organization Size 18.13.2.5. By Vertical 18.14. China 18.14.1. Pricing Analysis 18.14.2. Market Share Analysis, 2022 18.14.2.1. By Type 18.14.2.2. By Component 18.14.2.3. By Deployment Type 18.14.2.4. By Organization Size 18.14.2.5. By Vertical 18.15. Japan 18.15.1. Pricing Analysis 18.15.2. Market Share Analysis, 2022 18.15.2.1. By Type 18.15.2.2. By Component 18.15.2.3. By Deployment Type 18.15.2.4. By Organization Size 18.15.2.5. By Vertical 18.16. South Korea 18.16.1. Pricing Analysis 18.16.2. Market Share Analysis, 2022 18.16.2.1. By Type 18.16.2.2. By Component 18.16.2.3. By Deployment Type 18.16.2.4. By Organization Size 18.16.2.5. By Vertical 18.17. Australia 18.17.1. Pricing Analysis 18.17.2. Market Share Analysis, 2022 18.17.2.1. By Type 18.17.2.2. By Component 18.17.2.3. By Deployment Type 18.17.2.4. By Organization Size 18.17.2.5. By Vertical 18.18. New Zealand 18.18.1. Pricing Analysis 18.18.2. Market Share Analysis, 2022 18.18.2.1. By Type 18.18.2.2. By Component 18.18.2.3. By Deployment Type 18.18.2.4. By Organization Size 18.18.2.5. By Vertical 18.19. GCC Countries 18.19.1. Pricing Analysis 18.19.2. Market Share Analysis, 2022 18.19.2.1. By Type 18.19.2.2. By Component 18.19.2.3. By Deployment Type 18.19.2.4. By Organization Size 18.19.2.5. By Vertical 18.20. South Africa 18.20.1. Pricing Analysis 18.20.2. Market Share Analysis, 2022 18.20.2.1. By Type 18.20.2.2. By Component 18.20.2.3. By Deployment Type 18.20.2.4. By Organization Size 18.20.2.5. By Vertical 18.21. Israel 18.21.1. Pricing Analysis 18.21.2. Market Share Analysis, 2022 18.21.2.1. By Type 18.21.2.2. By Component 18.21.2.3. By Deployment Type 18.21.2.4. By Organization Size 18.21.2.5. By Vertical 19. Market Structure Analysis 19.1. Competition Dashboard 19.2. Competition Benchmarking 19.3. Market Share Analysis of Top Players 19.3.1. By Regional 19.3.2. By Type 19.3.3. By Component 19.3.4. By Deployment Type 19.3.5. By Organization Size 19.3.6. By Vertical 20. Competition Analysis 20.1. Competition Deep Dive 20.1.1. IBM 20.1.1.1. Overview 20.1.1.2. Product Portfolio 20.1.1.3. Profitability by Market Segments 20.1.1.4. Sales Footprint 20.1.1.5. Strategy Overview 20.1.1.5.1. Marketing Strategy 20.1.2. ORACLE 20.1.2.1. Overview 20.1.2.2. Product Portfolio 20.1.2.3. Profitability by Market Segments 20.1.2.4. Sales Footprint 20.1.2.5. Strategy Overview 20.1.2.5.1. Marketing Strategy 20.1.3. SAP 20.1.3.1. Overview 20.1.3.2. Product Portfolio 20.1.3.3. Profitability by Market Segments 20.1.3.4. Sales Footprint 20.1.3.5. Strategy Overview 20.1.3.5.1. Marketing Strategy 20.1.4. ServiceNow 20.1.4.1. Overview 20.1.4.2. Product Portfolio 20.1.4.3. Profitability by Market Segments 20.1.4.4. Sales Footprint 20.1.4.5. Strategy Overview 20.1.4.5.1. Marketing Strategy 20.1.5. Fujitsu 20.1.5.1. Overview 20.1.5.2. Product Portfolio 20.1.5.3. Profitability by Market Segments 20.1.5.4. Sales Footprint 20.1.5.5. Strategy Overview 20.1.5.5.1. Marketing Strategy 20.1.6. Coupa Software Inc. 20.1.6.1. Overview 20.1.6.2. Product Portfolio 20.1.6.3. Profitability by Market Segments 20.1.6.4. Sales Footprint 20.1.6.5. Strategy Overview 20.1.6.5.1. Marketing Strategy 20.1.7. Zycus Inc. 20.1.7.1. Overview 20.1.7.2. Product Portfolio 20.1.7.3. Profitability by Market Segments 20.1.7.4. Sales Footprint 20.1.7.5. Strategy Overview 20.1.7.5.1. Marketing Strategy 20.1.8. Informatica LLC 20.1.8.1. Overview 20.1.8.2. Product Portfolio 20.1.8.3. Profitability by Market Segments 20.1.8.4. Sales Footprint 20.1.8.5. Strategy Overview 20.1.8.5.1. Marketing Strategy 20.1.9. Salsify Inc. 20.1.9.1. Overview 20.1.9.2. Product Portfolio 20.1.9.3. Profitability by Market Segments 20.1.9.4. Sales Footprint 20.1.9.5. Strategy Overview 20.1.9.5.1. Marketing Strategy 20.1.10. Vinculum Solutions Pvt. Ltd 20.1.10.1. Overview 20.1.10.2. Product Portfolio 20.1.10.3. Profitability by Market Segments 20.1.10.4. Sales Footprint 20.1.10.5. Strategy Overview 20.1.10.5.1. Marketing Strategy 21. Assumptions & Acronyms Used 22. Research Methodology
Don't pay for what you don't need
Customize your report by selecting specific countries or regions and save 30%!
List of Tables
Table 1: Global Market Value (US$ Million) Forecast by Region, 2018 to 2033 Table 2: Global Market Value (US$ Million) Forecast by Type, 2018 to 2033 Table 3: Global Market Value (US$ Million) Forecast by Component, 2018 to 2033 Table 4: Global Market Value (US$ Million) Forecast by Deployment Type , 2018 to 2033 Table 5: Global Market Value (US$ Million) Forecast by Organization Size, 2018 to 2033 Table 6: Global Market Value (US$ Million) Forecast by Vertical, 2018 to 2033 Table 7: North America Market Value (US$ Million) Forecast by Country, 2018 to 2033 Table 8: North America Market Value (US$ Million) Forecast by Type, 2018 to 2033 Table 9: North America Market Value (US$ Million) Forecast by Component, 2018 to 2033 Table 10: North America Market Value (US$ Million) Forecast by Deployment Type , 2018 to 2033 Table 11: North America Market Value (US$ Million) Forecast by Organization Size, 2018 to 2033 Table 12: North America Market Value (US$ Million) Forecast by Vertical, 2018 to 2033 Table 13: Latin America Market Value (US$ Million) Forecast by Country, 2018 to 2033 Table 14: Latin America Market Value (US$ Million) Forecast by Type, 2018 to 2033 Table 15: Latin America Market Value (US$ Million) Forecast by Component, 2018 to 2033 Table 16: Latin America Market Value (US$ Million) Forecast by Deployment Type , 2018 to 2033 Table 17: Latin America Market Value (US$ Million) Forecast by Organization Size, 2018 to 2033 Table 18: Latin America Market Value (US$ Million) Forecast by Vertical, 2018 to 2033 Table 19: Europe Market Value (US$ Million) Forecast by Country, 2018 to 2033 Table 20: Europe Market Value (US$ Million) Forecast by Type, 2018 to 2033 Table 21: Europe Market Value (US$ Million) Forecast by Component, 2018 to 2033 Table 22: Europe Market Value (US$ Million) Forecast by Deployment Type , 2018 to 2033 Table 23: Europe Market Value (US$ Million) Forecast by Organization Size, 2018 to 2033 Table 24: Europe Market Value (US$ Million) Forecast by Vertical, 2018 to 2033 Table 25: South Asia Market Value (US$ Million) Forecast by Country, 2018 to 2033 Table 26: South Asia Market Value (US$ Million) Forecast by Type, 2018 to 2033 Table 27: South Asia Market Value (US$ Million) Forecast by Component, 2018 to 2033 Table 28: South Asia Market Value (US$ Million) Forecast by Deployment Type , 2018 to 2033 Table 29: South Asia Market Value (US$ Million) Forecast by Organization Size, 2018 to 2033 Table 30: South Asia Market Value (US$ Million) Forecast by Vertical, 2018 to 2033 Table 31: East Asia Market Value (US$ Million) Forecast by Country, 2018 to 2033 Table 32: East Asia Market Value (US$ Million) Forecast by Type, 2018 to 2033 Table 33: East Asia Market Value (US$ Million) Forecast by Component, 2018 to 2033 Table 34: East Asia Market Value (US$ Million) Forecast by Deployment Type , 2018 to 2033 Table 35: East Asia Market Value (US$ Million) Forecast by Organization Size, 2018 to 2033 Table 36: East Asia Market Value (US$ Million) Forecast by Vertical, 2018 to 2033 Table 37: Oceania Market Value (US$ Million) Forecast by Country, 2018 to 2033 Table 38: Oceania Market Value (US$ Million) Forecast by Type, 2018 to 2033 Table 39: Oceania Market Value (US$ Million) Forecast by Component, 2018 to 2033 Table 40: Oceania Market Value (US$ Million) Forecast by Deployment Type , 2018 to 2033 Table 41: Oceania Market Value (US$ Million) Forecast by Organization Size, 2018 to 2033 Table 42: Oceania Market Value (US$ Million) Forecast by Vertical, 2018 to 2033 Table 43: MEA Market Value (US$ Million) Forecast by Country, 2018 to 2033 Table 44: MEA Market Value (US$ Million) Forecast by Type, 2018 to 2033 Table 45: MEA Market Value (US$ Million) Forecast by Component, 2018 to 2033 Table 46: MEA Market Value (US$ Million) Forecast by Deployment Type , 2018 to 2033 Table 47: MEA Market Value (US$ Million) Forecast by Organization Size, 2018 to 2033 Table 48: MEA Market Value (US$ Million) Forecast by Vertical, 2018 to 2033
Find your sweet spots for generating winning opportunities in this market.
Talk to AnalystList of Charts
Figure 1: Global Market Value (US$ Million) by Type, 2023 to 2033 Figure 2: Global Market Value (US$ Million) by Component, 2023 to 2033 Figure 3: Global Market Value (US$ Million) by Deployment Type , 2023 to 2033 Figure 4: Global Market Value (US$ Million) by Organization Size, 2023 to 2033 Figure 5: Global Market Value (US$ Million) by Vertical, 2023 to 2033 Figure 6: Global Market Value (US$ Million) by Region, 2023 to 2033 Figure 7: Global Market Value (US$ Million) Analysis by Region, 2018 to 2033 Figure 8: Global Market Value Share (%) and BPS Analysis by Region, 2023 to 2033 Figure 9: Global Market Y-o-Y Growth (%) Projections by Region, 2023 to 2033 Figure 10: Global Market Value (US$ Million) Analysis by Type, 2018 to 2033 Figure 11: Global Market Value Share (%) and BPS Analysis by Type, 2023 to 2033 Figure 12: Global Market Y-o-Y Growth (%) Projections by Type, 2023 to 2033 Figure 13: Global Market Value (US$ Million) Analysis by Component, 2018 to 2033 Figure 14: Global Market Value Share (%) and BPS Analysis by Component, 2023 to 2033 Figure 15: Global Market Y-o-Y Growth (%) Projections by Component, 2023 to 2033 Figure 16: Global Market Value (US$ Million) Analysis by Deployment Type , 2018 to 2033 Figure 17: Global Market Value Share (%) and BPS Analysis by Deployment Type , 2023 to 2033 Figure 18: Global Market Y-o-Y Growth (%) Projections by Deployment Type , 2023 to 2033 Figure 19: Global Market Value (US$ Million) Analysis by Organization Size, 2018 to 2033 Figure 20: Global Market Value Share (%) and BPS Analysis by Organization Size, 2023 to 2033 Figure 21: Global Market Y-o-Y Growth (%) Projections by Organization Size, 2023 to 2033 Figure 22: Global Market Value (US$ Million) Analysis by Vertical, 2018 to 2033 Figure 23: Global Market Value Share (%) and BPS Analysis by Vertical, 2023 to 2033 Figure 24: Global Market Y-o-Y Growth (%) Projections by Vertical, 2023 to 2033 Figure 25: Global Market Attractiveness by Type, 2023 to 2033 Figure 26: Global Market Attractiveness by Component, 2023 to 2033 Figure 27: Global Market Attractiveness by Deployment Type , 2023 to 2033 Figure 28: Global Market Attractiveness by Organization Size, 2023 to 2033 Figure 29: Global Market Attractiveness by Vertical, 2023 to 2033 Figure 30: Global Market Attractiveness by Region, 2023 to 2033 Figure 31: North America Market Value (US$ Million) by Type, 2023 to 2033 Figure 32: North America Market Value (US$ Million) by Component, 2023 to 2033 Figure 33: North America Market Value (US$ Million) by Deployment Type , 2023 to 2033 Figure 34: North America Market Value (US$ Million) by Organization Size, 2023 to 2033 Figure 35: North America Market Value (US$ Million) by Vertical, 2023 to 2033 Figure 36: North America Market Value (US$ Million) by Country, 2023 to 2033 Figure 37: North America Market Value (US$ Million) Analysis by Country, 2018 to 2033 Figure 38: North America Market Value Share (%) and BPS Analysis by Country, 2023 to 2033 Figure 39: North America Market Y-o-Y Growth (%) Projections by Country, 2023 to 2033 Figure 40: North America Market Value (US$ Million) Analysis by Type, 2018 to 2033 Figure 41: North America Market Value Share (%) and BPS Analysis by Type, 2023 to 2033 Figure 42: North America Market Y-o-Y Growth (%) Projections by Type, 2023 to 2033 Figure 43: North America Market Value (US$ Million) Analysis by Component, 2018 to 2033 Figure 44: North America Market Value Share (%) and BPS Analysis by Component, 2023 to 2033 Figure 45: North America Market Y-o-Y Growth (%) Projections by Component, 2023 to 2033 Figure 46: North America Market Value (US$ Million) Analysis by Deployment Type , 2018 to 2033 Figure 47: North America Market Value Share (%) and BPS Analysis by Deployment Type , 2023 to 2033 Figure 48: North America Market Y-o-Y Growth (%) Projections by Deployment Type , 2023 to 2033 Figure 49: North America Market Value (US$ Million) Analysis by Organization Size, 2018 to 2033 Figure 50: North America Market Value Share (%) and BPS Analysis by Organization Size, 2023 to 2033 Figure 51: North America Market Y-o-Y Growth (%) Projections by Organization Size, 2023 to 2033 Figure 52: North America Market Value (US$ Million) Analysis by Vertical, 2018 to 2033 Figure 53: North America Market Value Share (%) and BPS Analysis by Vertical, 2023 to 2033 Figure 54: North America Market Y-o-Y Growth (%) Projections by Vertical, 2023 to 2033 Figure 55: North America Market Attractiveness by Type, 2023 to 2033 Figure 56: North America Market Attractiveness by Component, 2023 to 2033 Figure 57: North America Market Attractiveness by Deployment Type , 2023 to 2033 Figure 58: North America Market Attractiveness by Organization Size, 2023 to 2033 Figure 59: North America Market Attractiveness by Vertical, 2023 to 2033 Figure 60: North America Market Attractiveness by Country, 2023 to 2033 Figure 61: Latin America Market Value (US$ Million) by Type, 2023 to 2033 Figure 62: Latin America Market Value (US$ Million) by Component, 2023 to 2033 Figure 63: Latin America Market Value (US$ Million) by Deployment Type , 2023 to 2033 Figure 64: Latin America Market Value (US$ Million) by Organization Size, 2023 to 2033 Figure 65: Latin America Market Value (US$ Million) by Vertical, 2023 to 2033 Figure 66: Latin America Market Value (US$ Million) by Country, 2023 to 2033 Figure 67: Latin America Market Value (US$ Million) Analysis by Country, 2018 to 2033 Figure 68: Latin America Market Value Share (%) and BPS Analysis by Country, 2023 to 2033 Figure 69: Latin America Market Y-o-Y Growth (%) Projections by Country, 2023 to 2033 Figure 70: Latin America Market Value (US$ Million) Analysis by Type, 2018 to 2033 Figure 71: Latin America Market Value Share (%) and BPS Analysis by Type, 2023 to 2033 Figure 72: Latin America Market Y-o-Y Growth (%) Projections by Type, 2023 to 2033 Figure 73: Latin America Market Value (US$ Million) Analysis by Component, 2018 to 2033 Figure 74: Latin America Market Value Share (%) and BPS Analysis by Component, 2023 to 2033 Figure 75: Latin America Market Y-o-Y Growth (%) Projections by Component, 2023 to 2033 Figure 76: Latin America Market Value (US$ Million) Analysis by Deployment Type , 2018 to 2033 Figure 77: Latin America Market Value Share (%) and BPS Analysis by Deployment Type , 2023 to 2033 Figure 78: Latin America Market Y-o-Y Growth (%) Projections by Deployment Type , 2023 to 2033 Figure 79: Latin America Market Value (US$ Million) Analysis by Organization Size, 2018 to 2033 Figure 80: Latin America Market Value Share (%) and BPS Analysis by Organization Size, 2023 to 2033 Figure 81: Latin America Market Y-o-Y Growth (%) Projections by Organization Size, 2023 to 2033 Figure 82: Latin America Market Value (US$ Million) Analysis by Vertical, 2018 to 2033 Figure 83: Latin America Market Value Share (%) and BPS Analysis by Vertical, 2023 to 2033 Figure 84: Latin America Market Y-o-Y Growth (%) Projections by Vertical, 2023 to 2033 Figure 85: Latin America Market Attractiveness by Type, 2023 to 2033 Figure 86: Latin America Market Attractiveness by Component, 2023 to 2033 Figure 87: Latin America Market Attractiveness by Deployment Type , 2023 to 2033 Figure 88: Latin America Market Attractiveness by Organization Size, 2023 to 2033 Figure 89: Latin America Market Attractiveness by Vertical, 2023 to 2033 Figure 90: Latin America Market Attractiveness by Country, 2023 to 2033 Figure 91: Europe Market Value (US$ Million) by Type, 2023 to 2033 Figure 92: Europe Market Value (US$ Million) by Component, 2023 to 2033 Figure 93: Europe Market Value (US$ Million) by Deployment Type , 2023 to 2033 Figure 94: Europe Market Value (US$ Million) by Organization Size, 2023 to 2033 Figure 95: Europe Market Value (US$ Million) by Vertical, 2023 to 2033 Figure 96: Europe Market Value (US$ Million) by Country, 2023 to 2033 Figure 97: Europe Market Value (US$ Million) Analysis by Country, 2018 to 2033 Figure 98: Europe Market Value Share (%) and BPS Analysis by Country, 2023 to 2033 Figure 99: Europe Market Y-o-Y Growth (%) Projections by Country, 2023 to 2033 Figure 100: Europe Market Value (US$ Million) Analysis by Type, 2018 to 2033 Figure 101: Europe Market Value Share (%) and BPS Analysis by Type, 2023 to 2033 Figure 102: Europe Market Y-o-Y Growth (%) Projections by Type, 2023 to 2033 Figure 103: Europe Market Value (US$ Million) Analysis by Component, 2018 to 2033 Figure 104: Europe Market Value Share (%) and BPS Analysis by Component, 2023 to 2033 Figure 105: Europe Market Y-o-Y Growth (%) Projections by Component, 2023 to 2033 Figure 106: Europe Market Value (US$ Million) Analysis by Deployment Type , 2018 to 2033 Figure 107: Europe Market Value Share (%) and BPS Analysis by Deployment Type , 2023 to 2033 Figure 108: Europe Market Y-o-Y Growth (%) Projections by Deployment Type , 2023 to 2033 Figure 109: Europe Market Value (US$ Million) Analysis by Organization Size, 2018 to 2033 Figure 110: Europe Market Value Share (%) and BPS Analysis by Organization Size, 2023 to 2033 Figure 111: Europe Market Y-o-Y Growth (%) Projections by Organization Size, 2023 to 2033 Figure 112: Europe Market Value (US$ Million) Analysis by Vertical, 2018 to 2033 Figure 113: Europe Market Value Share (%) and BPS Analysis by Vertical, 2023 to 2033 Figure 114: Europe Market Y-o-Y Growth (%) Projections by Vertical, 2023 to 2033 Figure 115: Europe Market Attractiveness by Type, 2023 to 2033 Figure 116: Europe Market Attractiveness by Component, 2023 to 2033 Figure 117: Europe Market Attractiveness by Deployment Type , 2023 to 2033 Figure 118: Europe Market Attractiveness by Organization Size, 2023 to 2033 Figure 119: Europe Market Attractiveness by Vertical, 2023 to 2033 Figure 120: Europe Market Attractiveness by Country, 2023 to 2033 Figure 121: South Asia Market Value (US$ Million) by Type, 2023 to 2033 Figure 122: South Asia Market Value (US$ Million) by Component, 2023 to 2033 Figure 123: South Asia Market Value (US$ Million) by Deployment Type , 2023 to 2033 Figure 124: South Asia Market Value (US$ Million) by Organization Size, 2023 to 2033 Figure 125: South Asia Market Value (US$ Million) by Vertical, 2023 to 2033 Figure 126: South Asia Market Value (US$ Million) by Country, 2023 to 2033 Figure 127: South Asia Market Value (US$ Million) Analysis by Country, 2018 to 2033 Figure 128: South Asia Market Value Share (%) and BPS Analysis by Country, 2023 to 2033 Figure 129: South Asia Market Y-o-Y Growth (%) Projections by Country, 2023 to 2033 Figure 130: South Asia Market Value (US$ Million) Analysis by Type, 2018 to 2033 Figure 131: South Asia Market Value Share (%) and BPS Analysis by Type, 2023 to 2033 Figure 132: South Asia Market Y-o-Y Growth (%) Projections by Type, 2023 to 2033 Figure 133: South Asia Market Value (US$ Million) Analysis by Component, 2018 to 2033 Figure 134: South Asia Market Value Share (%) and BPS Analysis by Component, 2023 to 2033 Figure 135: South Asia Market Y-o-Y Growth (%) Projections by Component, 2023 to 2033 Figure 136: South Asia Market Value (US$ Million) Analysis by Deployment Type , 2018 to 2033 Figure 137: South Asia Market Value Share (%) and BPS Analysis by Deployment Type , 2023 to 2033 Figure 138: South Asia Market Y-o-Y Growth (%) Projections by Deployment Type , 2023 to 2033 Figure 139: South Asia Market Value (US$ Million) Analysis by Organization Size, 2018 to 2033 Figure 140: South Asia Market Value Share (%) and BPS Analysis by Organization Size, 2023 to 2033 Figure 141: South Asia Market Y-o-Y Growth (%) Projections by Organization Size, 2023 to 2033 Figure 142: South Asia Market Value (US$ Million) Analysis by Vertical, 2018 to 2033 Figure 143: South Asia Market Value Share (%) and BPS Analysis by Vertical, 2023 to 2033 Figure 144: South Asia Market Y-o-Y Growth (%) Projections by Vertical, 2023 to 2033 Figure 145: South Asia Market Attractiveness by Type, 2023 to 2033 Figure 146: South Asia Market Attractiveness by Component, 2023 to 2033 Figure 147: South Asia Market Attractiveness by Deployment Type , 2023 to 2033 Figure 148: South Asia Market Attractiveness by Organization Size, 2023 to 2033 Figure 149: South Asia Market Attractiveness by Vertical, 2023 to 2033 Figure 150: South Asia Market Attractiveness by Country, 2023 to 2033 Figure 151: East Asia Market Value (US$ Million) by Type, 2023 to 2033 Figure 152: East Asia Market Value (US$ Million) by Component, 2023 to 2033 Figure 153: East Asia Market Value (US$ Million) by Deployment Type , 2023 to 2033 Figure 154: East Asia Market Value (US$ Million) by Organization Size, 2023 to 2033 Figure 155: East Asia Market Value (US$ Million) by Vertical, 2023 to 2033 Figure 156: East Asia Market Value (US$ Million) by Country, 2023 to 2033 Figure 157: East Asia Market Value (US$ Million) Analysis by Country, 2018 to 2033 Figure 158: East Asia Market Value Share (%) and BPS Analysis by Country, 2023 to 2033 Figure 159: East Asia Market Y-o-Y Growth (%) Projections by Country, 2023 to 2033 Figure 160: East Asia Market Value (US$ Million) Analysis by Type, 2018 to 2033 Figure 161: East Asia Market Value Share (%) and BPS Analysis by Type, 2023 to 2033 Figure 162: East Asia Market Y-o-Y Growth (%) Projections by Type, 2023 to 2033 Figure 163: East Asia Market Value (US$ Million) Analysis by Component, 2018 to 2033 Figure 164: East Asia Market Value Share (%) and BPS Analysis by Component, 2023 to 2033 Figure 165: East Asia Market Y-o-Y Growth (%) Projections by Component, 2023 to 2033 Figure 166: East Asia Market Value (US$ Million) Analysis by Deployment Type , 2018 to 2033 Figure 167: East Asia Market Value Share (%) and BPS Analysis by Deployment Type , 2023 to 2033 Figure 168: East Asia Market Y-o-Y Growth (%) Projections by Deployment Type , 2023 to 2033 Figure 169: East Asia Market Value (US$ Million) Analysis by Organization Size, 2018 to 2033 Figure 170: East Asia Market Value Share (%) and BPS Analysis by Organization Size, 2023 to 2033 Figure 171: East Asia Market Y-o-Y Growth (%) Projections by Organization Size, 2023 to 2033 Figure 172: East Asia Market Value (US$ Million) Analysis by Vertical, 2018 to 2033 Figure 173: East Asia Market Value Share (%) and BPS Analysis by Vertical, 2023 to 2033 Figure 174: East Asia Market Y-o-Y Growth (%) Projections by Vertical, 2023 to 2033 Figure 175: East Asia Market Attractiveness by Type, 2023 to 2033 Figure 176: East Asia Market Attractiveness by Component, 2023 to 2033 Figure 177: East Asia Market Attractiveness by Deployment Type , 2023 to 2033 Figure 178: East Asia Market Attractiveness by Organization Size, 2023 to 2033 Figure 179: East Asia Market Attractiveness by Vertical, 2023 to 2033 Figure 180: East Asia Market Attractiveness by Country, 2023 to 2033 Figure 181: Oceania Market Value (US$ Million) by Type, 2023 to 2033 Figure 182: Oceania Market Value (US$ Million) by Component, 2023 to 2033 Figure 183: Oceania Market Value (US$ Million) by Deployment Type , 2023 to 2033 Figure 184: Oceania Market Value (US$ Million) by Organization Size, 2023 to 2033 Figure 185: Oceania Market Value (US$ Million) by Vertical, 2023 to 2033 Figure 186: Oceania Market Value (US$ Million) by Country, 2023 to 2033 Figure 187: Oceania Market Value (US$ Million) Analysis by Country, 2018 to 2033 Figure 188: Oceania Market Value Share (%) and BPS Analysis by Country, 2023 to 2033 Figure 189: Oceania Market Y-o-Y Growth (%) Projections by Country, 2023 to 2033 Figure 190: Oceania Market Value (US$ Million) Analysis by Type, 2018 to 2033 Figure 191: Oceania Market Value Share (%) and BPS Analysis by Type, 2023 to 2033 Figure 192: Oceania Market Y-o-Y Growth (%) Projections by Type, 2023 to 2033 Figure 193: Oceania Market Value (US$ Million) Analysis by Component, 2018 to 2033 Figure 194: Oceania Market Value Share (%) and BPS Analysis by Component, 2023 to 2033 Figure 195: Oceania Market Y-o-Y Growth (%) Projections by Component, 2023 to 2033 Figure 196: Oceania Market Value (US$ Million) Analysis by Deployment Type , 2018 to 2033 Figure 197: Oceania Market Value Share (%) and BPS Analysis by Deployment Type , 2023 to 2033 Figure 198: Oceania Market Y-o-Y Growth (%) Projections by Deployment Type , 2023 to 2033 Figure 199: Oceania Market Value (US$ Million) Analysis by Organization Size, 2018 to 2033 Figure 200: Oceania Market Value Share (%) and BPS Analysis by Organization Size, 2023 to 2033 Figure 201: Oceania Market Y-o-Y Growth (%) Projections by Organization Size, 2023 to 2033 Figure 202: Oceania Market Value (US$ Million) Analysis by Vertical, 2018 to 2033 Figure 203: Oceania Market Value Share (%) and BPS Analysis by Vertical, 2023 to 2033 Figure 204: Oceania Market Y-o-Y Growth (%) Projections by Vertical, 2023 to 2033 Figure 205: Oceania Market Attractiveness by Type, 2023 to 2033 Figure 206: Oceania Market Attractiveness by Component, 2023 to 2033 Figure 207: Oceania Market Attractiveness by Deployment Type , 2023 to 2033 Figure 208: Oceania Market Attractiveness by Organization Size, 2023 to 2033 Figure 209: Oceania Market Attractiveness by Vertical, 2023 to 2033 Figure 210: Oceania Market Attractiveness by Country, 2023 to 2033 Figure 211: MEA Market Value (US$ Million) by Type, 2023 to 2033 Figure 212: MEA Market Value (US$ Million) by Component, 2023 to 2033 Figure 213: MEA Market Value (US$ Million) by Deployment Type , 2023 to 2033 Figure 214: MEA Market Value (US$ Million) by Organization Size, 2023 to 2033 Figure 215: MEA Market Value (US$ Million) by Vertical, 2023 to 2033 Figure 216: MEA Market Value (US$ Million) by Country, 2023 to 2033 Figure 217: MEA Market Value (US$ Million) Analysis by Country, 2018 to 2033 Figure 218: MEA Market Value Share (%) and BPS Analysis by Country, 2023 to 2033 Figure 219: MEA Market Y-o-Y Growth (%) Projections by Country, 2023 to 2033 Figure 220: MEA Market Value (US$ Million) Analysis by Type, 2018 to 2033 Figure 221: MEA Market Value Share (%) and BPS Analysis by Type, 2023 to 2033 Figure 222: MEA Market Y-o-Y Growth (%) Projections by Type, 2023 to 2033 Figure 223: MEA Market Value (US$ Million) Analysis by Component, 2018 to 2033 Figure 224: MEA Market Value Share (%) and BPS Analysis by Component, 2023 to 2033 Figure 225: MEA Market Y-o-Y Growth (%) Projections by Component, 2023 to 2033 Figure 226: MEA Market Value (US$ Million) Analysis by Deployment Type , 2018 to 2033 Figure 227: MEA Market Value Share (%) and BPS Analysis by Deployment Type , 2023 to 2033 Figure 228: MEA Market Y-o-Y Growth (%) Projections by Deployment Type , 2023 to 2033 Figure 229: MEA Market Value (US$ Million) Analysis by Organization Size, 2018 to 2033 Figure 230: MEA Market Value Share (%) and BPS Analysis by Organization Size, 2023 to 2033 Figure 231: MEA Market Y-o-Y Growth (%) Projections by Organization Size, 2023 to 2033 Figure 232: MEA Market Value (US$ Million) Analysis by Vertical, 2018 to 2033 Figure 233: MEA Market Value Share (%) and BPS Analysis by Vertical, 2023 to 2033 Figure 234: MEA Market Y-o-Y Growth (%) Projections by Vertical, 2023 to 2033 Figure 235: MEA Market Attractiveness by Type, 2023 to 2033 Figure 236: MEA Market Attractiveness by Component, 2023 to 2033 Figure 237: MEA Market Attractiveness by Deployment Type , 2023 to 2033 Figure 238: MEA Market Attractiveness by Organization Size, 2023 to 2033 Figure 239: MEA Market Attractiveness by Vertical, 2023 to 2033 Figure 240: MEA Market Attractiveness by Country, 2023 to 2033
Recommendations
Explore Technology Insights
View Reports