Reports

- Global Locations -

Headquarters

Future Market Insights, Inc.

Christiana Corporate, 200
Continental Drive, Suite 401,
Newark, Delaware - 19713,
United States

T: +1-845-579-5705

Americas

Future Market Insights, Inc.

616 Corporate Way, Suite 2-9018,
Valley Cottage, NY 10989, United States

T: +1-347-918-3531

MEA

Future Market Insights

1602-6 Jumeirah Bay X2 Tower, Plot No: JLT-PH2-X2A,
Jumeirah Lakes Towers, Dubai,
United Arab Emirates

Europe

Future Market Insights

3rd Floor, 207 Regent Street,
W1B 3HH London
United Kingdom

T: + 44 (0) 20 8123 9659
D: +44 (0) 20 3287 4268

Asia Pacific

Future Market Insights

IndiaLand Global Tech Park, Unit UG-1, Behind Grand HighStreet, Phase 1, Hinjawadi, MH, Pune – 411057, India

Trade Management Software Market Snapshot (2022 to 2032)

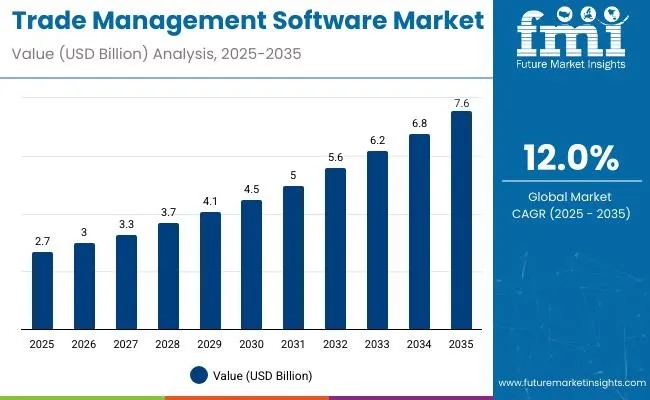
According to Future Market Insights, the global trade management software market is projected to grow steadily at a CAGR of 10.9% value, during the forecast period from 2022 to 2032. Earlier in 2021, this market was projected to have a global revenue size worth US$ 1.1 Billion and is expected to reach a size worth US$ 3.4 Billion by 2032.

Trade management software streamlines complex trading tasks such as import and export management, shipment tracking, and so on, assisting businesses in managing their international trade and import-export activities. One of the most essential features of this software is that it reduces supply chain and compliance risk, allowing traders and organizations to operate their businesses more effectively and efficiently. It also decreases the risk associated with import-export legislation and legal policies by managing cross-border transactions automatically and transparently.

Attributes Details
Global Growth Rate (2022 to 2032) 10.9% CAGR
Estimated market value in 2021 US$ 1.1 Billion
Projected market value in 2022 US$ 1.2 Billion
Projected market value by 2032 US$ 3.4 Billion

During the pandemic, the manufacturing sector suffered significant losses due to temporary factory shutdowns and low production volumes, impeding the expansion of the retail, e-commerce, and logistics sectors. Furthermore, government-imposed social and physical barriers have hampered the operations of logistics and other service providers. This disruption has caused a drop in trade business. These challenges resulted in a 17.7 percent decrease in global trade volumes in May 2020, compared to May 2019. The fall in the first five months of 2020 was widespread, but it had the greatest impact on exports from Japan, the USA, and Europe.

Despite the interruption caused by the COVID-19 epidemic, trade is expected to increase in the future, as firms have resumed operations following a lengthy lockdown. With social distancing measures in place, e-commerce, logistics, retail, and other trade-related sectors are focusing on the implementation of Trade management software to satisfy compliance by assuring supply chain speed. As a result of the uncertainties brought about by COVID-19, the use of cloud-based software/SaaS in logistics has expanded and turned out to be a major driving factor in the market. Thus, it is expected that by the end of 2022, the global market will gain a market share of US$ 1.1 Billion.

Don't pay for what you don't need

Customize your report by selecting specific countries or regions and save 30%!

Prominent Growth Drivers Influencing Trade Management Software Industry

Increased international trade to accelerate the market growth

As the volume of worldwide trade grows, so does the need for better global logistics and cargo tracking. According to the World Commerce Organization, trade in products recovered by 1% in the fourth quarter of 2020, as firms adjusted to the new normal. However, when compared to 2020, the WTO reported a 12 percent decline in growth. Global commerce in products and services is expected to reach 22 trillion dollars in 2021.

International commerce opens up new markets and exposes countries to commodities and services that would otherwise be inaccessible in their home economies. Analysts from numerous organizations agree that following the epidemic, demand for a variety of goods and services would increase, resulting in an increase in international trade and a significant impact on usage rates, hence driving the demand in this market.

Efficient Supply Chain to Reduce Cost to Augment the Market Growth

One of the primary drivers of Trade management software market share growth is the growing requirement for increased supply chain efficiency. The demand for supply chain visibility has increased in recent years as a result of growing worldwide shipping costs, longer delivery deadlines, and differences in lead time. Enterprises also use Trade management software to plan transportation and logistics while maximizing resource utilization. Furthermore, by replacing manual activities with Trade management software, businesses may be able to reduce expenses, time, and labor.

Trade is a complex process that involves the movement of various items and information through a network of suppliers, carriers, and warehouses. Through the analysis of real-time and real-world data, software solutions enable users to handle these complexities more precisely and easily, decreasing inefficiencies. Implementing these software tools also enhances supply chain performance and provides real-time visibility into processes. Increased competitiveness in various industries is driving them to invest in automation and digitalization.

The use of cloud-based technologies improves real-time insight into exported goods while lowering operating costs. The incorporation of emerging technologies such as blockchain, artificial intelligence (AI), and predictive analysis into logistics operations would enhance the worldwide Trade management software market growth in the next few years.

Trade Management Software Market

What could Possibly Hinder Trade Management Software Deployment?

The global pandemic was the only hindrance that the market faced in the last few years

To manage their trade processes, organizations have relied heavily on current systems such as Supply Chain Management (SCM), Enterprise Resource Planning (ERP), and transport management systems. Organizations manage their trade processes through manual methods and existing management systems. These factors have been recognized as important impediments to the general adoption of Trade management software around the world.

Other factors preventing Trade management software adoption include firms' limited bandwidth and finances for implementing and managing new technologies, such as Trade management software. One of the main barriers to digital supply chain investment is the supply chain executive's lack of access to technology. Manufacturing and 3PL/warehousing and distribution are trailing in cloud adoption. These reasons may be impediments to the market's steady growth.

To administer Trade management software systems effectively, hands-on experience is required. There has been a dearth of knowledge that provides hands-on experience with trade compliance software. As a result, vendors fail to teach industry professionals working in the global trade to overcome the obstacles of supporting and managing software in businesses. Organizations also fail to train their management staff in high-risk sectors. To manage trade funds and shipments, much training is required. Failing to provide training can prove to hinder the market to a great extent.

Sudip Saha
Sudip Saha

Principal Consultant

Talk to Analyst

Find your sweet spots for generating winning opportunities in this market.

Comparative View of Trade Management Software Market

Trade management software Market:

Attributes Trade management software Market
CAGR(2022 to 2032) 10.6%
Market Value (2032) US$ 3.4 Billion
Growth Factor The necessity for optimizing global logistics and shipment tracking through trade management software is growing in tandem with the volume of international trade.
Opportunity To effectively manage Information Technology (IT) teams in enterprises, Trade management systems must interact with corporate systems such as ERP and Sand Transport Management Systems (TMS). Reporting and analytics are projected to be key opportunities for producing vital data that will assist firms in better understanding the supply chain.
Key Trends Heavy expenditures in the aerospace and military, healthcare, and life sciences verticals are expected to promote the growth of the Trade management market for improved monitoring and obtaining accurate data on trade functions.

Software Defined Radio (SDR) Market:

Attributes Software Defined Radio (SDR) Market
CAGR(2022 to 2032) 9.3%
Market Value (2032) US$ 1.9 Billion
Growth Factor Software Defined Radio's jamming feature enables high-speed data transmission and secure voice connection. All three professional defense forces of various countries are competing to design, develop, and manufacture tactical communication systems based on a software-defined radio, which will increase demand in this sector.
Opportunity Many private companies are eager to produce cutting-edge software-defined radios with sophisticated functionality and more compliance flexibility. Software-defined radio is a game changer in the world of communication systems and strategic sectors. SDR is likely to have a significant impact on net-centric warfare in the coming years.
Key Trends Extensive research along with new emerging technologies is converting the existing software-defined radio market into a highly adaptive and unbeatable business. A unified radio platform for various emerging markets cuts logistical and operational costs dramatically.

Trade Surveillance Market:

Attributes Trade Surveillance Market
CAGR(2022 to 2032) 7.2%
Market Value (2032) US$ 2.5 Billion
Growth Factor The increasing requirement for security is projected to drive the expansion of the trade surveillance industry. Furthermore, the growing incidences of data manipulation and fraud in financial institutions are likely to raise demand for trade monitoring.
Opportunity Buyers and sellers have increased their trading in exotic derivatives, swaps, and other over-the-counter (OTC) goods on various trading platforms, such as electronic communication networks, high-frequency trading, and dark pools. This will provide the market with fresh opportunities.
Key Trends During the forecast period, trade surveillance benefits such as effective internal control and workflow management are also likely to be the growing trends that will drive up demand for trade surveillance in the coming years.

Category-wise Insights

Which Component Type is Forecast to Gain the Maximum Market Share?

Trade Management Software Solutions to Experience High Uptake

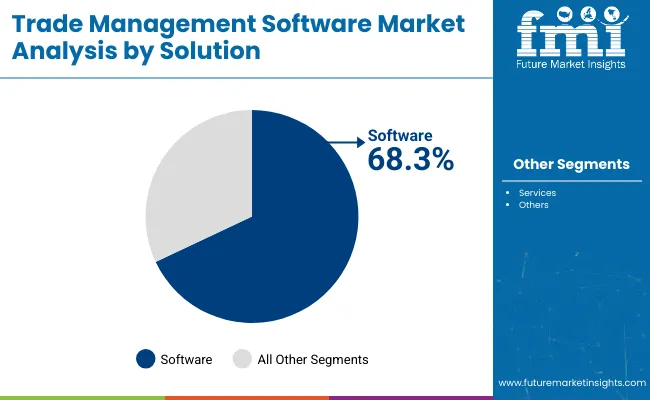
During the forecast period, the solution segment is likely to be the leading market segment in the global Trade management software market. Earlier in 2021, this segment held a global market share of 35%.

Trade compliance, as well as international trade visibility and execution, are included in the solutions segment. Furthermore, cross-border shipping and transportation are part of international trade visibility and execution processes. They provide insight into the events and processes of international trading partners. These processes must be multinational in nature, incorporating transactions and agreements between commercial trading partners.

Which Deployment Segment is forecast to grow during the Forecast Period?

Cloud-based Trade Management Software to witness High Adoption

During the forecast period, the cloud sector is expected to be the dominant segment in the worldwide Trade management software deployment sector with a 28% market share in 2021. Small and medium-sized businesses are heavily utilizing cloud computing. Low cost of ownership, lower maintenance and upgrade costs, and access to the most recent features are some of the fundamental advantages of cloud deployment over on-premise implementation.

This is also owing to the broad adoption of cloud technology by small and medium-sized businesses, as well as the benefits that cloud technology provides, such as cheaper prices and a high level of operational agility, among other things. Oracle, for example, expanded its product offering in July 2021 by adding cloud-based warehouse management for greater logistics performance, which is projected to lower costs, optimize inventory levels, and improve customer experience. As a result, innovations like these will raise revenue in this market during the forecast period.

Which Vertical is Likely to Gain the Most Popularity during the Forecast Period?

Transportation and Logistics are expected to grow rapidly during the forecast period

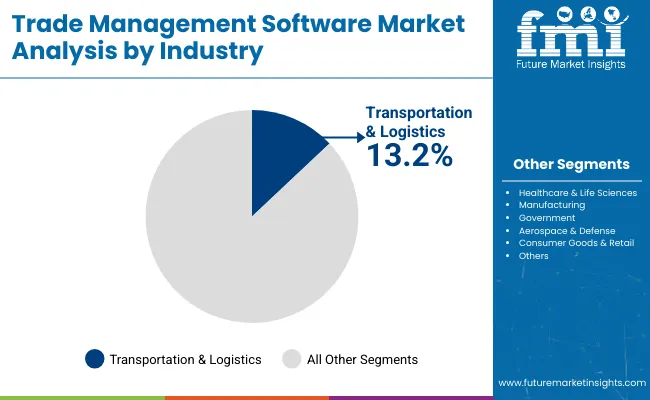
The transportation and logistics segment is forecast to be the fastest-growing sector in the global Trade management software market during 2022 to 2032. This segment is projected to grow with a CAGR of 10.5% during the forecast period.

The need for logistics companies that provide services that go beyond the norm is increasing. In some cases, third-party logistics companies operate or administer their clients' international trade zones. In some circumstances, they also provide warehousing and value-added services related to the manufacture or acquisition of goods. Furthermore, they organize the logistics and transportation operations required to efficiently and inexpensively transfer items from source to end customers. These factors are going to accelerate the demand for Trade management software during the forecast period.

Get the data you need at a Fraction of the cost

Personalize your report by choosing insights you need
and save 40%!

Region-wise Analysis

What is the Outlook for the Asia Pacific Trade Management Software market?

Increased Research and Development in developing countries will bolster the market

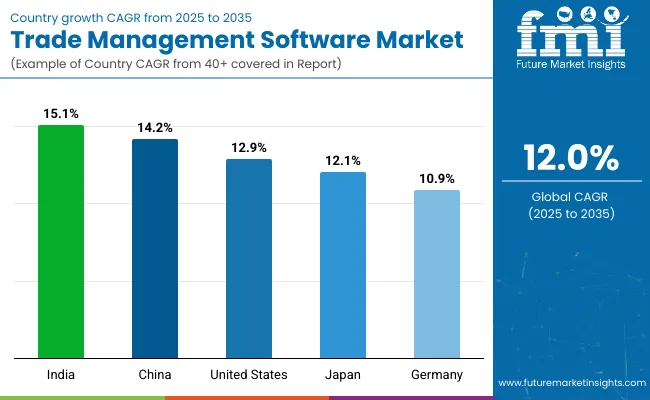
In 2021, Asia Pacific held the third-largest market share for trade management software. However, the region is expected to contribute 33% of the trade management software market growth throughout the projection period. During this time period, year-on-year growth will range between 10.95 and 14.65%. China will emerge as the primary Asia Pacific market for Trade management software. The market in this region will increase faster than the market in the rest of the world.

Asia Pacific is made up of numerous emerging countries that are seeing rapid expansion in their own manufacturing sectors; the area has evolved into a global manufacturing powerhouse. China, along with other developing countries such as India, Taiwan, South Korea, and Vietnam, are luring a number of enterprises to shift their low- to medium-skilled manufacturing operations to neighboring countries with lower-cost labor. The Trade management software market in China is expected to reach a market size of US$ 250.6 Million by 2032. And the market in South Korea is expected to grow at a pace of 8.4%.

The governments of these countries are taking steps to increase international investment in the region. Manufacturing spending in the region has increased significantly over the years and is expected to increase at a reasonable rate in the future. The region's demand for Trade management software is being driven by a huge increase in manufacturing spending and the adoption of new technologies.

How is the growth of Trade Management Software emerging in the North American region?

Increasing Trading Activities and Aerospace Development to boost the Market

During the projected period, North America is expected to hold the greatest share of the trade management market. This is attributable to increased trade activity in the USA, which contributed to approximately US$ 1.2 Billion by 2032. North America is one of the most advanced regions in terms of technology adoption and infrastructure, accounting for the majority of Trade management software products and services.

Another important aspect assisting market expansion is a solid infrastructure that promotes international trade in this region. Heavy investments in aerospace and defense, as well as healthcare and life sciences, are expected to boost the expansion of the North American trade management industry. The presence of big aerospace and defense businesses in the USA, such as Boeing, Lockheed Martin, and Raytheon, promotes international trade in this region.

Verticals formerly relied on traditional techniques to record trade-related information, such as retaining documents and spreadsheets. The market in the USA is expected to grow at a pace of 10.6% and is projected to occupy a global market valuation of US$ 765.3 Million by 2032.

Region-wise Market Share for the Trade Management Software Market

North America 41.5%
Asia Pacific 23.2%
Europe 25.5%
Latin America 5%
Middle East & Africa 4.8%

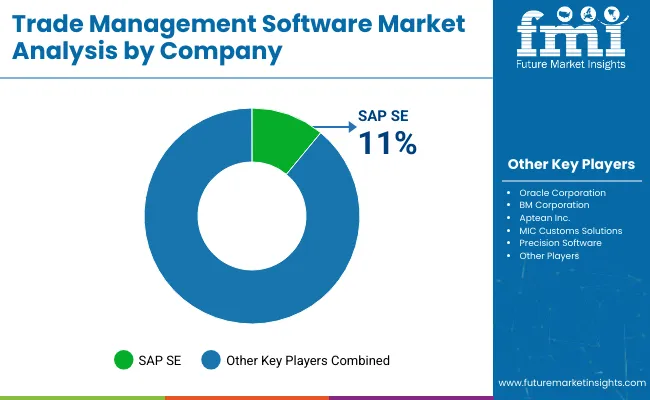
Competitive Landscape

Despite the interruption caused by the COVID-19 epidemic, trade is expected to increase in the future, as firms have resumed operations following a lengthy lockdown. With social distancing measures in place, e-commerce, logistics, retail, and other trade-related sectors are focusing on the implementation of Trade management software to satisfy compliance by assuring supply chain speed. As a result of the uncertainties brought about by COVID-19, the use of cloud-based software/SaaS in logistics has expanded and turned out to be a major driving factor in the market.

  • Oracle collaborated with Pharmaniaga Berhad in 2021. Pharmaniaga Berhad (Pharmaniaga) has chosen Oracle Fusion Cloud Supply Chain & Manufacturing (SCM) to improve logistics procedures for the distribution of the COVID-19 vaccine in Malaysia. Pharmaniaga can increase the efficiency and security of its logistics operations by automating planning and execution processes and gaining real-time shipment insights using Oracle Cloud SCM.
  • SAP Hong Kong and consulting heavyweight Deloitte collaborated in 2021 to provide significant benefits to enterprises engaged in cross-border trade. Deloitte, in collaboration with SAP, provides one-stop end-to-end global trade services, including SAP GTS-enabled Smart GTS, which serves as a direct train to global trade, assisting enterprises in achieving compliance, cost reduction, intelligence, and synergy for trade management in the increasingly complex global trade environment, and thus implementing their global development strategies.

Report Scope

Report Attributes Details
Growth Rate CAGR of 10.9% from 2022 to 2032
Market Value for 2022 US$ 1.2 Billion
Market Value for 2032 US$ 3.4 Billion
Base Year for Estimation 2021
Historical Data 2015 to 2021
Forecast Period 2022 to 2032
Quantitative Units US$ Billion for Value
Report Coverage Revenue Forecast, Volume Forecast, Company Ranking, Competitive Landscape, Growth Factors, Trends, and Pricing Analysis
Segments Covered
  • Component
  • Deployment
  • Organization Size
  • Vertical
  • Region
Regions Covered
  • North America
  • Latin America
  • Europe
  • Asia Pacific
  • Middle East & Africa
Key Countries Profiled
  • USA
  • Canada
  • Brazil
  • Mexico
  • Germany
  • France
  • United Kingdom
  • Italy
  • BENELUX
  • Nordics
  • China
  • Japan
  • South Korea
  • GCC Countries
  • South Africa
  • Turkey
Key Companies Profiled
  • Amber Road Inc.
  • Aptean Inc.
  • Integration Point Inc.
  • Livingston International Inc.
  • MIC Customs Solutions
  • MIQ Logistics
  • Oracle Corporation
  • Precision Software
  • QuestaWeb Inc.
  • SAP SE
Report Customization & Pricing Available upon Request

Key Segments Covered in the Trade Management Software Market Report

By Component:

  • Solutions
  • Services

By Deployment:

  • On-premise
  • Cloud-based

By Organization Size:

  • for SMEs
  • Large Enterprises

By Vertical:

  • Transportation and Logistics
  • Government and Public
  • Healthcare and Life Sciences
  • Aerospace and Defense
  • Manufacturing
  • Consumer Goods and Retail
  • Energy Utilities
  • Other Verticals

By Region:

  • North America
  • Latin America
  • Europe
  • Asia Pacific
  • Middle East & Africa

Frequently Asked Questions

At what rate did the trade management software market flourish from 2015 to 2021?

From 2015 to 2021, the trade management software market grew at a CAGR of 12.6%.

What is the future outlook of the global trade management software market?

The global trade management software market is expected to grow at a 10.6% CAGR from 2022 to 2032

Which segment dominated the global trade management software market during 2021?

In 2021, the transportation and logistics segment by vertical dominated the global market with a CAGR of 12%.

How will the trade management software market in Asia Pacific flourish until 2032?

The Asia Pacific trade management software market is expected to grow at a 10.3% CAGR until 2032.

What was the outlook of the North American trade management software Market during 2021?

As per Future Market Insights, the North American market is forecast to register 41.5% revenue in the trade management software market.

Table of Content

1. Executive Summary | Trade Management Software Market

    1.1. Global Market Outlook

    1.2. Summary of Statistics

    1.3. Key Market Characteristics & Attributes

    1.4. Analysis and Recommendations

2. Market Overview

    2.1. Market Coverage

    2.2. Market Definition

3. Market Risks and Trends Assessment 

    3.1. Risk Assessment

        3.1.1. COVID-19 Crisis and Impact on Trade Management Software

        3.1.2. COVID-19 Impact Benchmark with Previous Crisis

        3.1.3. Impact on Market Value (US$ Million)

        3.1.4. Assessment by Key Countries

        3.1.5. Assessment by Key Market Segments

        3.1.6. Action Points and Recommendation for Suppliers

    3.2. Key Trends Impacting the Market

    3.3. Formulation and Product Development Trends

4. Market Background 

    4.1. Market, by Key Countries

    4.2. Market Opportunity Assessment (US$ Million)

        4.2.1. Total Available Market

        4.2.2. Serviceable Addressable Market

        4.2.3. Serviceable Obtainable Market

    4.3. Market Scenario Forecast

        4.3.1. Demand in Optimistic Scenario

        4.3.2. Demand in Likely Scenario

        4.3.3. Demand in Conservative Scenario

    4.4. Investment Feasibility Analysis

        4.4.1. Investment in Established Markets

            4.4.1.1. In Short Term

            4.4.1.2. In Long Term

        4.4.2. Investment in Emerging Markets

            4.4.2.1. In Short Term

            4.4.2.2. In Long Term

    4.5. Forecast Factors - Relevance & Impact

        4.5.1. Top Companies Historical Growth

        4.5.2. Growth in Automation, By Country

        4.5.3. Adoption Rate, By Country

    4.6. Market Dynamics

        4.6.1. Market Driving Factors and Impact Assessment

        4.6.2. Prominent Market Challenges and Impact Assessment

        4.6.3. Market Opportunities

        4.6.4. Prominent Trends in the Global Market & Their Impact Assessment

5. Key Success Factors 

    5.1. Manufacturers’ Focus on Low Penetration High Growth Markets

    5.2. Banking on with Segments High Incremental Opportunity

    5.3. Peer Benchmarking

6. Global Market Demand Analysis 2015 to 2021 and Forecast, 2022 to 2032

    6.1. Historical Market Analysis, 2015 to 2021

    6.2. Current and Future Market Projections, 2022 to 2032

    6.3. Y-o-Y Growth Trend Analysis

7. Global Market Value Analysis 2015 to 2021 and Forecast, 2022 to 2032

    7.1. Historical Market Value (US$ Million) Analysis, 2015 to 2021

    7.2. Current and Future Market Value (US$ Million) Projections, 2022 to 2032

        7.2.1. Y-o-Y Growth Trend Analysis

        7.2.2. Absolute $ Opportunity Analysis

8. Global Market Analysis 2015 to 2021 and Forecast 2022 to 2032, By Component

    8.1. Introduction / Key Findings

    8.2. Historical Market Size (US$ Million) Analysis By Component, 2015 to 2021

    8.3. Current and Future Market Size (US$ Million) Analysis and Forecast By Component, 2022 to 2032

        8.3.1. Solution

        8.3.2. Services

    8.4. Market Attractiveness Analysis By Component

9. Global Market Analysis 2015 to 2021 and Forecast 2022 to 2032, By Deployment

    9.1. Introduction / Key Findings

    9.2. Historical Market Size (US$ Million) Analysis By Deployment, 2015 to 2021

    9.3. Current and Future Market Size (US$ Million) Analysis and Forecast By Deployment, 2022 to 2032

        9.3.1. On-premise

        9.3.2. Cloud

    9.4. Market Attractiveness Analysis By Deployment

10. Global Market Analysis 2015 to 2021 and Forecast 2022 to 2032, By Organization Size

    10.1. Introduction / Key Findings

    10.2. Historical Market Size (US$ Million) Analysis By Organization Size, 2015 to 2021

    10.3. Current and Future Market Size (US$ Million) Analysis and Forecast By Organization Size, 2022 to 2032

        10.3.1. SMEs

        10.3.2. Large Enterprises

    10.4. Market Attractiveness Analysis By Organization Size

11. Global Market Analysis 2015 to 2021 and Forecast 2022 to 2032, By Vertical

    11.1. Introduction / Key Findings

    11.2. Historical Market Size (US$ Million) Analysis By Vertical, 2015 to 2021

    11.3. Current and Future Market Size (US$ Million) Analysis and Forecast By Vertical, 2022 to 2032

        11.3.1. Transportation And Logistics

        11.3.2. Government And Public

        11.3.3. Healthcare And Life Sciences

        11.3.4. Aerospace And Defense

        11.3.5. Manufacturing

        11.3.6. Consumer Goods And Retail

        11.3.7. Energy Utilities

        11.3.8. Others

    11.4. Market Attractiveness Analysis By Vertical

12. Global Market Analysis 2015 to 2021 and Forecast 2022 to 2032, By Region

    12.1. Introduction

    12.2. Historical Market Size (US$ Million) Analysis By Region, 2015 to 2021

    12.3. Current Market Size (US$ Million) & Analysis and Forecast By Region, 2022 to 2032

        12.3.1. North America

        12.3.2. Latin America

        12.3.3. Europe

        12.3.4. Asia Pacific

        12.3.5. Middle East and Africa (MEA)

    12.4. Market Attractiveness Analysis By Region

13. North America Market Analysis 2015 to 2021 and Forecast 2022 to 2032

    13.1. Introduction

    13.2. Pricing Analysis

    13.3. Historical Market Value (US$ Million) Trend Analysis By Market Taxonomy, 2015 to 2021

    13.4. Market Value (US$ Million) & Forecast By Market Taxonomy, 2022 to 2032

        13.4.1. By Country

            13.4.1.1. USA

            13.4.1.2. Canada

            13.4.1.3. Rest of North America

        13.4.2. By Component

        13.4.3. By Deployment

        13.4.4. By Vertical

        13.4.5. By Organization Size

    13.5. Market Attractiveness Analysis

        13.5.1. By Country

        13.5.2. By Component

        13.5.3. By Deployment

        13.5.4. By Vertical

        13.5.5. By Organization Size

14. Latin America Market Analysis 2015 to 2021 and Forecast 2022 to 2032

    14.1. Introduction

    14.2. Pricing Analysis

    14.3. Historical Market Value (US$ Million) Trend Analysis By Market Taxonomy, 2015 to 2021

    14.4. Market Value (US$ Million) & Forecast By Market Taxonomy, 2022 to 2032

        14.4.1. By Country

            14.4.1.1. Brazil

            14.4.1.2. Mexico

            14.4.1.3. Rest of Latin America

        14.4.2. By Component

        14.4.3. By Deployment

        14.4.4. By Vertical

        14.4.5. By Organization Size

    14.5. Market Attractiveness Analysis

        14.5.1. By Country

        14.5.2. By Component

        14.5.3. By Deployment

        14.5.4. By Vertical

        14.5.5. By Organization Size

15. Europe Market Analysis 2015 to 2021 and Forecast 2022 to 2032

    15.1. Introduction

    15.2. Pricing Analysis

    15.3. Historical Market Value (US$ Million) Trend Analysis By Market Taxonomy, 2015 to 2021

    15.4. Market Value (US$ Million) & Forecast By Market Taxonomy, 2022 to 2032

        15.4.1. By Country

            15.4.1.1. Germany

            15.4.1.2. France

            15.4.1.3. United Kingdom

            15.4.1.4. Italy

            15.4.1.5. Benelux

            15.4.1.6. Nordic Countries

            15.4.1.7. Rest of Europe

        15.4.2. By Component

        15.4.3. By Deployment

        15.4.4. By Vertical

        15.4.5. By Organization Size

    15.5. Market Attractiveness Analysis

        15.5.1. By Country

        15.5.2. By Component

        15.5.3. By Deployment

        15.5.4. By Vertical

        15.5.5. By Organization Size

16. Asia Pacific Market Analysis 2015 to 2021 and Forecast 2022 to 2032

    16.1. Introduction

    16.2. Pricing Analysis

    16.3. Historical Market Value (US$ Million) Trend Analysis By Market Taxonomy, 2015 to 2021

    16.4. Market Value (US$ Million) & Forecast By Market Taxonomy, 2022 to 2032

        16.4.1. By Country

            16.4.1.1. China

            16.4.1.2. Japan

            16.4.1.3. South Korea

            16.4.1.4. Rest of Asia Pacific

        16.4.2. By Component

        16.4.3. By Deployment

        16.4.4. By Vertical

        16.4.5. By Organization Size

    16.5. Market Attractiveness Analysis

        16.5.1. By Country

        16.5.2. By Component

        16.5.3. By Deployment

        16.5.4. By Vertical

        16.5.5. By Organization Size

17. Middle East and Africa Market Analysis 2015 to 2021 and Forecast 2022 to 2032

    17.1. Introduction

    17.2. Pricing Analysis

    17.3. Historical Market Value (US$ Million) Trend Analysis By Market Taxonomy, 2015 to 2021

    17.4. Market Value (US$ Million) & Forecast By Market Taxonomy, 2022 to 2032

        17.4.1. By Country

            17.4.1.1. GCC Countries

            17.4.1.2. South Africa

            17.4.1.3. Turkey

            17.4.1.4. Rest of Middle East and Africa

        17.4.2. By Component

        17.4.3. By Deployment

        17.4.4. By Vertical

        17.4.5. By Organization Size

    17.5. Market Attractiveness Analysis

        17.5.1. By Country

        17.5.2. By Component

        17.5.3. By Deployment

        17.5.4. By Vertical

        17.5.5. By Organization Size

18. Key Countries Market Analysis 2015 to 2021 and Forecast 2022 to 2032

    18.1. Introduction

        18.1.1. Market Value Proportion Analysis, By Key Countries

        18.1.2. Global Vs. Country Growth Comparison

    18.2. US Market Analysis

        18.2.1. Value Proportion Analysis by Market Taxonomy

        18.2.2. Value Analysis and Forecast by Market Taxonomy, 2015 to 2032

            18.2.2.1. By Component

            18.2.2.2. By Deployment

            18.2.2.3. By Vertical

            18.2.2.4. By Organization Size

    18.3. Canada Market Analysis

        18.3.1. Value Proportion Analysis by Market Taxonomy

        18.3.2. Value Analysis and Forecast by Market Taxonomy, 2015 to 2032

            18.3.2.1. By Component

            18.3.2.2. By Deployment

            18.3.2.3. By Vertical

            18.3.2.4. By Organization Size

    18.4. Mexico Market Analysis

        18.4.1. Value Proportion Analysis by Market Taxonomy

        18.4.2. Value Analysis and Forecast by Market Taxonomy, 2015 to 2032

            18.4.2.1. By Component

            18.4.2.2. By Deployment

            18.4.2.3. By Vertical

            18.4.2.4. By Organization Size

    18.5. Brazil Market Analysis

        18.5.1. Value Proportion Analysis by Market Taxonomy

        18.5.2. Value Analysis and Forecast by Market Taxonomy, 2015 to 2032

            18.5.2.1. By Component

            18.5.2.2. By Deployment

            18.5.2.3. By Vertical

            18.5.2.4. By Organization Size

    18.6. Germany Market Analysis

        18.6.1. Value Proportion Analysis by Market Taxonomy

        18.6.2. Value Analysis and Forecast by Market Taxonomy, 2015 to 2032

            18.6.2.1. By Component

            18.6.2.2. By Deployment

            18.6.2.3. By Vertical

            18.6.2.4. By Organization Size

    18.7. France Market Analysis

        18.7.1. Value Proportion Analysis by Market Taxonomy

        18.7.2. Value Analysis and Forecast by Market Taxonomy, 2015 to 2032

            18.7.2.1. By Component

            18.7.2.2. By Deployment

            18.7.2.3. By Vertical

            18.7.2.4. By Organization Size

    18.8. Italy Market Analysis

        18.8.1. Value Proportion Analysis by Market Taxonomy

        18.8.2. Value Analysis and Forecast by Market Taxonomy, 2015 to 2032

            18.8.2.1. By Component

            18.8.2.2. By Deployment

            18.8.2.3. By Vertical

            18.8.2.4. By Organization Size

    18.9. BENELUX Market Analysis

        18.9.1. Value Proportion Analysis by Market Taxonomy

        18.9.2. Value Analysis and Forecast by Market Taxonomy, 2015 to 2032

            18.9.2.1. By Component

            18.9.2.2. By Deployment

            18.9.2.3. By Vertical

            18.9.2.4. By Organization Size

    18.10. United Kingdom Market Analysis

        18.10.1. Value Proportion Analysis by Market Taxonomy

        18.10.2. Value Analysis and Forecast by Market Taxonomy, 2015 to 2032

            18.10.2.1. By Component

            18.10.2.2. By Deployment

            18.10.2.3. By Vertical

            18.10.2.4. By Organization Size

    18.11. Nordic Countries Market Analysis

        18.11.1. Value Proportion Analysis by Market Taxonomy

        18.11.2. Value Analysis and Forecast by Market Taxonomy, 2015 to 2032

            18.11.2.1. By Component

            18.11.2.2. By Deployment

            18.11.2.3. By Vertical

            18.11.2.4. By Organization Size

    18.12. China Market Analysis

        18.12.1. Value Proportion Analysis by Market Taxonomy

        18.12.2. Value Analysis and Forecast by Market Taxonomy, 2015 to 2032

            18.12.2.1. By Component

            18.12.2.2. By Deployment

            18.12.2.3. By Vertical

            18.12.2.4. By Organization Size

    18.13. Japan Market Analysis

        18.13.1. Value Proportion Analysis by Market Taxonomy

        18.13.2. Value Analysis and Forecast by Market Taxonomy, 2015 to 2032

            18.13.2.1. By Component

            18.13.2.2. By Deployment

            18.13.2.3. By Vertical

            18.13.2.4. By Organization Size

    18.14. South Korea Market Analysis

        18.14.1. Value Proportion Analysis by Market Taxonomy

        18.14.2. Value Analysis and Forecast by Market Taxonomy, 2015 to 2032

            18.14.2.1. By Component

            18.14.2.2. By Deployment

            18.14.2.3. By Vertical

            18.14.2.4. By Organization Size

    18.15. GCC Countries Market Analysis

        18.15.1. Value Proportion Analysis by Market Taxonomy

        18.15.2. Value Analysis and Forecast by Market Taxonomy, 2015 to 2032

            18.15.2.1. By Component

            18.15.2.2. By Deployment

            18.15.2.3. By Vertical

            18.15.2.4. By Organization Size

    18.16. South Africa Market Analysis

        18.16.1. Value Proportion Analysis by Market Taxonomy

        18.16.2. Value Analysis and Forecast by Market Taxonomy, 2015 to 2032

            18.16.2.1. By Component

            18.16.2.2. By Deployment

            18.16.2.3. By Vertical

            18.16.2.4. By Organization Size

    18.17. Turkey Market Analysis

        18.17.1. Value Proportion Analysis by Market Taxonomy

        18.17.2. Value Analysis and Forecast by Market Taxonomy, 2015 to 2032

            18.17.2.1. By Component

            18.17.2.2. By Deployment

            18.17.2.3. By Vertical

            18.17.2.4. By Organization Size

        18.17.3. Competition Landscape and Player Concentration in the Country

19. Market Structure Analysis

    19.1. Market Analysis by Tier of Companies

    19.2. Market Concentration

    19.3. Market Share Analysis of Top Players

    19.4. Market Presence Analysis

        19.4.1. By Regional Footprint of Players

        19.4.2. Product Footprint by Players

20. Competition Analysis

    20.1. Competition Dashboard

    20.2. Competition Benchmarking

    20.3. Competition Deep Dive

        20.3.1. Amber Road Inc

            20.3.1.1. Overview

            20.3.1.2. Product Portfolio

            20.3.1.3. Sales Footprint

            20.3.1.4. Strategy Overview

        20.3.2. Aptean Inc.

            20.3.2.1. Overview

            20.3.2.2. Product Portfolio

            20.3.2.3. Sales Footprint

            20.3.2.4. Strategy Overview

        20.3.3. Integration Point Inc

            20.3.3.1. Overview

            20.3.3.2. Product Portfolio

            20.3.3.3. Sales Footprint

            20.3.3.4. Strategy Overview

        20.3.4. Livingston International Inc.

            20.3.4.1. Overview

            20.3.4.2. Product Portfolio

            20.3.4.3. Sales Footprint

            20.3.4.4. Strategy Overview

        20.3.5. MIC Customs Solutions

            20.3.5.1. Overview

            20.3.5.2. Product Portfolio

            20.3.5.3. Sales Footprint

            20.3.5.4. Strategy Overview

        20.3.6. MIQ Logistics

            20.3.6.1. Overview

            20.3.6.2. Product Portfolio

            20.3.6.3. Sales Footprint

            20.3.6.4. Strategy Overview

        20.3.7. Oracle Corporation

            20.3.7.1. Overview

            20.3.7.2. Product Portfolio

            20.3.7.3. Sales Footprint

            20.3.7.4. Strategy Overview

        20.3.8. Precision Software

            20.3.8.1. Overview

            20.3.8.2. Product Portfolio

            20.3.8.3. Sales Footprint

            20.3.8.4. Strategy Overview

        20.3.9. QuestaWeb, Inc.

            20.3.9.1. Overview

            20.3.9.2. Product Portfolio

            20.3.9.3. Sales Footprint

            20.3.9.4. Strategy Overview

        20.3.10. SAP SE

            20.3.10.1. Overview

            20.3.10.2. Product Portfolio

            20.3.10.3. Sales Footprint

            20.3.10.4. Strategy Overview

21. Assumptions and Acronyms Used

22. Research Methodology

Don't pay for what you don't need

Customize your report by selecting specific countries or regions and save 30%!

List of Tables

Table 1: Global Market Value (US$ Million), By Component, 2015 to 2021

Table 2: Global Market Value (US$ Million), By Component, 2022 to 2032

Table 3: Global Market Value (US$ Million), By Deployment, 2015 to 2021

Table 4: Global Market Value (US$ Million), By Deployment, 2022 to 2032

Table 5: Global Market Value (US$ Million), By Organization Size, 2015 to 2021

Table 6: Global Market Value (US$ Million), By Organization Size, 2022 to 2032

Table 7: Global Market Value (US$ Million), By Vertical, 2015 to 2021

Table 8: Global Market Value (US$ Million), By Vertical, 2022 to 2032

Table 9: Global Market, By Region, 2015 to 2021

Table 10: Global Market, By Region, 2022 to 2032

Table 11: North America Market Value (US$ Million), By Component, 2015 to 2021

Table 12: North America Market Value (US$ Million), By Component, 2022 to 2032

Table 13: North America Market Value (US$ Million), By Deployment, 2015 to 2021

Table 14: North America Market Value (US$ Million), By Deployment, 2022 to 2032

Table 15: North America Market Value (US$ Million), By Organization Size, 2015 to 2021

Table 16: North America Market Value (US$ Million), By Organization Size, 2022 to 2032

Table 17: North America Market Value (US$ Million), By Vertical, 2015 to 2021

Table 18: North America Market Value (US$ Million), By Vertical, 2022 to 2032

Table 19: North America Market, By Country, 2015 to 2021

Table 20: North America Market, By Country, 2022 to 2032

Table 21: Latin America Market Value (US$ Million), By Component, 2015 to 2021

Table 22: Latin America Market Value (US$ Million), By Component, 2022 to 2032

Table 23: Latin America Market Value (US$ Million), By Deployment, 2015 to 2021

Table 24: Latin America Market Value (US$ Million), By Deployment, 2022 to 2032

Table 25: Latin America Market Value (US$ Million), By Organization Size, 2015 to 2021

Table 26: Latin America Market Value (US$ Million), By Organization Size, 2022 to 2032

Table 27: Latin America Market Value (US$ Million), By Vertical, 2015 to 2021

Table 28: Latin America Market Value (US$ Million), By Vertical, 2022 to 2032

Table 29: Latin America Market, By Country, 2015 to 2021

Table 30: Latin America Market, By Country, 2022 to 2032

Table 31: Europe Market Value (US$ Million), By Component, 2015 to 2021

Table 32: Europe Market Value (US$ Million), By Component, 2022 to 2032

Table 33: Europe Market Value (US$ Million), By Deployment, 2015 to 2021

Table 34: Europe Market Value (US$ Million), By Deployment, 2022 to 2032

Table 35: Europe Market Value (US$ Million), By Organization Size, 2015 to 2021

Table 36: Europe Market Value (US$ Million), By Organization Size, 2022 to 2032

Table 37: Europe Market Value (US$ Million), By Vertical, 2015 to 2021

Table 38: Europe Market Value (US$ Million), By Vertical, 2022 to 2032

Table 39: Europe Market, By Country, 2015 to 2021

Table 40: Europe Market, By Country, 2022 to 2032

Table 41: Asia Pacific Market Value (US$ Million), By Component, 2015 to 2021

Table 42: Asia Pacific Market Value (US$ Million), By Component, 2022 to 2032

Table 43: Asia Pacific Market Value (US$ Million), By Deployment, 2015 to 2021

Table 44: Asia Pacific Market Value (US$ Million), By Deployment, 2022 to 2032

Table 45: Asia Pacific Market Value (US$ Million), By Organization Size, 2015 to 2021

Table 46: Asia Pacific Market Value (US$ Million), By Organization Size, 2022 to 2032

Table 47: Asia Pacific Market Value (US$ Million), By Vertical, 2015 to 2021

Table 48: Asia Pacific Market Value (US$ Million), By Vertical, 2022 to 2032

Table 49: Asia Pacific Market, By Country, 2015 to 2021

Table 50: Asia Pacific Market, By Country, 2022 to 2032

Table 51: Middle East and Africa Market Value (US$ Million), By Component, 2015 to 2021

Table 52: Middle East and Africa Market Value (US$ Million), By Component, 2022 to 2032

Table 53: Middle East and Africa Market Value (US$ Million), By Deployment, 2015 to 2021

Table 54: Middle East and Africa Market Value (US$ Million), By Deployment, 2022 to 2032

Table 55: Middle East and Africa Market Value (US$ Million), By Organization Size, 2015 to 2021

Table 56: Middle East and Africa Market Value (US$ Million), By Organization Size, 2022 to 2032

Table 57: Middle East and Africa Market Value (US$ Million), By Vertical, 2015 to 2021

Table 58: Middle East and Africa Market Value (US$ Million), By Vertical, 2022 to 2032

Table 59: Middle East and Africa Market, By Country, 2015 to 2021

Table 60: Middle East and Africa Market, By Country, 2022 to 2032
Sudip Saha
Sudip Saha

Principal Consultant

Talk to Analyst

Find your sweet spots for generating winning opportunities in this market.

List of Charts

Figure 1: Global Market Value (US$ Million) and Year-on-Year Growth, 2015 to 2032

Figure 2: Global Market Absolute $ Historical Gain (2015 to 2021) and Opportunity (2022 to 2032), US$ Million

Figure 3: Global Market Share, By Component, 2022 & 2032

Figure 4: Global Market Y-o-Y Growth Projections, By Component 2022 to 2032

Figure 5: Global Market Attractiveness Index, By Component 2022 to 2032

Figure 6: Global Market Share, By Deployment, 2022 & 2032

Figure 7: Global Market Y-o-Y Growth Projections, By Deployment 2022 to 2032

Figure 8: Global Market Attractiveness Index, By Deployment 2022 to 2032

Figure 9: Global Market Share, By Vertical, 2022 & 2032

Figure 10: Global Market Y-o-Y Growth Projections, By Vertical 2022 to 2032

Figure 11: Global Market Attractiveness Index, By Vertical 2022 to 2032

Figure 12: Global Market Share, By Organization Size, 2022 & 2032

Figure 13: Global Market Y-o-Y Growth Projections, By Organization Size 2022 to 2032

Figure 14: Global Market Attractiveness Index, By Organization Size 2022 to 2032

Figure 15: Global Market Share, By Region, 2022 & 2032

Figure 16: Global Market Y-o-Y Growth Projections, By Region 2022 to 2032

Figure 17: Global Market Attractiveness Index, By Region 2022 to 2032

Figure 18: North America Market Value (US$ Million) and Year-on-Year Growth, 2015 to 2032

Figure 19: North America Market Absolute $ Opportunity Historical (2015 to 2021) and Forecast Period (2022 to 2032), US$ Million

Figure 20: North America Market Share, By Component, 2022 & 2032

Figure 21: North America Market Y-o-Y Growth Projections, By Component 2022 to 2032

Figure 22: North America Market Attractiveness Index, By Component 2022 to 2032

Figure 23: North America Market Share, By Deployment, 2022 & 2032

Figure 24: North America Market Y-o-Y Growth Projections, By Deployment 2022 to 2032

Figure 25: North America Market Attractiveness Index, By Deployment 2022 to 2032

Figure 26: North America Market Share, By Vertical, 2022 & 2032

Figure 27: North America Market Y-o-Y Growth Projections, By Vertical 2022 to 2032

Figure 28: North America Market Attractiveness Index, By Vertical 2022 to 2032

Figure 29: North America Market Share, By Organization Size, 2022 & 2032

Figure 30: North America Market Y-o-Y Growth Projections, By Organization Size 2022 to 2032

Figure 31: North America Market Attractiveness Index, By Organization Size 2022 to 2032

Figure 32: North America Market Share, By Country, 2022 & 2032

Figure 33: North America Market Y-o-Y Growth Projections, By Country 2022 to 2032

Figure 34: North America Market Attractiveness Index, By Country 2022 to 2032

Figure 35: Latin America Market Value (US$ Million) and Year-on-Year Growth, 2015 to 2032

Figure 36: Latin America Market Absolute $ Opportunity Historical (2015 to 2021) and Forecast Period (2022 to 2032), US$ Million

Figure 37: Latin America Market Share, By Component, 2022 & 2032

Figure 38: Latin America Market Y-o-Y Growth Projections, By Component 2022 to 2032

Figure 39: Latin America Market Attractiveness Index, By Component 2022 to 2032

Figure 40: Latin America Market Share, By Deployment, 2022 & 2032

Figure 41: Latin America Market Y-o-Y Growth Projections, By Deployment 2022 to 2032

Figure 42: Latin America Market Attractiveness Index, By Deployment 2022 to 2032

Figure 43: Latin America Market Share, By Vertical, 2022 & 2032

Figure 44: Latin America Market Y-o-Y Growth Projections, By Vertical 2022 to 2032

Figure 45: Latin America Market Attractiveness Index, By Vertical 2022 to 2032

Figure 46: Latin America Market Share, By Organization Size, 2022 & 2032

Figure 47: Latin America Market Y-o-Y Growth Projections, By Organization Size 2022 to 2032

Figure 48: Latin America Market Attractiveness Index, By Organization Size 2022 to 2032

Figure 49: Latin America Market Share, By Country, 2022 & 2032

Figure 50: Latin America Market Y-o-Y Growth Projections, By Country 2022 to 2032

Figure 51: Latin America Market Attractiveness Index, By Country 2022 to 2032

Figure 52: Europe Market Value (US$ Million) and Year-on-Year Growth, 2015 to 2032

Figure 53: Europe Market Absolute $ Opportunity Historical (2015 to 2021) and Forecast Period (2022 to 2032), US$ Million

Figure 54: Europe Market Share, By Component, 2022 & 2032

Figure 55: Europe Market Y-o-Y Growth Projections, By Component 2022 to 2032

Figure 56: Europe Market Attractiveness Index, By Component 2022 to 2032

Figure 57: Europe Market Share, By Deployment, 2022 & 2032

Figure 58: Europe Market Y-o-Y Growth Projections, By Deployment 2022 to 2032

Figure 59: Europe Market Attractiveness Index, By Deployment 2022 to 2032

Figure 60: Europe Market Share, By Vertical, 2022 & 2032

Figure 61: Europe Market Y-o-Y Growth Projections, By Vertical 2022 to 2032

Figure 62: Europe Market Attractiveness Index, By Vertical 2022 to 2032

Figure 63: Europe Market Share, By Organization Size, 2022 & 2032

Figure 64: Europe Market Y-o-Y Growth Projections, By Organization Size 2022 to 2032

Figure 65: Europe Market Attractiveness Index, By Organization Size 2022 to 2032

Figure 66: Europe Market Share, By Country, 2022 & 2032

Figure 67: Europe Market Y-o-Y Growth Projections, By Country 2022 to 2032

Figure 68: Europe Market Attractiveness Index, By Country 2022 to 2032

Figure 69: Middle East and Africa Market Value (US$ Million) and Year-on-Year Growth, 2015 to 2032

Figure 70: Middle East and Africa Market Absolute $ Opportunity Historical (2015 to 2021) and Forecast Period (2022 to 2032), US$ Million

Figure 71: Middle East and Africa Market Share, By Component, 2022 & 2032

Figure 72: Middle East and Africa Market Y-o-Y Growth Projections, By Component 2022 to 2032

Figure 73: Middle East and Africa Market Attractiveness Index, By Component 2022 to 2032

Figure 74: Middle East and Africa Market Share, By Deployment, 2022 & 2032

Figure 75: Middle East and Africa Market Y-o-Y Growth Projections, By Deployment 2022 to 2032

Figure 76: Middle East and Africa Market Attractiveness Index, By Deployment 2022 to 2032

Figure 77: Middle East and Africa Market Share, By Vertical, 2022 & 2032

Figure 78: Middle East and Africa Market Y-o-Y Growth Projections, By Vertical 2022 to 2032

Figure 79: Middle East and Africa Market Attractiveness Index, By Vertical 2022 to 2032

Figure 80: Middle East and Africa Market Share, By Organization Size, 2022 & 2032

Figure 81: Middle East and Africa Market Y-o-Y Growth Projections, By Organization Size 2022 to 2032

Figure 82: Middle East and Africa Market Attractiveness Index, By Organization Size 2022 to 2032

Figure 83: Middle East and Africa Market Share, By Country, 2022 & 2032

Figure 84: Middle East and Africa Market Y-o-Y Growth Projections, By Country 2022 to 2032

Figure 85: Middle East and Africa Market Attractiveness Index, By Country 2022 to 2032

Figure 86: Asia Pacific Market Value (US$ Million) and Year-on-Year Growth, 2015 to 2032

Figure 87: Asia Pacific Market Absolute $ Opportunity Historical (2015 to 2021) and Forecast Period (2022 to 2032), US$ Million

Figure 88: Asia Pacific Market Share, By Component, 2022 & 2032

Figure 89: Asia Pacific Market Y-o-Y Growth Projections, By Component 2022 to 2032

Figure 90: Asia Pacific Market Attractiveness Index, By Component 2022 to 2032

Figure 91: Asia Pacific Market Share, By Deployment, 2022 & 2032

Figure 92: Asia Pacific Market Y-o-Y Growth Projections, By Deployment 2022 to 2032

Figure 93: Asia Pacific Market Attractiveness Index, By Deployment 2022 to 2032

Figure 94: Asia Pacific Market Share, By Vertical, 2022 & 2032

Figure 95: Asia Pacific Market Y-o-Y Growth Projections, By Vertical 2022 to 2032

Figure 96: Asia Pacific Market Attractiveness Index, By Vertical 2022 to 2032

Figure 97: Asia Pacific Market Share, By Organization Size, 2022 & 2032

Figure 98: Asia Pacific Market Y-o-Y Growth Projections, By Organization Size 2022 to 2032

Figure 99: Asia Pacific Market Attractiveness Index, By Organization Size 2022 to 2032

Figure 100: Asia Pacific Market Share, By Country, 2022 & 2032

Figure 101: Asia Pacific Market Y-o-Y Growth Projections, By Country 2022 to 2032

Figure 102: Asia Pacific Market Attractiveness Index, By Country 2022 to 2032

Recommendations

Technology

Advanced Analytics Market

Published : November 2023

Technology

Supply Chain Management Market

Published : January 2023

Technology

Supply Chain Analytics Market

Published : December 2022

Explore Technology Insights

View Reports

Trade Management Software Market