Reports

- Global Locations -

Headquarters

Future Market Insights, Inc.

Christiana Corporate, 200
Continental Drive, Suite 401,
Newark, Delaware - 19713,
United States

T: +1-845-579-5705

Americas

Future Market Insights, Inc.

616 Corporate Way, Suite 2-9018,
Valley Cottage, NY 10989, United States

T: +1-347-918-3531

MEA

Future Market Insights

1602-6 Jumeirah Bay X2 Tower, Plot No: JLT-PH2-X2A,
Jumeirah Lakes Towers, Dubai,
United Arab Emirates

Europe

Future Market Insights

3rd Floor, 207 Regent Street,
W1B 3HH London
United Kingdom

T: + 44 (0) 20 8123 9659
D: +44 (0) 20 3287 4268

Asia Pacific

Future Market Insights

IndiaLand Global Tech Park, Unit UG-1, Behind Grand HighStreet, Phase 1, Hinjawadi, MH, Pune – 411057, India

Intradermal Injection Market Snapshot (2022 to 2032)

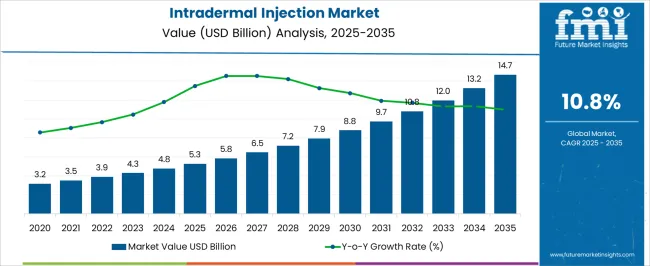
The global intradermal injection market is expected to surpass an impressive valuation of US$ 3,878 Million in 2022 and is projected to exhibit a compound annual growth rate (CAGR) of 10.8% from 2022 to 2032.

In recent years, technological advancements have led to the development of surgical approaches with the aim to minimize waste and achieve better results. The reusable intradermal devices result in low waste generation, having a net positive effect on the productivity of an economy.

Along with this, the results of several meta-analyses prove that intradermal delivery of drugs reduces the intensity of adverse events. The factors mentioned above indicate the favorable condition for the rapid growth of this segment in the future.

Report Attribute Details
Expected Market Value (2022) US$ 3,878 Million
Anticipated Forecast Value (2032) US$ 10,814.47 Million
Projected Growth Rate (2022 to 2032) 10.8% CAGR

Don't pay for what you don't need

Customize your report by selecting specific countries or regions and save 30%!

2017 to 2021 Intradermal Injection Demand Analysis vs. Forecast 2022 to 2032

Over the past two decades, there has been an increase in the demand for intradermal injections. This is due to the rising incidence of diseases with a simultaneous increase in the use of intradermal vaccination and aesthetic procedures.

Furthermore, the growing burden of chronic diseases has led to a rise in the overall use of syringes, particularly disposable syringes, intradermal jet injectors, microinjections, and ballistic intradermal injection treatment and diagnostic purposes. The global demand for Intradermal Injections is projected to increase at a CAGR of 10.8% during the forecast period between 2022 and 2032, reaching a total of US$ 10,814.47 Million in 2032, according to a report from Future Market Insights (FMI). From 2017 to 2021, sales witnessed significant growth, registering a CAGR of 8%.

Which are Some Prominent Drivers of the Intradermal Injection Market?

Growing Prevalence of Chronic Diseases, Increase in Aesthetic Surgical Procedures to Catalyse Intradermal Injection Uptake

The rising prevalence rate of tuberculosis is expected to promote the growth rate of the intradermal injection market. As per the data of WHO, tuberculosis is the 13th leading cause of death, and about 10 million cases of TB have been recorded every year, which resulted in a sudden rise in the diagnostic rate of TB during the last decade. This is one of the major factors that act as one of the leading reasons for increasing the intradermal injection market size of tuberculin syringes.

In addition to this, the number of aesthetic procedures is increasing rapidly in North America and Europe. The intradermal vaccination reduces the potential dose of antigens, improves the immune response, and decreases the anxiety associated with the vaccination. Moreover, aesthetic procedures are the leading segment of local aesthetic procedures, increasing the demand for intradermal injections.

Almost all vaccines require cold chain distribution and storage, which further limits resources or refrigerator space in a healthcare setting. Globally, approximately 17.4 million people are prone to rabies through animal bites annually. It occurs in more than 150 territories and countries, rabies is a viral disease that can cause encephalitis when transmitted to humans. Intradermal injections immensely help in lowering the cost of cell-derived vaccines for pre-exposure to rabies. The cost-savings with intradermal injections for rabies create immense opportunities for the intradermal injections market.

Sabyasachi Ghosh
Sabyasachi Ghosh

Principal Consultant

Talk to Analyst

Find your sweet spots for generating winning opportunities in this market.

What are the Challenges Projected to be Faced by the Market?

Unfavorable Government Provisions to Hinder Market Growth

Despite the advantages shown through various clinical studies, there are various barriers that hinder the usage of intradermal injections. The major world economies across Europe, the United States, and other developed regions rely on single-dose formats and have government funding or private insurance for vaccination. Emerging markets are anticipated to favor multi-dose formats and are limited by availability and cost of supply.
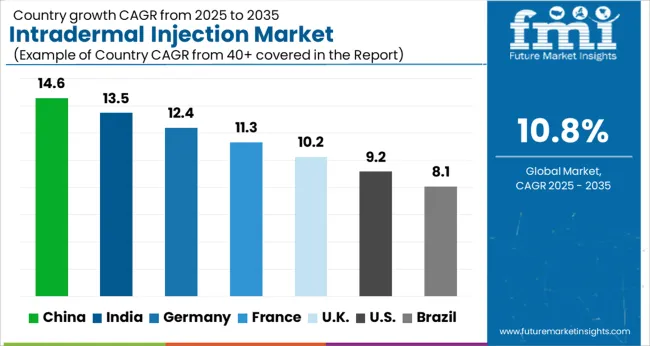
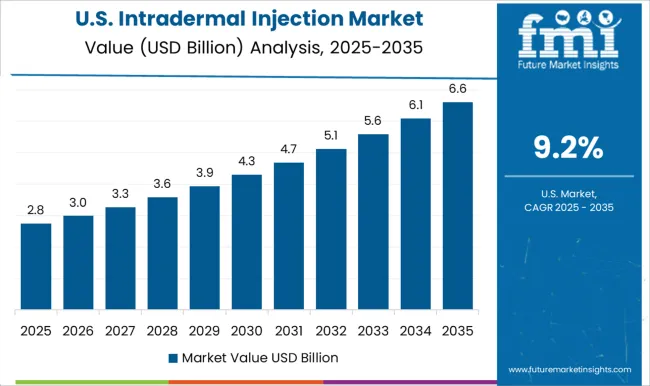
Region-wise Insights

What Makes the United States the Largest Market for Intradermal Injection?

Increased Prevalence of Diseases to drive the adoption of intradermal Injection

According to the American Cancer Society’s 2022 report, over 1.9 million new cancers are expected to be recorded in the United States in 2022. Also, as per the same source, the risk of having cancer rises dramatically as one gets older, and in the United States, 80% of cancer patients are 55 or older, with 57% being 65 or older. These figures tell that the growing geriatric population is expected to have a significant positive impact on the growth of the market.

Not just this but according to the International Diabetes Federation’s report of December 2021, about 32.2 million people were living with diabetes in the United States in 2021, and this number is estimated to increase to 36.3 million by 2045. This expansion in the diabetes patient pool is expected to boost growth in intradermal injection in the United States.

Why is the United Kingdom Considered a Lucrative Region for the Intradermal Injection Market?

The Increasing Prevalence of Diabetes is Spurring Demand for Intradermal Injection

As per the International Diabetes Federation (IDF) Diabetes Atlas 2021, the age-adjusted comparative prevalence of diabetes in the United Kingdom for 2021, 2030, and 2045 were estimated as 6.3%, 7.0%, and 7.5% respectively. Therefore, the gradual rise in the prevalence of diabetes is expected to increase the market demand.

Get the data you need at a Fraction of the cost

Personalize your report by choosing insights you need
and save 40%!

Category-wise Insights

Which Method Type Leads the Market for Intradermal Injection?

Normal Sized Needles to Lead the Method Type of Intradermal Injection

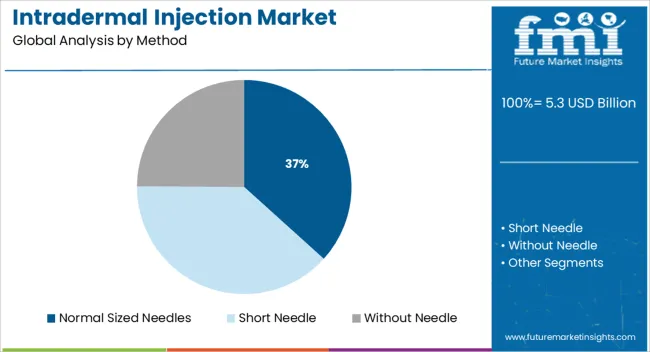
Based on the method, the intradermal injection market is segmented into normal-sized needles, short needles, and without needles. As per our research, normal-sized needles dominate the market, while the short-needle segment is estimated to register considerable growth.

By Application, Which Segment is Projected to Lead the Market?

Tuberculin Skin Test Segment is Estimated to Hold the Largest Share

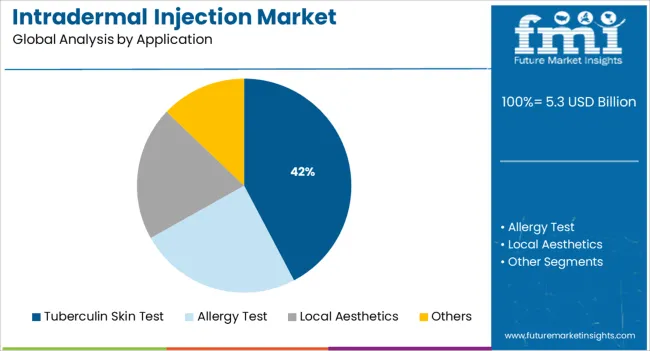
Based on application, the market is segmented into tuberculin skin tests, allergy tests, local aesthetics, and others. The tuberculin skin test segment is estimated to hold the largest share of the market in 2022, accounting for 58% of total demand, while the local aesthetic segment is expected to register the highest CAGR during the forecast period.
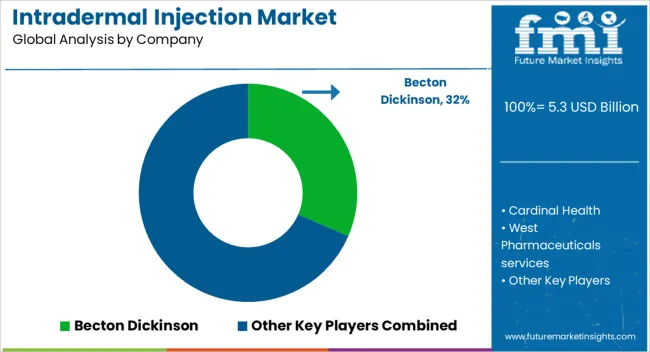
Market Competition

Key players in the Intradermal Injection market are Becton Dickinson, Cardinal Health, West Pharmaceuticals Services, Terumo Corporation, Nanopass, Pharmajet, Idevax, Enusung, Crossject, and Hindustan Syringes and Medical Devices.

  • In May 2022, Stevanato Group S.p.A. signed an exclusive agreement with leading medical device developer and manufacturer Owen Mumford Ltd. for its Aidaptus auto-injector. Adeptus is a 2-step, single-use auto-injector with a versatile design that accommodates both 1 mL and 2.25 mL prefilled glass syringes in the same base device.
  • In May 2020, Takeda Pharmaceutical Company Limited received approval from the European Commission for the subcutaneous (SC) formulation of Entyvio (vedolizumab), a gut-selective biologic for use as maintenance therapy in adults with moderately to severely active ulcerative colitis (UC) or Crohn’s disease (CD). Entyvio SC is available in both a pre-filled syringe and a pre-filled pen.
  • Terumo Corporation is a pioneer in hypodermic needle innovation. The company offers a comprehensive platform of precision-engineered needle and needle stick prevention technologies ready for the most challenging applications and high-throughput processing environments. The company helps design and deliver safer, less painful injections to ensure the therapeutic success of the drug product. Some of its products include the Nanopass® 34G Needle for Pen Injectors, the Neolus Needles, SurGuard­® Safety Hypodermic Needles, the SurGuard® 3 Safety Hypodermic Needles, and the Terumo 3-Part Syringe.
  • In May 2021, Crossject announced further strengthening of its partnership with long-term collaborator Cenexi to ramp up industrial-scale manufacturing of the ZENEO® needle-free auto-injection. With this announcement, Cenexi strengthened its positioning on innovation and sterile manufacturing expertise thanks to its human-scale agility, and its recognized skills in pharmaceutical development.

Report Scope

Report Attribute Details
Market Value in 2022 US$ 3,878 Million
Market Value in 2032 US$ 10,814.47 Million
Growth Rate CAGR of 10.8% from 2022 to 2032
Base Year for Estimation 2021
Historical Data 2017 to 2021
Forecast Period 2022 to 2032
Quantitative Units Revenue in USD Billion and CAGR from 2022 to 2032
Report Coverage Revenue Forecast, Volume Forecast, Company Ranking, Competitive Landscape, Growth Factors, Trends, and Pricing Analysis
Segments Covered
  • Method
  • Application
  • End User
  • Region
Regions Covered
  • North America
  • Latin America
  • Europe
  • South Asia
  • East Asia
  • Oceania
  • Middle East & Africa
Key Countries Profiled
  • The USA
  • Canada
  • Brazil
  • Mexico
  • Germany
  • The United Kingdom
  • France
  • Spain
  • Italy
  • India
  • Malaysia
  • Singapore
  • Thailand
  • China
  • Japan
  • South Korea
  • Australia
  • New Zealand
  • GCC
  • South Africa
  • Israel
Key Companies Profiled
  • Becton Dickinson
  • Cardinal Health
  • West Pharmaceuticals Services
  • Terumo Corporation
  • Nanopass
  • Pharmajet
  • Idevax
  • Enusung
  • Crossject
  • Hindustan Syringes and Medical Devices
Customization Available Upon Request

Key Segments Profiled in the Intradermal Injection Market Industry Survey

Intradermal Injection Market by Method:

  • Normal Sized Needles
  • Short Needle
    • Intradermal Microinjection
    • Microneedle Arrays
    • Tattoo Devices
  • Without Needle
    • Intradermal Liquid Jet Devices and
    • Ballistic Intradermal Injectors

Intradermal Injection Market by Application:

  • Tuberculin Skin Test
  • Allergy Test
  • Local Aesthetics
  • Others

Intradermal Injection Market by End User:

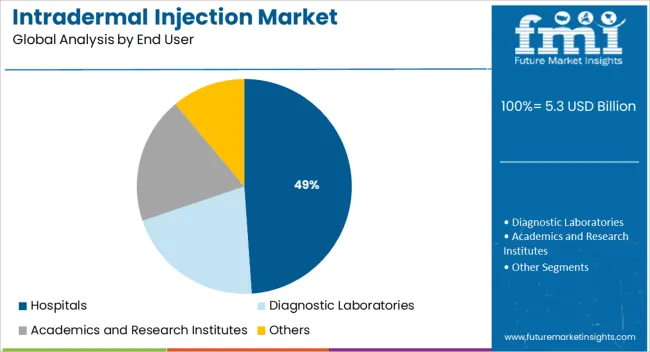
  • Hospitals
  • Diagnostic Laboratories
  • Academics and Research Institutes
  • Others

Intradermal Injection Market by Region:

  • North America
  • Europe
  • South Asia
  • East Asia
  • Oceania
  • Latin America
  • Middle East and Africa (MEA)

Frequently Asked Questions

What is the anticipated growth of the market Intradermal Injection until 2032?

FMI projects the global Intradermal Injection market to expand at a 10.8% value CAGR by 2032.

What is the estimated market value of the Intradermal Injection market expected in 2022?

The global Intradermal Injection market is estimated at a market value of US$ 2.5 Billion.

What is the estimated market value of the Intradermal Injection market expected in 2032?

The global Intradermal Injection market is expected to garner a market value of US$ 10814.47 Million.

Which region is forecast to be the most lucrative for Intradermal Injection market growth?

FMI has projected North America to be one of the key regions for the Intradermal Injection market.

Which are some prominent Intradermal Injection manufacturers?

Becton Dickinson, Cardinal Health, West Pharmaceuticals services, Terumo Corporation, Nanopass, Pharmajet, Idevax, Enusung, Crossject, and Hindustan Syringes and Medical Devices.

Table of Content

1. Executive Summary

    1.1. Global Market Outlook

    1.2. Demand-side Trends

    1.3. Supply-side Trends

    1.4. Technology Roadmap Analysis

    1.5. Analysis and Recommendations

2. Market Overview

    2.1. Market Coverage / Taxonomy

    2.2. Market Definition / Scope / Limitations

3. Market Background

    3.1. Market Dynamics

        3.1.1. Drivers

        3.1.2. Restraints

        3.1.3. Opportunity

        3.1.4. Trends

    3.2. Scenario Forecast

        3.2.1. Demand in Optimistic Scenario

        3.2.2. Demand in Likely Scenario

        3.2.3. Demand in Conservative Scenario

    3.3. Opportunity Map Analysis

    3.4. Investment Feasibility Matrix

    3.5. PESTLE and Porter’s Analysis

    3.6. Regulatory Landscape

        3.6.1. By Key Regions

        3.6.2. By Key Countries

    3.7. Regional Parent Market Outlook

4. Global Market Analysis 2017 to 2021 and Forecast, 2022 to 2032

    4.1. Historical Market Size Value (US$ million) Analysis, 2017 to 2021

    4.2. Current and Future Market Size Value (US$ million) Projections, 2022 to 2032

        4.2.1. Y-o-Y Growth Trend Analysis

        4.2.2. Absolute $ Opportunity Analysis

5. Global Market Analysis 2017 to 2021 and Forecast 2022 to 2032, By Method

    5.1. Introduction / Key Findings

    5.2. Historical Market Size Value (US$ million) Analysis By Method, 2017 to 2021

    5.3. Current and Future Market Size Value (US$ million) Analysis and Forecast By Method, 2022 to 2032

        5.3.1. Normal Sized Needles

        5.3.2. Short Needle

            5.3.2.1. Intradermal Microinjection

            5.3.2.2. Microneedle Arrays

            5.3.2.3. Tattoo Devices

        5.3.3. Without Needle

            5.3.3.1. Intradermal Liquid Jet Devices

            5.3.3.2. Ballistic Intradermal Injectors

    5.4. Y-o-Y Growth Trend Analysis By Method, 2017 to 2021

    5.5. Absolute $ Opportunity Analysis By Method, 2022 to 2032

6. Global Market Analysis 2017 to 2021 and Forecast 2022 to 2032, By Application

    6.1. Introduction / Key Findings

    6.2. Historical Market Size Value (US$ million) Analysis By Application, 2017 to 2021

    6.3. Current and Future Market Size Value (US$ million) Analysis and Forecast By Application, 2022 to 2032

        6.3.1. Tuberculin Skin Test

        6.3.2. Allergy Test

        6.3.3. Local Aesthetics

        6.3.4. Others

    6.4. Y-o-Y Growth Trend Analysis By Application, 2017 to 2021

    6.5. Absolute $ Opportunity Analysis By Application, 2022 to 2032

7. Global Market Analysis 2017 to 2021 and Forecast 2022 to 2032, By End User

    7.1. Introduction / Key Findings

    7.2. Historical Market Size Value (US$ million) Analysis By End User, 2017 to 2021

    7.3. Current and Future Market Size Value (US$ million) Analysis and Forecast By End User, 2022 to 2032

        7.3.1. Hospitals

        7.3.2. Diagnostic Laboratories

        7.3.3. Academics And Research Institutes

        7.3.4. Others

    7.4. Y-o-Y Growth Trend Analysis By End User, 2017 to 2021

    7.5. Absolute $ Opportunity Analysis By End User, 2022 to 2032

8. Global Market Analysis 2017 to 2021 and Forecast 2022 to 2032, By Region

    8.1. Introduction

    8.2. Historical Market Size Value (US$ million) Analysis By Region, 2017 to 2021

    8.3. Current Market Size Value (US$ million) Analysis and Forecast By Region, 2022 to 2032

        8.3.1. North America

        8.3.2. Latin America

        8.3.3. Europe

        8.3.4. South Asia

        8.3.5. East Asia

        8.3.6. Oceania

        8.3.7. Middle East and Africa (MEA)

    8.4. Market Attractiveness Analysis By Region

9. North America Market Analysis 2017 to 2021 and Forecast 2022 to 2032, By Country

    9.1. Historical Market Size Value (US$ million) Trend Analysis By Market Taxonomy, 2017 to 2021

    9.2. Market Size Value (US$ million) Forecast By Market Taxonomy, 2022 to 2032

        9.2.1. By Country

            9.2.1.1. The USA

            9.2.1.2. Canada

        9.2.2. By Method

        9.2.3. By Application

        9.2.4. By End User

    9.3. Market Attractiveness Analysis

        9.3.1. By Country

        9.3.2. By Method

        9.3.3. By Application

        9.3.4. By End User

    9.4. Key Takeaways

10. Latin America Market Analysis 2017 to 2021 and Forecast 2022 to 2032, By Country

    10.1. Historical Market Size Value (US$ million) Trend Analysis By Market Taxonomy, 2017 to 2021

    10.2. Market Size Value (US$ million) Forecast By Market Taxonomy, 2022 to 2032

        10.2.1. By Country

            10.2.1.1. Brazil

            10.2.1.2. Mexico

            10.2.1.3. Rest of Latin America

        10.2.2. By Method

        10.2.3. By Application

        10.2.4. By End User

    10.3. Market Attractiveness Analysis

        10.3.1. By Country

        10.3.2. By Method

        10.3.3. By Application

        10.3.4. By End User

    10.4. Key Takeaways

11. Europe Market Analysis 2017 to 2021 and Forecast 2022 to 2032, By Country

    11.1. Historical Market Size Value (US$ million) Trend Analysis By Market Taxonomy, 2017 to 2021

    11.2. Market Size Value (US$ million) Forecast By Market Taxonomy, 2022 to 2032

        11.2.1. By Country

            11.2.1.1. Germany

            11.2.1.2. United Kingdom

            11.2.1.3. France

            11.2.1.4. Spain

            11.2.1.5. Italy

            11.2.1.6. Rest of Europe

        11.2.2. By Method

        11.2.3. By Application

        11.2.4. By End User

    11.3. Market Attractiveness Analysis

        11.3.1. By Country

        11.3.2. By Method

        11.3.3. By Application

        11.3.4. By End User

    11.4. Key Takeaways

12. South Asia Market Analysis 2017 to 2021 and Forecast 2022 to 2032, By Country

    12.1. Historical Market Size Value (US$ million) Trend Analysis By Market Taxonomy, 2017 to 2021

    12.2. Market Size Value (US$ million) Forecast By Market Taxonomy, 2022 to 2032

        12.2.1. By Country

            12.2.1.1. India

            12.2.1.2. Malaysia

            12.2.1.3. Singapore

            12.2.1.4. Thailand

            12.2.1.5. Rest of South Asia

        12.2.2. By Method

        12.2.3. By Application

        12.2.4. By End User

    12.3. Market Attractiveness Analysis

        12.3.1. By Country

        12.3.2. By Method

        12.3.3. By Application

        12.3.4. By End User

    12.4. Key Takeaways

13. East Asia Market Analysis 2017 to 2021 and Forecast 2022 to 2032, By Country

    13.1. Historical Market Size Value (US$ million) Trend Analysis By Market Taxonomy, 2017 to 2021

    13.2. Market Size Value (US$ million) Forecast By Market Taxonomy, 2022 to 2032

        13.2.1. By Country

            13.2.1.1. China

            13.2.1.2. Japan

            13.2.1.3. South Korea

        13.2.2. By Method

        13.2.3. By Application

        13.2.4. By End User

    13.3. Market Attractiveness Analysis

        13.3.1. By Country

        13.3.2. By Method

        13.3.3. By Application

        13.3.4. By End User

    13.4. Key Takeaways

14. Oceania Market Analysis 2017 to 2021 and Forecast 2022 to 2032, By Country

    14.1. Historical Market Size Value (US$ million) Trend Analysis By Market Taxonomy, 2017 to 2021

    14.2. Market Size Value (US$ million) Forecast By Market Taxonomy, 2022 to 2032

        14.2.1. By Country

            14.2.1.1. Australia

            14.2.1.2. New Zealand

        14.2.2. By Method

        14.2.3. By Application

        14.2.4. By End User

    14.3. Market Attractiveness Analysis

        14.3.1. By Country

        14.3.2. By Method

        14.3.3. By Application

        14.3.4. By End User

    14.4. Key Takeaways

15. MEA Market Analysis 2017 to 2021 and Forecast 2022 to 2032, By Country

    15.1. Historical Market Size Value (US$ million) Trend Analysis By Market Taxonomy, 2017 to 2021

    15.2. Market Size Value (US$ million) Forecast By Market Taxonomy, 2022 to 2032

        15.2.1. By Country

            15.2.1.1. GCC Countries

            15.2.1.2. South Africa

            15.2.1.3. Israel

            15.2.1.4. Rest of MEA

        15.2.2. By Method

        15.2.3. By Application

        15.2.4. By End User

    15.3. Market Attractiveness Analysis

        15.3.1. By Country

        15.3.2. By Method

        15.3.3. By Application

        15.3.4. By End User

    15.4. Key Takeaways

16. Key Countries Market Analysis

    16.1. The USA

        16.1.1. Pricing Analysis

        16.1.2. Market Share Analysis, 2021

            16.1.2.1. By Method

            16.1.2.2. By Application

            16.1.2.3. By End User

    16.2. Canada

        16.2.1. Pricing Analysis

        16.2.2. Market Share Analysis, 2021

            16.2.2.1. By Method

            16.2.2.2. By Application

            16.2.2.3. By End User

    16.3. Brazil

        16.3.1. Pricing Analysis

        16.3.2. Market Share Analysis, 2021

            16.3.2.1. By Method

            16.3.2.2. By Application

            16.3.2.3. By End User

    16.4. Mexico

        16.4.1. Pricing Analysis

        16.4.2. Market Share Analysis, 2021

            16.4.2.1. By Method

            16.4.2.2. By Application

            16.4.2.3. By End User

    16.5. Germany

        16.5.1. Pricing Analysis

        16.5.2. Market Share Analysis, 2021

            16.5.2.1. By Method

            16.5.2.2. By Application

            16.5.2.3. By End User

    16.6. The United Kingdom

        16.6.1. Pricing Analysis

        16.6.2. Market Share Analysis, 2021

            16.6.2.1. By Method

            16.6.2.2. By Application

            16.6.2.3. By End User

    16.7. France

        16.7.1. Pricing Analysis

        16.7.2. Market Share Analysis, 2021

            16.7.2.1. By Method

            16.7.2.2. By Application

            16.7.2.3. By End User

    16.8. Spain

        16.8.1. Pricing Analysis

        16.8.2. Market Share Analysis, 2021

            16.8.2.1. By Method

            16.8.2.2. By Application

            16.8.2.3. By End User

    16.9. Italy

        16.9.1. Pricing Analysis

        16.9.2. Market Share Analysis, 2021

            16.9.2.1. By Method

            16.9.2.2. By Application

            16.9.2.3. By End User

    16.10. India

        16.10.1. Pricing Analysis

        16.10.2. Market Share Analysis, 2021

            16.10.2.1. By Method

            16.10.2.2. By Application

            16.10.2.3. By End User

    16.11. Malaysia

        16.11.1. Pricing Analysis

        16.11.2. Market Share Analysis, 2021

            16.11.2.1. By Method

            16.11.2.2. By Application

            16.11.2.3. By End User

    16.12. Singapore

        16.12.1. Pricing Analysis

        16.12.2. Market Share Analysis, 2021

            16.12.2.1. By Method

            16.12.2.2. By Application

            16.12.2.3. By End User

    16.13. Thailand

        16.13.1. Pricing Analysis

        16.13.2. Market Share Analysis, 2021

            16.13.2.1. By Method

            16.13.2.2. By Application

            16.13.2.3. By End User

    16.14. China

        16.14.1. Pricing Analysis

        16.14.2. Market Share Analysis, 2021

            16.14.2.1. By Method

            16.14.2.2. By Application

            16.14.2.3. By End User

    16.15. Japan

        16.15.1. Pricing Analysis

        16.15.2. Market Share Analysis, 2021

            16.15.2.1. By Method

            16.15.2.2. By Application

            16.15.2.3. By End User

    16.16. South Korea

        16.16.1. Pricing Analysis

        16.16.2. Market Share Analysis, 2021

            16.16.2.1. By Method

            16.16.2.2. By Application

            16.16.2.3. By End User

    16.17. Australia

        16.17.1. Pricing Analysis

        16.17.2. Market Share Analysis, 2021

            16.17.2.1. By Method

            16.17.2.2. By Application

            16.17.2.3. By End User

    16.18. New Zealand

        16.18.1. Pricing Analysis

        16.18.2. Market Share Analysis, 2021

            16.18.2.1. By Method

            16.18.2.2. By Application

            16.18.2.3. By End User

    16.19. GCC Countries

        16.19.1. Pricing Analysis

        16.19.2. Market Share Analysis, 2021

            16.19.2.1. By Method

            16.19.2.2. By Application

            16.19.2.3. By End User

    16.20. South Africa

        16.20.1. Pricing Analysis

        16.20.2. Market Share Analysis, 2021

            16.20.2.1. By Method

            16.20.2.2. By Application

            16.20.2.3. By End User

    16.21. Israel

        16.21.1. Pricing Analysis

        16.21.2. Market Share Analysis, 2021

            16.21.2.1. By Method

            16.21.2.2. By Application

            16.21.2.3. By End User

17. Market Structure Analysis

    17.1. Competition Dashboard

    17.2. Competition Benchmarking

    17.3. Market Share Analysis of Top Players

        17.3.1. By Regional

        17.3.2. By Method

        17.3.3. By Application

        17.3.4. By End User

18. Competition Analysis

    18.1. Competition Deep Dive

        18.1.1. Becton Dickinson

            18.1.1.1. Overview

            18.1.1.2. Product Portfolio

            18.1.1.3. Profitability by Market Segments

            18.1.1.4. Sales Footprint

            18.1.1.5. Strategy Overview

                18.1.1.5.1. Marketing Strategy

        18.1.2. Cardinal Health

            18.1.2.1. Overview

            18.1.2.2. Product Portfolio

            18.1.2.3. Profitability by Market Segments

            18.1.2.4. Sales Footprint

            18.1.2.5. Strategy Overview

                18.1.2.5.1. Marketing Strategy

        18.1.3. West Pharmaceuticals services

            18.1.3.1. Overview

            18.1.3.2. Product Portfolio

            18.1.3.3. Profitability by Market Segments

            18.1.3.4. Sales Footprint

            18.1.3.5. Strategy Overview

                18.1.3.5.1. Marketing Strategy

        18.1.4. Terumo Corporation

            18.1.4.1. Overview

            18.1.4.2. Product Portfolio

            18.1.4.3. Profitability by Market Segments

            18.1.4.4. Sales Footprint

            18.1.4.5. Strategy Overview

                18.1.4.5.1. Marketing Strategy

        18.1.5. Nanopass

            18.1.5.1. Overview

            18.1.5.2. Product Portfolio

            18.1.5.3. Profitability by Market Segments

            18.1.5.4. Sales Footprint

            18.1.5.5. Strategy Overview

                18.1.5.5.1. Marketing Strategy

        18.1.6. Pharmajet

            18.1.6.1. Overview

            18.1.6.2. Product Portfolio

            18.1.6.3. Profitability by Market Segments

            18.1.6.4. Sales Footprint

            18.1.6.5. Strategy Overview

                18.1.6.5.1. Marketing Strategy

        18.1.7. Idevax

            18.1.7.1. Overview

            18.1.7.2. Product Portfolio

            18.1.7.3. Profitability by Market Segments

            18.1.7.4. Sales Footprint

            18.1.7.5. Strategy Overview

                18.1.7.5.1. Marketing Strategy

        18.1.8. Enusung

            18.1.8.1. Overview

            18.1.8.2. Product Portfolio

            18.1.8.3. Profitability by Market Segments

            18.1.8.4. Sales Footprint

            18.1.8.5. Strategy Overview

                18.1.8.5.1. Marketing Strategy

        18.1.9. Crossject

            18.1.9.1. Overview

            18.1.9.2. Product Portfolio

            18.1.9.3. Profitability by Market Segments

            18.1.9.4. Sales Footprint

            18.1.9.5. Strategy Overview

                18.1.9.5.1. Marketing Strategy

        18.1.10. Hindustan Syringes

            18.1.10.1. Overview

            18.1.10.2. Product Portfolio

            18.1.10.3. Profitability by Market Segments

            18.1.10.4. Sales Footprint

            18.1.10.5. Strategy Overview

                18.1.10.5.1. Marketing Strategy

19. Assumptions & Acronyms Used

20. Research Methodology

Don't pay for what you don't need

Customize your report by selecting specific countries or regions and save 30%!

List of Tables

Table 1: Global Market Value (US$ million) Forecast by Region, 2017 to 2032

Table 2: Global Market Value (US$ million) Forecast by Method, 2017 to 2032

Table 3: Global Market Value (US$ million) Forecast by Application, 2017 to 2032

Table 4: Global Market Value (US$ million) Forecast by End User, 2017 to 2032

Table 5: North America Market Value (US$ million) Forecast by Country, 2017 to 2032

Table 6: North America Market Value (US$ million) Forecast by Method, 2017 to 2032

Table 7: North America Market Value (US$ million) Forecast by Application, 2017 to 2032

Table 8: North America Market Value (US$ million) Forecast by End User, 2017 to 2032

Table 9: Latin America Market Value (US$ million) Forecast by Country, 2017 to 2032

Table 10: Latin America Market Value (US$ million) Forecast by Method, 2017 to 2032

Table 11: Latin America Market Value (US$ million) Forecast by Application, 2017 to 2032

Table 12: Latin America Market Value (US$ million) Forecast by End User, 2017 to 2032

Table 13: Europe Market Value (US$ million) Forecast by Country, 2017 to 2032

Table 14: Europe Market Value (US$ million) Forecast by Method, 2017 to 2032

Table 15: Europe Market Value (US$ million) Forecast by Application, 2017 to 2032

Table 16: Europe Market Value (US$ million) Forecast by End User, 2017 to 2032

Table 17: South Asia Market Value (US$ million) Forecast by Country, 2017 to 2032

Table 18: South Asia Market Value (US$ million) Forecast by Method, 2017 to 2032

Table 19: South Asia Market Value (US$ million) Forecast by Application, 2017 to 2032

Table 20: South Asia Market Value (US$ million) Forecast by End User, 2017 to 2032

Table 21: East Asia Market Value (US$ million) Forecast by Country, 2017 to 2032

Table 22: East Asia Market Value (US$ million) Forecast by Method, 2017 to 2032

Table 23: East Asia Market Value (US$ million) Forecast by Application, 2017 to 2032

Table 24: East Asia Market Value (US$ million) Forecast by End User, 2017 to 2032

Table 25: Oceania Market Value (US$ million) Forecast by Country, 2017 to 2032

Table 26: Oceania Market Value (US$ million) Forecast by Method, 2017 to 2032

Table 27: Oceania Market Value (US$ million) Forecast by Application, 2017 to 2032

Table 28: Oceania Market Value (US$ million) Forecast by End User, 2017 to 2032

Table 29: MEA Market Value (US$ million) Forecast by Country, 2017 to 2032

Table 30: MEA Market Value (US$ million) Forecast by Method, 2017 to 2032

Table 31: MEA Market Value (US$ million) Forecast by Application, 2017 to 2032

Table 32: MEA Market Value (US$ million) Forecast by End User, 2017 to 2032
Sabyasachi Ghosh
Sabyasachi Ghosh

Principal Consultant

Talk to Analyst

Find your sweet spots for generating winning opportunities in this market.

List of Charts

Figure 1: Global Market Value (US$ million) by Method, 2022 to 2032

Figure 2: Global Market Value (US$ million) by Application, 2022 to 2032

Figure 3: Global Market Value (US$ million) by End User, 2022 to 2032

Figure 4: Global Market Value (US$ million) by Region, 2022 to 2032

Figure 5: Global Market Value (US$ million) Analysis by Region, 2017 to 2032

Figure 6: Global Market Value Share (%) and BPS Analysis by Region, 2022 to 2032

Figure 7: Global Market Y-o-Y Growth (%) Projections by Region, 2022 to 2032

Figure 8: Global Market Value (US$ million) Analysis by Method, 2017 to 2032

Figure 9: Global Market Value Share (%) and BPS Analysis by Method, 2022 to 2032

Figure 10: Global Market Y-o-Y Growth (%) Projections by Method, 2022 to 2032

Figure 11: Global Market Value (US$ million) Analysis by Application, 2017 to 2032

Figure 12: Global Market Value Share (%) and BPS Analysis by Application, 2022 to 2032

Figure 13: Global Market Y-o-Y Growth (%) Projections by Application, 2022 to 2032

Figure 14: Global Market Value (US$ million) Analysis by End User, 2017 to 2032

Figure 15: Global Market Value Share (%) and BPS Analysis by End User, 2022 to 2032

Figure 16: Global Market Y-o-Y Growth (%) Projections by End User, 2022 to 2032

Figure 17: Global Market Attractiveness by Method, 2022 to 2032

Figure 18: Global Market Attractiveness by Application, 2022 to 2032

Figure 19: Global Market Attractiveness by End User, 2022 to 2032

Figure 20: Global Market Attractiveness by Region, 2022 to 2032

Figure 21: North America Market Value (US$ million) by Method, 2022 to 2032

Figure 22: North America Market Value (US$ million) by Application, 2022 to 2032

Figure 23: North America Market Value (US$ million) by End User, 2022 to 2032

Figure 24: North America Market Value (US$ million) by Country, 2022 to 2032

Figure 25: North America Market Value (US$ million) Analysis by Country, 2017 to 2032

Figure 26: North America Market Value Share (%) and BPS Analysis by Country, 2022 to 2032

Figure 27: North America Market Y-o-Y Growth (%) Projections by Country, 2022 to 2032

Figure 28: North America Market Value (US$ million) Analysis by Method, 2017 to 2032

Figure 29: North America Market Value Share (%) and BPS Analysis by Method, 2022 to 2032

Figure 30: North America Market Y-o-Y Growth (%) Projections by Method, 2022 to 2032

Figure 31: North America Market Value (US$ million) Analysis by Application, 2017 to 2032

Figure 32: North America Market Value Share (%) and BPS Analysis by Application, 2022 to 2032

Figure 33: North America Market Y-o-Y Growth (%) Projections by Application, 2022 to 2032

Figure 34: North America Market Value (US$ million) Analysis by End User, 2017 to 2032

Figure 35: North America Market Value Share (%) and BPS Analysis by End User, 2022 to 2032

Figure 36: North America Market Y-o-Y Growth (%) Projections by End User, 2022 to 2032

Figure 37: North America Market Attractiveness by Method, 2022 to 2032

Figure 38: North America Market Attractiveness by Application, 2022 to 2032

Figure 39: North America Market Attractiveness by End User, 2022 to 2032

Figure 40: North America Market Attractiveness by Country, 2022 to 2032

Figure 41: Latin America Market Value (US$ million) by Method, 2022 to 2032

Figure 42: Latin America Market Value (US$ million) by Application, 2022 to 2032

Figure 43: Latin America Market Value (US$ million) by End User, 2022 to 2032

Figure 44: Latin America Market Value (US$ million) by Country, 2022 to 2032

Figure 45: Latin America Market Value (US$ million) Analysis by Country, 2017 to 2032

Figure 46: Latin America Market Value Share (%) and BPS Analysis by Country, 2022 to 2032

Figure 47: Latin America Market Y-o-Y Growth (%) Projections by Country, 2022 to 2032

Figure 48: Latin America Market Value (US$ million) Analysis by Method, 2017 to 2032

Figure 49: Latin America Market Value Share (%) and BPS Analysis by Method, 2022 to 2032

Figure 50: Latin America Market Y-o-Y Growth (%) Projections by Method, 2022 to 2032

Figure 51: Latin America Market Value (US$ million) Analysis by Application, 2017 to 2032

Figure 52: Latin America Market Value Share (%) and BPS Analysis by Application, 2022 to 2032

Figure 53: Latin America Market Y-o-Y Growth (%) Projections by Application, 2022 to 2032

Figure 54: Latin America Market Value (US$ million) Analysis by End User, 2017 to 2032

Figure 55: Latin America Market Value Share (%) and BPS Analysis by End User, 2022 to 2032

Figure 56: Latin America Market Y-o-Y Growth (%) Projections by End User, 2022 to 2032

Figure 57: Latin America Market Attractiveness by Method, 2022 to 2032

Figure 58: Latin America Market Attractiveness by Application, 2022 to 2032

Figure 59: Latin America Market Attractiveness by End User, 2022 to 2032

Figure 60: Latin America Market Attractiveness by Country, 2022 to 2032

Figure 61: Europe Market Value (US$ million) by Method, 2022 to 2032

Figure 62: Europe Market Value (US$ million) by Application, 2022 to 2032

Figure 63: Europe Market Value (US$ million) by End User, 2022 to 2032

Figure 64: Europe Market Value (US$ million) by Country, 2022 to 2032

Figure 65: Europe Market Value (US$ million) Analysis by Country, 2017 to 2032

Figure 66: Europe Market Value Share (%) and BPS Analysis by Country, 2022 to 2032

Figure 67: Europe Market Y-o-Y Growth (%) Projections by Country, 2022 to 2032

Figure 68: Europe Market Value (US$ million) Analysis by Method, 2017 to 2032

Figure 69: Europe Market Value Share (%) and BPS Analysis by Method, 2022 to 2032

Figure 70: Europe Market Y-o-Y Growth (%) Projections by Method, 2022 to 2032

Figure 71: Europe Market Value (US$ million) Analysis by Application, 2017 to 2032

Figure 72: Europe Market Value Share (%) and BPS Analysis by Application, 2022 to 2032

Figure 73: Europe Market Y-o-Y Growth (%) Projections by Application, 2022 to 2032

Figure 74: Europe Market Value (US$ million) Analysis by End User, 2017 to 2032

Figure 75: Europe Market Value Share (%) and BPS Analysis by End User, 2022 to 2032

Figure 76: Europe Market Y-o-Y Growth (%) Projections by End User, 2022 to 2032

Figure 77: Europe Market Attractiveness by Method, 2022 to 2032

Figure 78: Europe Market Attractiveness by Application, 2022 to 2032

Figure 79: Europe Market Attractiveness by End User, 2022 to 2032

Figure 80: Europe Market Attractiveness by Country, 2022 to 2032

Figure 81: South Asia Market Value (US$ million) by Method, 2022 to 2032

Figure 82: South Asia Market Value (US$ million) by Application, 2022 to 2032

Figure 83: South Asia Market Value (US$ million) by End User, 2022 to 2032

Figure 84: South Asia Market Value (US$ million) by Country, 2022 to 2032

Figure 85: South Asia Market Value (US$ million) Analysis by Country, 2017 to 2032

Figure 86: South Asia Market Value Share (%) and BPS Analysis by Country, 2022 to 2032

Figure 87: South Asia Market Y-o-Y Growth (%) Projections by Country, 2022 to 2032

Figure 88: South Asia Market Value (US$ million) Analysis by Method, 2017 to 2032

Figure 89: South Asia Market Value Share (%) and BPS Analysis by Method, 2022 to 2032

Figure 90: South Asia Market Y-o-Y Growth (%) Projections by Method, 2022 to 2032

Figure 91: South Asia Market Value (US$ million) Analysis by Application, 2017 to 2032

Figure 92: South Asia Market Value Share (%) and BPS Analysis by Application, 2022 to 2032

Figure 93: South Asia Market Y-o-Y Growth (%) Projections by Application, 2022 to 2032

Figure 94: South Asia Market Value (US$ million) Analysis by End User, 2017 to 2032

Figure 95: South Asia Market Value Share (%) and BPS Analysis by End User, 2022 to 2032

Figure 96: South Asia Market Y-o-Y Growth (%) Projections by End User, 2022 to 2032

Figure 97: South Asia Market Attractiveness by Method, 2022 to 2032

Figure 98: South Asia Market Attractiveness by Application, 2022 to 2032

Figure 99: South Asia Market Attractiveness by End User, 2022 to 2032

Figure 100: South Asia Market Attractiveness by Country, 2022 to 2032

Figure 101: East Asia Market Value (US$ million) by Method, 2022 to 2032

Figure 102: East Asia Market Value (US$ million) by Application, 2022 to 2032

Figure 103: East Asia Market Value (US$ million) by End User, 2022 to 2032

Figure 104: East Asia Market Value (US$ million) by Country, 2022 to 2032

Figure 105: East Asia Market Value (US$ million) Analysis by Country, 2017 to 2032

Figure 106: East Asia Market Value Share (%) and BPS Analysis by Country, 2022 to 2032

Figure 107: East Asia Market Y-o-Y Growth (%) Projections by Country, 2022 to 2032

Figure 108: East Asia Market Value (US$ million) Analysis by Method, 2017 to 2032

Figure 109: East Asia Market Value Share (%) and BPS Analysis by Method, 2022 to 2032

Figure 110: East Asia Market Y-o-Y Growth (%) Projections by Method, 2022 to 2032

Figure 111: East Asia Market Value (US$ million) Analysis by Application, 2017 to 2032

Figure 112: East Asia Market Value Share (%) and BPS Analysis by Application, 2022 to 2032

Figure 113: East Asia Market Y-o-Y Growth (%) Projections by Application, 2022 to 2032

Figure 114: East Asia Market Value (US$ million) Analysis by End User, 2017 to 2032

Figure 115: East Asia Market Value Share (%) and BPS Analysis by End User, 2022 to 2032

Figure 116: East Asia Market Y-o-Y Growth (%) Projections by End User, 2022 to 2032

Figure 117: East Asia Market Attractiveness by Method, 2022 to 2032

Figure 118: East Asia Market Attractiveness by Application, 2022 to 2032

Figure 119: East Asia Market Attractiveness by End User, 2022 to 2032

Figure 120: East Asia Market Attractiveness by Country, 2022 to 2032

Figure 121: Oceania Market Value (US$ million) by Method, 2022 to 2032

Figure 122: Oceania Market Value (US$ million) by Application, 2022 to 2032

Figure 123: Oceania Market Value (US$ million) by End User, 2022 to 2032

Figure 124: Oceania Market Value (US$ million) by Country, 2022 to 2032

Figure 125: Oceania Market Value (US$ million) Analysis by Country, 2017 to 2032

Figure 126: Oceania Market Value Share (%) and BPS Analysis by Country, 2022 to 2032

Figure 127: Oceania Market Y-o-Y Growth (%) Projections by Country, 2022 to 2032

Figure 128: Oceania Market Value (US$ million) Analysis by Method, 2017 to 2032

Figure 129: Oceania Market Value Share (%) and BPS Analysis by Method, 2022 to 2032

Figure 130: Oceania Market Y-o-Y Growth (%) Projections by Method, 2022 to 2032

Figure 131: Oceania Market Value (US$ million) Analysis by Application, 2017 to 2032

Figure 132: Oceania Market Value Share (%) and BPS Analysis by Application, 2022 to 2032

Figure 133: Oceania Market Y-o-Y Growth (%) Projections by Application, 2022 to 2032

Figure 134: Oceania Market Value (US$ million) Analysis by End User, 2017 to 2032

Figure 135: Oceania Market Value Share (%) and BPS Analysis by End User, 2022 to 2032

Figure 136: Oceania Market Y-o-Y Growth (%) Projections by End User, 2022 to 2032

Figure 137: Oceania Market Attractiveness by Method, 2022 to 2032

Figure 138: Oceania Market Attractiveness by Application, 2022 to 2032

Figure 139: Oceania Market Attractiveness by End User, 2022 to 2032

Figure 140: Oceania Market Attractiveness by Country, 2022 to 2032

Figure 141: MEA Market Value (US$ million) by Method, 2022 to 2032

Figure 142: MEA Market Value (US$ million) by Application, 2022 to 2032

Figure 143: MEA Market Value (US$ million) by End User, 2022 to 2032

Figure 144: MEA Market Value (US$ million) by Country, 2022 to 2032

Figure 145: MEA Market Value (US$ million) Analysis by Country, 2017 to 2032

Figure 146: MEA Market Value Share (%) and BPS Analysis by Country, 2022 to 2032

Figure 147: MEA Market Y-o-Y Growth (%) Projections by Country, 2022 to 2032

Figure 148: MEA Market Value (US$ million) Analysis by Method, 2017 to 2032

Figure 149: MEA Market Value Share (%) and BPS Analysis by Method, 2022 to 2032

Figure 150: MEA Market Y-o-Y Growth (%) Projections by Method, 2022 to 2032

Figure 151: MEA Market Value (US$ million) Analysis by Application, 2017 to 2032

Figure 152: MEA Market Value Share (%) and BPS Analysis by Application, 2022 to 2032

Figure 153: MEA Market Y-o-Y Growth (%) Projections by Application, 2022 to 2032

Figure 154: MEA Market Value (US$ million) Analysis by End User, 2017 to 2032

Figure 155: MEA Market Value Share (%) and BPS Analysis by End User, 2022 to 2032

Figure 156: MEA Market Y-o-Y Growth (%) Projections by End User, 2022 to 2032

Figure 157: MEA Market Attractiveness by Method, 2022 to 2032

Figure 158: MEA Market Attractiveness by Application, 2022 to 2032

Figure 159: MEA Market Attractiveness by End User, 2022 to 2032

Figure 160: MEA Market Attractiveness by Country, 2022 to 2032

Recommendations

Healthcare

Injectable Drug Delivery Market

Published : April 2024

Healthcare

Injectable Drug Market

Published : March 2024

Packaging

Injection Bottles Market

Published : August 2023

Healthcare

Injection Pen Market

Published : February 2023

Explore Healthcare Insights

View Reports

Intradermal Injection Market