Injection Molding Machines Industry Analysis in India Size and Share Forecast Outlook 2025 to 2035

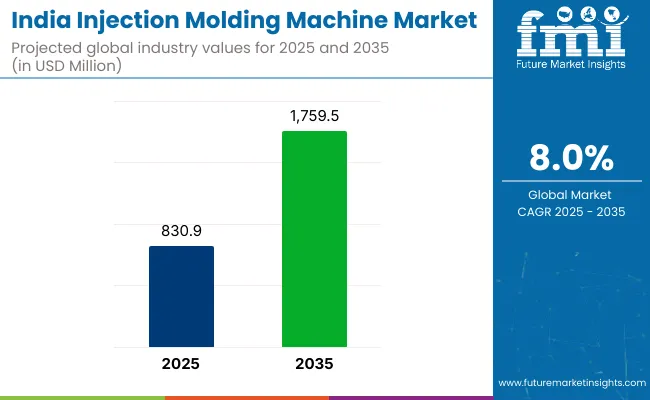
The India injection molding machine market is projected to grow from USD 830.9 million in 2025 to USD 1,759.5 million by 2035, registering a CAGR of 8.0% during the forecast period. Sales in 2024 reached USD 769.3 million. Rapid developments in sectors such as automotive components, medical devices, and consumer durables have contributed to rising equipment installations.
Quick Stats of India Injection Molding Machine Market

  • Market Value (2025): USD 830.9 million
  • Forecast Value (2035): USD 1,759.5 million
  • Forecast CAGR: 8.0%
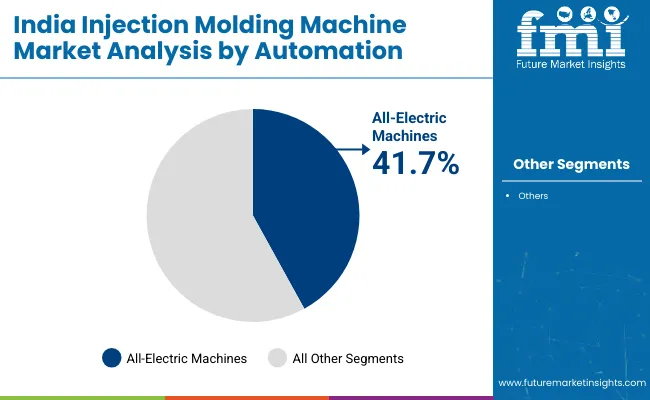
  • Automation Leader in 2025: All-Electric Machines (41.7% market share)
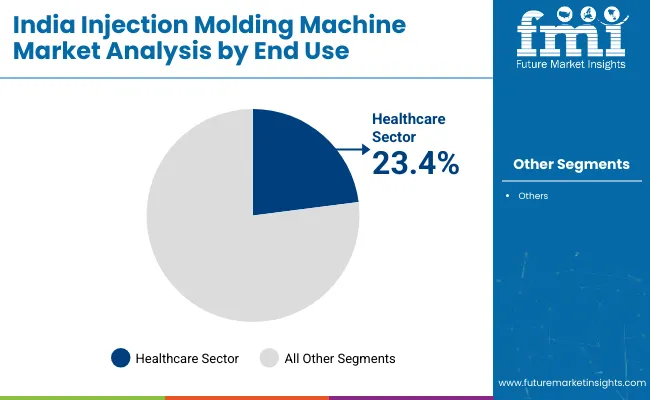
  • Top End Use: Healthcare (23.4% share)

Injection Molding Machines Industry Analysis In India

Metric Value
Industry Value (2025E) USD 830.9 million
Industry Value (2035F) USD 1,759.5 million
CAGR (2025 to 2035) 8.0%

Compact design preferences and energy-efficient machines are being adopted in both Tier 1 and Tier 2 cities, driven by localization and increased capital expenditure in the plastics sector. Additionally, government initiatives supporting industrial clusters and Make in India policies have supported production upgrades across verticals.

Significant advancements in servo-hydraulic systems, multi-component molding, and digital monitoring solutions are being adopted to ensure consistency and reduced downtime in production lines. These innovations are increasingly applied across sectors demanding high-output, low-defect parts-especially in food packaging, electronics, and precision medical components.

Automation solutions with real-time process control are gaining traction, notably among SME plastic processors. The government’s PLI scheme and R&D support for tooling industries are also accelerating digital transformation of molding operations across India. Compliance with BIS and other Indian standards has become mandatory, aligning with the broader global push for energy-efficient industrial equipment. This green transition has been supported through subsidies and government tenders focused on eco-design in manufacturing equipment.

India’s growing export capacity in plastic components and OEM manufacturing is expected to elevate the strategic role of injection molding technologies. Incremental opportunities are expected to be captured through automation, digitization, and tooling innovations. Competitive pricing, customizability for multi-cavity operations, and low maintenance costs are being pursued by Indian and multinational players alike.

Regulatory support such as production-linked incentives (PLIs) and tariff protections have enhanced domestic output. Long-term demand is forecast to remain resilient due to rising infrastructure, electronics, and automotive manufacturing. Strategic acquisitions and localization will likely define the competitive edge.

Analyzing Injection Molding Machines Industry Analysis in India by Top Investment Segment

The market is segmented based on automation, clamping force, material type, end use, and region. By automation, the segmentation includes all-electric, hydraulic, and hybrid injection molding machines, each selected for energy efficiency, precision, or high-pressure capabilities. Clamping force categories include machines with less than 2000 KN and more than 2000 KN, tailored for varying mold sizes and product complexities.

Materials processed include plastic, metal, rubber, and ceramic, allowing applications across lightweight components, structural inserts, and specialty molded parts. End-use industries comprise automotive, packaging, electronics, healthcare, consumer goods, building & construction, and others, where demand is driven by mass production needs and precision engineering.

Regionally, the market spans North America, Latin America, East Asia, South Asia & Pacific, Eastern Europe, Western Europe, Oceania, and Middle East & Africa.

All-Electric Machines Favored for Energy Efficiency and Precision

All electric machines are projected to account for 41.7% of the India injection molding machines market in 2025. These systems have been widely adopted for their superior energy efficiency, cleanroom compatibility, and reduced maintenance. In India’s regulated sectors like healthcare and electronics, their low noise and precision output have been prioritized.

Enhanced control over injection speed, clamping force, and shot size has supported their use in high-tolerance applications. Manufacturers across India have integrated all-electric machines to meet rising quality standards in domestic and export markets.

Reduced operating costs and cycle times have improved profitability for mid-sized processors. Environmental compliance mandates have further encouraged a shift from hydraulic to electric systems. Increasing government incentives for energy-efficient machinery have also driven demand across organized sectors.

OEMs and component suppliers in India have scaled up investments in modular and high-speed all-electric platforms. Clean energy compatibility and smart factory integration have aligned with Industry 4.0 goals. Use in diagnostics, pharma, and clean medical molding has increased notably.

Growth in localized medical device manufacturing under the Make in India initiative has further fueled adoption. As labor optimization and automation accelerate in Indian manufacturing, all-electric machines are expected to dominate precision and hygiene-sensitive production zones. The segment’s continued expansion is supported by cost parity improvements, localized manufacturing hubs, and sustainability-linked capital expenditure. Adoption is expected to deepen across Tier I and Tier II cities.
Injection Molding Machines Industry Analysis In India Analysis By Automation

Healthcare Sector Creating Demand for Cleanroom-Compliant Molding

The healthcare industry is estimated to hold a 23.4% share of India’s injection molding machines market by 2025. Growth has been driven by increased demand for diagnostic consumables, medical device housings, and pharma-grade closures. All-electric and hybrid machines have been preferred for their cleanroom compatibility and sterility standards.

Customization of tooling and process control has supported critical-use molding applications. India’s growing investments in medical technology and life sciences innovation have supported machine upgrades. Government programs like PLI schemes for medical devices have expanded manufacturing capacity.

Healthcare clusters in Gujarat, Maharashtra, and Tamil Nadu have shown strong demand for precision molding systems. Surge in single-use diagnostics and vaccine-related equipment has also intensified machine utilization.

Molding units in healthcare have prioritized traceability, quality assurance, and automation readiness. High-speed all-electric systems with SCADA integration have been installed in GMP-certified units. Use of biocompatible resins and multi-cavity tooling has become more prevalent. Healthcare packaging and sterile product markets have contributed significantly to equipment modernization.

With India’s medical device and pharmaceutical exports rising, investment in validated, regulatory-compliant molding systems has accelerated. Strategic collaborations between OEMs and healthcare firms have promoted turnkey solutions. The healthcare end-use segment is expected to remain a key contributor to injection molding equipment growth. Demand will likely intensify as India scales its medical manufacturing ecosystem.
Injection Molding Machines Industry Analysis In India Analysis By End Use

Key India Injection Molding Machines Industry Dynamics and Outlook

The strong growth in Indian manufacturing and automotive sectors are driving the demand for injection molding machines. According to FMI's analysis, precision molding solutions are becoming more popular and are the go-to option for the production of intricate parts in large quantities. As production is automated in various industries, demand for high-efficiency, high-throughput machines is dramatically increasing.

There is a big impact from the EV boom on demand. Car manufacturers need lightweight and durable plastic components, which injection molding can be trusted to consistently provide. FMI finds that green vehicle and electric mobility incentives drive the growth of machine installations, particularly on interior trims, structural plastic components, and housings with low tolerance needs.

Injection molding is a rapidly evolving technology, with cutting-edge automation and intelligence transformation solution. AI, robotics, and real-time monitoring systems are coming together to significantly increase production consistency while reducing the costs of operation. According to FMI, manufacturers deploying smart systems are already attaining superior energy efficiency, reduced machine downtime, lower rates of defects, and faster cycle times, which allow them to better compete.

The constant fluctuation in the price of raw material is a continuing problem. Polymers, including polypropylene, polyethylene and ABS, are critical to injection molding, but they face unpredictable pressures from the global supply chain. According to FMI, equipment usage rates, and thus expansion plans are thrown off as a result of this kind of disruption, particularly for smaller processors and contract packaging companies.

Regulatory demands for lower emissions and improved efficiency are transforming the way machines are bought. Servo-hydraulic models in particular are gaining popularity among companies to meet sustainability requirements for energy efficient machines. FMI suggests that such government-initiated measures to encourage clean manufacturing, will pave way for increased use of greener injection molding technologies across industry verticals.

Rising demands from packaging, medical devices and consumer electronics sectors are also supporting machine sales. They require high-quantity, high-precision parts produced at low unit cost.

Demand Analysis in Injection Molding Machines in India across Key End User Segments

The India injection molding machine value chain comprises of raw material, machine manufacturers/outsourcing and processing, and component manufacturers contributing to hardware solutions demand by all application across various products categories. According to FMI analysis, both global and regional manufacturers are investing in R&D for launching electric and hybrid machines which is in line with India’s cost sensitive manufacturing scenario, but performance oriented as well.

Technology suppliers-predominantly automation and software system integrators-are becoming more critical in the conversion of injection molding into smart manufacturing cells. They also allow for real-time data monitoring, predictive maintenance, and connecting to robotics for pick-and-place and quality control jobs. The intersection of digital intelligence and standard injection molding is bringing transformation that will increase machine uptime and returns for end users over many years.

Investors and private equity firms have been seeing value in mid-sized machinery manufacturers and independent service providers. India’s Make in India & PLI has spurred industrial growth, which has led to inflows of capital into the automation based machine tools and support activities. They are changing the industry dynamics by initiating quick scale-up, consolidation, and collaboration strategies focused on high-growth clusters like automotive hubs and medical device parks.

Regulatory drives towards energy and carbon efficiency are influencing machine specifications and procurement preferences. According to FMI analysis, measures that encourage domestic production of essential machine parts and reduce reliance on imports are strengthening local manufacturing ecosystems and reshoring initiatives.

Key Strategies of Indian Injection Molding Machine Manufacturers, Suppliers, and Distributors

In the changing world of the injection molding machine industry, the manufacturers are taking a multi-pronged approach to strengthen their positions in the industry. One of the strategies of established players is product innovation which is concentrated on energy-efficient and high precision machinery to meet the rising requirement from industries including automotive and healthcare for sustainable solutions.

Many of them are also broadening their geographic reach, aiming at emerging industries in Asia and Africa, where industrialization is more quickly on the rise. Strategic alliances with local partners provide multinationals with the knowledge needed to overcome barriers to entry and exposure to regional know-how.

Investors are matching their strategies to technological change and sustainability trends. As the investment world zeroes in on environmental, social and governance (ESG) measures, investors are supporting startups and smaller companies that focus on energy-efficient and recyclable materials - seeing the potential returns these innovations could bring as they make their way into wide use over the next few decades. Another focus is on risk diversification, where such capital is distributed among companies located across various regions to mitigate the risk of economic and regulatory uncertainties.

Regulators are increasing scrutiny as part of a global effort for more sustainable industrial practices. To address these risk exposures, they are tightening emissions regulations, and requiring greater energy use disclosure. Favorable policy lobbying, i.e., for tax breaks on the adoption of sustainable technology, is an increasing strategic tool for top firms to fare well through regulatory push.

The end users, namely the automotive and healthcare sectors, are now more than ever keen to find cost effective solutions that meet their quality expectations. Their long-term supply relationships provide them with reliable supply chains to meet high-performance needs in the face of inflation. They are also deploying state of the art automation in their operations to enhance productivity and decrease reliance on manual labor.

Tech providers are leading the digital transformation and creating more advanced injection molding systems with AI and IoT. This allows the manufacturing execution system to track machine status dynamically and minimizes machine downtime and improves quality assurance. Partnering with infrastructure OEMs, tech firms are customizing offerings to ease workflows, to offer a suite of services that span the value chain from operations to maintenance.

Infrastructure players - logistics, and energy providers in particular - will increasingly concentrate on secure and robust supply chains. They’re betting on green technologies and green power to help industries like injection molding meet their sustainable challenges.

Combining these technologies allows these technologies to meet the increased industry need for environmentally-friendly business solutions that are also cost-effective. Working with Regulators no one can escape energy and emissions rules, so helping to still observe them, contributes to the right environment for growth of the industry.

Key Success Factors Driving the Market

The key success factors driving the injection molding machine industry are technological innovation and sustainability. As industries demand higher precision and efficiency, manufacturers are investing heavily in advanced technologies such as AI, IoT, and automation to enhance machine performance, reduce downtime, and improve production output.

These technological advancements enable companies to cater to increasingly complex and diverse consumer requirements, especially in sectors like automotive, healthcare, and electronics, where precision and efficiency are critical.

Another driving factor is the sustainability trend, as manufacturers and end-users alike are focused on minimizing environmental impact. Companies that prioritize energy-efficient machines and sustainable production processes are gaining a competitive edge.

Moreover, with increasing regulatory pressure to reduce carbon footprints and waste, firms that can innovate to meet these environmental standards not only ensure compliance but also attract environmentally conscious customers and investors. This focus on green technology is expected to continue driving industry growth and industry consolidation.

Key Players

  • Shibaura Machine India Private Limited
  • Electronica Plastic Machines Limited (EPML)
  • Esemplast Avinya
  • Windsor Machines Limited
  • Milacron India
  • Haitian India
  • ENGEL Machinery India
  • J. R. D. Rubber and Plastic Technology Private Limited
  • Sai Shakti Plasto Tech
  • Siempre Machinery Private Limited

Key Segments

By Automation:

In terms of automation, the industry is segmented into all-electric, hydraulic, and hybrid.

By Clamping Force:

By clamping force, the industry is segmented into between 1500-2000 and above 2000.

By Material:

Based on material, the industry is segmented into plastic, metal, rubber, and ceramic.

By End Use:

By end use, the industry is segmented into automotive, packaging, electronics, healthcare, consumer goods, and building & construction.

Table of Content

  1. Executive Summary
    • Global Market Outlook
    • Demand-side Trends
    • Supply-side Trends
    • Technology Roadmap Analysis
    • Analysis and Recommendations
  2. Market Overview
    • Market Coverage / Taxonomy
    • Market Definition / Scope / Limitations
  3. Market Background
    • Market Dynamics
      • Drivers
      • Restraints
      • Opportunity
      • Trends
    • Scenario Forecast
      • Demand in Optimistic Scenario
      • Demand in Likely Scenario
      • Demand in Conservative Scenario
    • Opportunity Map Analysis
    • Product Life Cycle Analysis
    • Supply Chain Analysis
      • Supply Side Participants and their Roles
        • Producers
        • Mid-Level Participants (Traders/ Agents/ Brokers)
        • Wholesalers and Distributors
      • Value Added and Value Created at Node in the Supply Chain
      • List of Raw Material Suppliers
      • List of Existing and Potential Buyer’s
    • Investment Feasibility Matrix
    • Value Chain Analysis
      • Profit Margin Analysis
      • Wholesalers and Distributors
      • Retailers
    • PESTLE and Porter’s Analysis
    • Regulatory Landscape
      • By Key Regions
      • By Key Countries
    • Regional Parent Market Outlook
    • Production and Consumption Statistics
    • Import and Export Statistics
  4. Global India Injection Molding Machine Analysis 2020 to 2024 and Forecast, 2025 to 2035
    • Historical Market Size Value (USD Million) & Volume (Units) Analysis, 2020 to 2024
    • Current and Future Market Size Value (USD Million) & Volume (Units) Projections, 2025 to 2035
      • Y-o-Y Growth Trend Analysis
      • Absolute $ Opportunity Analysis
  5. Global India Injection Molding Machine Pricing Analysis 2020 to 2024 and Forecast 2025 to 2035
  6. Global India Injection Molding Machine Analysis 2020 to 2024 and Forecast 2025 to 2035, By Automation
    • Introduction / Key Findings
    • Historical Market Size Value (USD Million) & Volume (Units) Analysis By Automation, 2020 to 2024
    • Current and Future Market Size Value (USD Million) & Volume (Units) Analysis and Forecast By Automation, 2025 to 2035
      • All-electric
      • Hydraulic
      • Hybrid
    • Y-o-Y Growth Trend Analysis By Automation, 2020 to 2024
    • Absolute $ Opportunity Analysis By Automation, 2025 to 2035
  7. Global Analysis 2020 to 2024 and Forecast 2025 to 2035, By Clamping Force
    • Introduction / Key Findings
    • Historical Market Size Value (USD Million) & Volume (Units) Analysis By Clamping Force, 2020 to 2024
    • Current and Future Market Size Value (USD Million) & Volume (Units) Analysis and Forecast By Clamping Force, 2025 to 2035
      • Less Than 2000 KN
      • More Than 2000 KN
    • Y-o-Y Growth Trend Analysis By Clamping Force, 2020 to 2024
    • Absolute $ Opportunity Analysis By Clamping Force, 2025 to 2035
  8. Global Analysis 2020 to 2024 and Forecast 2025 to 2035, By Material Type
    • Introduction / Key Findings
    • Historical Market Size Value (USD Million) & Volume (Units) Analysis By Material Type, 2020 to 2024
    • Current and Future Market Size Value (USD Million) & Volume (Units) Analysis and Forecast By Material Type, 2025 to 2035
      • Plastic
      • Metal
      • Rubber
      • Ceramic
    • Y-o-Y Growth Trend Analysis By Material Type, 2020 to 2024
    • Absolute $ Opportunity Analysis By Material Type, 2025 to 2035
  9. Global Analysis 2020 to 2024 and Forecast 2025 to 2035, By End Use
    • Introduction / Key Findings
    • Historical Market Size Value (USD Million) & Volume (Units) Analysis By End Use, 2020 to 2024
    • Current and Future Market Size Value (USD Million) & Volume (Units) Analysis and Forecast By End Use, 2025 to 2035
      • Automotive
      • Packaging
      • Electronics
      • Healthcare
      • Consumer Goods
      • Building & Construction
      • Others
    • Y-o-Y Growth Trend Analysis By End Use, 2020 to 2024
    • Absolute $ Opportunity Analysis By End Use, 2025 to 2035
  10. Global Analysis 2020 to 2024 and Forecast 2025 to 2035, By Region
    • Introduction
    • Historical Market Size Value (USD Million) & Volume (Units) Analysis By Region, 2020 to 2024
    • Current Market Size Value (USD Million) & Volume (Units) Analysis and Forecast By Region, 2025 to 2035
      • North America
      • Latin America
      • Europe
      • East Asia
      • South Asia
      • Oceania
      • MEA
    • Market Attractiveness Analysis By Region
  11. North America Analysis 2020 to 2024 and Forecast 2025 to 2035, By Country
    • Historical Market Size Value (USD Million) & Volume (Units) Trend Analysis By Market Taxonomy, 2020 to 2024
    • Market Size Value (USD Million) & Volume (Units) Forecast By Market Taxonomy, 2025 to 2035
      • By Country
        • USA
        • Canada
      • By Automation
      • By Clamping Force
      • By Material Type
      • By End Use
    • Market Attractiveness Analysis
      • By Country
      • By Automation
      • By Clamping Force
      • By Material Type
      • By End Use
    • Key Takeaways
  12. Latin America Analysis 2020 to 2024 and Forecast 2025 to 2035, By Country
    • Historical Market Size Value (USD Million) & Volume (Units) Trend Analysis By Market Taxonomy, 2020 to 2024
    • Market Size Value (USD Million) & Volume (Units) Forecast By Market Taxonomy, 2025 to 2035
      • By Country
        • Brazil
        • Mexico
        • Argentina
        • Chile
        • Peru
        • Rest of Latin America
      • By Automation
      • By Clamping Force
      • By Material Type
      • By End Use
    • Market Attractiveness Analysis
      • By Country
      • By Automation
      • By Clamping Force
      • By Material Type
      • By End Use
    • Key Takeaways
  13. Europe Analysis 2020 to 2024 and Forecast 2025 to 2035, By Country
    • Historical Market Size Value (USD Million) & Volume (Units) Trend Analysis By Market Taxonomy, 2020 to 2024
    • Market Size Value (USD Million) & Volume (Units) Forecast By Market Taxonomy, 2025 to 2035
      • By Country
        • Germany
        • Italy
        • France
        • UK
        • Spain
        • Russia
        • BENELUX
        • Rest of Europe
      • By Automation
      • By Clamping Force
      • By Material Type
      • By End Use
    • Market Attractiveness Analysis
      • By Country
      • By Automation
      • By Clamping Force
      • By Material Type
      • By End Use
    • Key Takeaways
  14. East Asia Analysis 2020 to 2024 and Forecast 2025 to 2035, By Country
    • Historical Market Size Value (USD Million) & Volume (Units) Trend Analysis By Market Taxonomy, 2020 to 2024
    • Market Size Value (USD Million) & Volume (Units) Forecast By Market Taxonomy, 2025 to 2035
      • By Country
        • China
        • Japan
        • South Korea
      • By Automation
      • By Clamping Force
      • By Material Type
      • By End Use
    • Market Attractiveness Analysis
      • By Country
      • By Automation
      • By Clamping Force
      • By Material Type
      • By End Use
    • Key Takeaways
  15. South Asia Analysis 2020 to 2024 and Forecast 2025 to 2035, By Country
    • Historical Market Size Value (USD Million) & Volume (Units) Trend Analysis By Market Taxonomy, 2020 to 2024
    • Market Size Value (USD Million) & Volume (Units) Forecast By Market Taxonomy, 2025 to 2035
      • By Country
        • India
        • Thailand
        • Malaysia
        • Indonesia
        • Rest of South Asia
      • By Automation
      • By Clamping Force
      • By Material Type
      • By End Use
    • Market Attractiveness Analysis
      • By Country
      • By Automation
      • By Clamping Force
      • By Material Type
      • By End Use
    • Key Takeaways
  16. Oceania Analysis 2020 to 2024 and Forecast 2025 to 2035, By Country
    • Historical Market Size Value (USD Million) & Volume (Units) Trend Analysis By Market Taxonomy, 2020 to 2024
    • Market Size Value (USD Million) & Volume (Units) Forecast By Market Taxonomy, 2025 to 2035
      • By Country
        • Australia
        • New Zealand
      • By Automation
      • By Clamping Force
      • By Material Type
      • By End Use
    • Market Attractiveness Analysis
      • By Country
      • By Automation
      • By Clamping Force
      • By Material Type
      • By End Use
    • Key Takeaways
  17. MEA Analysis 2020 to 2024 and Forecast 2025 to 2035, By Country
    • Historical Market Size Value (USD Million) & Volume (Units) Trend Analysis By Market Taxonomy, 2020 to 2024
    • Market Size Value (USD Million) & Volume (Units) Forecast By Market Taxonomy, 2025 to 2035
      • By Country
        • GCC
        • Rest of MEA
      • By Automation
      • By Clamping Force
      • By Material Type
      • By End Use
    • Market Attractiveness Analysis
      • By Country
      • By Automation
      • By Clamping Force
      • By Material Type
      • By End Use
    • Key Takeaways
  18. Key Countries Analysis
    • USA
      • Pricing Analysis
      • Market Share Analysis, 2024
        • By Automation
        • By Clamping Force
        • By Material Type
        • By End Use
    • Canada
      • Pricing Analysis
      • Market Share Analysis, 2024
        • By Automation
        • By Clamping Force
        • By Material Type
        • By End Use
    • Brazil
      • Pricing Analysis
      • Market Share Analysis, 2024
        • By Automation
        • By Clamping Force
        • By Material Type
        • By End Use
    • Mexico
      • Pricing Analysis
      • Market Share Analysis, 2024
        • By Automation
        • By Clamping Force
        • By Material Type
        • By End Use
    • Argentina
      • Pricing Analysis
      • Market Share Analysis, 2024
        • By Automation
        • By Clamping Force
        • By Material Type
        • By End Use
  19. Market Structure Analysis
    • Competition Dashboard
    • Competition Benchmarking
    • Market Share Analysis of Top Players
      • By Regional
      • By Automation
      • By Clamping Force
      • By Material Type
      • By End Use
  20. Competition Analysis
    • Competition Deep Dive
      • Shibaura Machine India Private Limited
        • Overview
        • Product Portfolio
        • Profitability by Market Segments (Product/Age /Sales Channel/Region)
        • Sales Footprint
        • Strategy Overview
          • Marketing Strategy
          • Product Strategy
          • Channel Strategy
      • Electronica Plastic Machines Limited (EPML)
        • Overview
        • Product Portfolio
        • Profitability by Market Segments (Product/Age /Sales Channel/Region)
        • Sales Footprint
        • Strategy Overview
          • Marketing Strategy
          • Product Strategy
          • Channel Strategy
      • Esemplast Avinya
        • Overview
        • Product Portfolio
        • Profitability by Market Segments (Product/Age /Sales Channel/Region)
        • Sales Footprint
        • Strategy Overview
          • Marketing Strategy
          • Product Strategy
          • Channel Strategy
      • Windsor Machines Limited
        • Overview
        • Product Portfolio
        • Profitability by Market Segments (Product/Age /Sales Channel/Region)
        • Sales Footprint
        • Strategy Overview
          • Marketing Strategy
          • Product Strategy
          • Channel Strategy
      • Milacron India
        • Overview
        • Product Portfolio
        • Profitability by Market Segments (Product/Age /Sales Channel/Region)
        • Sales Footprint
        • Strategy Overview
          • Marketing Strategy
          • Product Strategy
          • Channel Strategy
      • Haitian India
        • Overview
        • Product Portfolio
        • Profitability by Market Segments (Product/Age /Sales Channel/Region)
        • Sales Footprint
        • Strategy Overview
          • Marketing Strategy
          • Product Strategy
          • Channel Strategy
      • ENGEL Machinery India
        • Overview
        • Product Portfolio
        • Profitability by Market Segments (Product/Age /Sales Channel/Region)
        • Sales Footprint
        • Strategy Overview
          • Marketing Strategy
          • Product Strategy
          • Channel Strategy
      • J. R. D. Rubber and Plastic Technology Private Limited
        • Overview
        • Product Portfolio
        • Profitability by Market Segments (Product/Age /Sales Channel/Region)
        • Sales Footprint
        • Strategy Overview
          • Marketing Strategy
          • Product Strategy
          • Channel Strategy
      • Sai Shakti Plasto Tech
        • Overview
        • Product Portfolio
        • Profitability by Market Segments (Product/Age /Sales Channel/Region)
        • Sales Footprint
        • Strategy Overview
          • Marketing Strategy
          • Product Strategy
          • Channel Strategy
      • Siempre Machinery Private Limited
        • Overview
        • Product Portfolio
        • Profitability by Market Segments (Product/Age /Sales Channel/Region)
        • Sales Footprint
        • Strategy Overview
          • Marketing Strategy
          • Product Strategy
          • Channel Strategy
  21. Assumptions & Acronyms Used
  22. Research Methodology

List of Tables

  • Table 1: Global Value (USD Million) Forecast by Region, 2020-2035
  • Table 2: Global Volume (Units) Forecast by Region, 2020-2035
  • Table 3: Global Value (USD Million) Forecast by Automation, 2020-2035
  • Table 4: Global Volume (Units) Forecast by Automation, 2020-2035
  • Table 5: Global Value (USD Million) Forecast by Clamping Force, 2020-2035
  • Table 6: Global Volume (Units) Forecast by Clamping Force, 2020-2035
  • Table 7: Global Value (USD Million) Forecast by Material Type, 2020-2035
  • Table 8: Global Volume (Units) Forecast by Material Type, 2020-2035
  • Table 9: Global Value (USD Million) Forecast by End Use, 2020-2035
  • Table 10: Global Volume (Units) Forecast by End Use, 2020-2035
  • Table 11: North America Value (USD Million) Forecast by Country, 2020-2035
  • Table 12: North America Volume (Units) Forecast by Country, 2020-2035
  • Table 13: North America Value (USD Million) Forecast by Automation, 2020-2035
  • Table 14: North America Volume (Units) Forecast by Automation, 2020-2035
  • Table 15: North America Value (USD Million) Forecast by Clamping Force, 2020-2035
  • Table 16: North America Volume (Units) Forecast by Clamping Force, 2020-2035
  • Table 17: North America Value (USD Million) Forecast by Material Type, 2020-2035
  • Table 18: North America Volume (Units) Forecast by Material Type, 2020-2035
  • Table 19: North America Value (USD Million) Forecast by End Use, 2020-2035
  • Table 20: North America Volume (Units) Forecast by End Use, 2020-2035
  • Table 21: Latin America Value (USD Million) Forecast by Country, 2020-2035
  • Table 22: Latin America Volume (Units) Forecast by Country, 2020-2035
  • Table 23: Latin America Value (USD Million) Forecast by Automation, 2020-2035
  • Table 24: Latin America Volume (Units) Forecast by Automation, 2020-2035
  • Table 25: Latin America Value (USD Million) Forecast by Clamping Force, 2020-2035
  • Table 26: Latin America Volume (Units) Forecast by Clamping Force, 2020-2035
  • Table 27: Latin America Value (USD Million) Forecast by Material Type, 2020-2035
  • Table 28: Latin America Volume (Units) Forecast by Material Type, 2020-2035
  • Table 29: Latin America Value (USD Million) Forecast by End Use, 2020-2035
  • Table 30: Latin America Volume (Units) Forecast by End Use, 2020-2035
  • Table 31: Europe Value (USD Million) Forecast by Country, 2020-2035
  • Table 32: Europe Volume (Units) Forecast by Country, 2020-2035
  • Table 33: Europe Value (USD Million) Forecast by Automation, 2020-2035
  • Table 34: Europe Volume (Units) Forecast by Automation, 2020-2035
  • Table 35: Europe Value (USD Million) Forecast by Clamping Force, 2020-2035
  • Table 36: Europe Volume (Units) Forecast by Clamping Force, 2020-2035
  • Table 37: Europe Value (USD Million) Forecast by Material Type, 2020-2035
  • Table 38: Europe Volume (Units) Forecast by Material Type, 2020-2035
  • Table 39: Europe Value (USD Million) Forecast by End Use, 2020-2035
  • Table 40: Europe Volume (Units) Forecast by End Use, 2020-2035
  • Table 41: East Asia Value (USD Million) Forecast by Country, 2020-2035
  • Table 42: East Asia Volume (Units) Forecast by Country, 2020-2035
  • Table 43: East Asia Value (USD Million) Forecast by Automation, 2020-2035
  • Table 44: East Asia Volume (Units) Forecast by Automation, 2020-2035
  • Table 45: East Asia Value (USD Million) Forecast by Clamping Force, 2020-2035
  • Table 46: East Asia Volume (Units) Forecast by Clamping Force, 2020-2035
  • Table 47: East Asia Value (USD Million) Forecast by Material Type, 2020-2035
  • Table 48: East Asia Volume (Units) Forecast by Material Type, 2020-2035
  • Table 49: East Asia Value (USD Million) Forecast by End Use, 2020-2035
  • Table 50: East Asia Volume (Units) Forecast by End Use, 2020-2035
  • Table 51: South Asia Value (USD Million) Forecast by Country, 2020-2035
  • Table 52: South Asia Volume (Units) Forecast by Country, 2020-2035
  • Table 53: South Asia Value (USD Million) Forecast by Automation, 2020-2035
  • Table 54: South Asia Volume (Units) Forecast by Automation, 2020-2035
  • Table 55: South Asia Value (USD Million) Forecast by Clamping Force, 2020-2035
  • Table 56: South Asia Volume (Units) Forecast by Clamping Force, 2020-2035
  • Table 57: South Asia Value (USD Million) Forecast by Material Type, 2020-2035
  • Table 58: South Asia Volume (Units) Forecast by Material Type, 2020-2035
  • Table 59: South Asia Value (USD Million) Forecast by End Use, 2020-2035
  • Table 60: South Asia Volume (Units) Forecast by End Use, 2020-2035
  • Table 61: Oceania Value (USD Million) Forecast by Country, 2020-2035
  • Table 62: Oceania Volume (Units) Forecast by Country, 2020-2035
  • Table 63: Oceania Value (USD Million) Forecast by Automation, 2020-2035
  • Table 64: Oceania Volume (Units) Forecast by Automation, 2020-2035
  • Table 65: Oceania Value (USD Million) Forecast by Clamping Force, 2020-2035
  • Table 66: Oceania Volume (Units) Forecast by Clamping Force, 2020-2035
  • Table 67: Oceania Value (USD Million) Forecast by Material Type, 2020-2035
  • Table 68: Oceania Volume (Units) Forecast by Material Type, 2020-2035
  • Table 69: Oceania Value (USD Million) Forecast by End Use, 2020-2035
  • Table 70: Oceania Volume (Units) Forecast by End Use, 2020-2035
  • Table 71: MEA Value (USD Million) Forecast by Country, 2020-2035
  • Table 72: MEA Volume (Units) Forecast by Country, 2020-2035
  • Table 73: MEA Value (USD Million) Forecast by Automation, 2020-2035
  • Table 74: MEA Volume (Units) Forecast by Automation, 2020-2035
  • Table 75: MEA Value (USD Million) Forecast by Clamping Force, 2020-2035
  • Table 76: MEA Volume (Units) Forecast by Clamping Force, 2020-2035
  • Table 77: MEA Value (USD Million) Forecast by Material Type, 2020-2035
  • Table 78: MEA Volume (Units) Forecast by Material Type, 2020-2035
  • Table 79: MEA Value (USD Million) Forecast by End Use, 2020-2035
  • Table 80: MEA Volume (Units) Forecast by End Use, 2020-2035

List of Figures

  • Figure 1: Global Volume (Units) Forecast 2020-2035
  • Figure 2: Global Pricing Analysis
  • Figure 3: Global Value (USD Million) Forecast 2020-2035
  • Figure 4: Global Value Share and BPS Analysis by Automation, 2025 and 2035
  • Figure 5: Global Y-o-Y Growth Comparison by Automation, 2025-2035
  • Figure 6: Global Attractiveness Analysis by Automation
  • Figure 7: Global Value Share and BPS Analysis by Clamping Force, 2025 and 2035
  • Figure 8: Global Y-o-Y Growth Comparison by Clamping Force, 2025-2035
  • Figure 9: Global Attractiveness Analysis by Clamping Force
  • Figure 10: Global Value Share and BPS Analysis by Material Type, 2025 and 2035
  • Figure 11: Global Y-o-Y Growth Comparison by Material Type, 2025-2035
  • Figure 12: Global Attractiveness Analysis by Material Type
  • Figure 13: Global Value Share and BPS Analysis by End Use, 2025 and 2035
  • Figure 14: Global Y-o-Y Growth Comparison by End Use, 2025-2035
  • Figure 15: Global Attractiveness Analysis by End Use
  • Figure 16: Global Value (USD Million) Share and BPS Analysis by Region, 2025 and 2035
  • Figure 17: Global Y-o-Y Growth Comparison by Region, 2025-2035
  • Figure 18: Global Attractiveness Analysis by Region
  • Figure 19: North America Incremental $ Opportunity, 2025-2035
  • Figure 20: Latin America Incremental $ Opportunity, 2025-2035
  • Figure 21: Europe Incremental $ Opportunity, 2025-2035
  • Figure 22: East Asia Incremental $ Opportunity, 2025-2035
  • Figure 23: South Asia Incremental $ Opportunity, 2025-2035
  • Figure 24: Oceania Incremental $ Opportunity, 2025-2035
  • Figure 25: MEA Incremental $ Opportunity, 2025-2035
  • Figure 26: North America Value Share and BPS Analysis by Country, 2025 and 2035
  • Figure 27: North America Value Share and BPS Analysis by Automation, 2025 and 2035
  • Figure 28: North America Y-o-Y Growth Comparison by Automation, 2025-2035
  • Figure 29: North America Attractiveness Analysis by Automation
  • Figure 30: North America Value Share and BPS Analysis by Clamping Force, 2025 and 2035
  • Figure 31: North America Y-o-Y Growth Comparison by Clamping Force, 2025-2035
  • Figure 32: North America Attractiveness Analysis by Clamping Force
  • Figure 33: North America Value Share and BPS Analysis by Material Type, 2025 and 2035
  • Figure 34: North America Y-o-Y Growth Comparison by Material Type, 2025-2035
  • Figure 35: North America Attractiveness Analysis by Material Type
  • Figure 36: North America Value Share and BPS Analysis by End Use, 2025 and 2035
  • Figure 37: North America Y-o-Y Growth Comparison by End Use, 2025-2035
  • Figure 38: North America Attractiveness Analysis by End Use
  • Figure 39: Latin America Value Share and BPS Analysis by Country, 2025 and 2035
  • Figure 40: Latin America Value Share and BPS Analysis by Automation, 2025 and 2035
  • Figure 41: Latin America Y-o-Y Growth Comparison by Automation, 2025-2035
  • Figure 42: Latin America Attractiveness Analysis by Automation
  • Figure 43: Latin America Value Share and BPS Analysis by Clamping Force, 2025 and 2035
  • Figure 44: Latin America Y-o-Y Growth Comparison by Clamping Force, 2025-2035
  • Figure 45: Latin America Attractiveness Analysis by Clamping Force
  • Figure 46: Latin America Value Share and BPS Analysis by Material Type, 2025 and 2035
  • Figure 47: Latin America Y-o-Y Growth Comparison by Material Type, 2025-2035
  • Figure 48: Latin America Attractiveness Analysis by Material Type
  • Figure 49: Latin America Value Share and BPS Analysis by End Use, 2025 and 2035
  • Figure 50: Latin America Y-o-Y Growth Comparison by End Use, 2025-2035
  • Figure 51: Latin America Attractiveness Analysis by End Use
  • Figure 52: Europe Value Share and BPS Analysis by Country, 2025 and 2035
  • Figure 53: Europe Value Share and BPS Analysis by Automation, 2025 and 2035
  • Figure 54: Europe Y-o-Y Growth Comparison by Automation, 2025-2035
  • Figure 55: Europe Attractiveness Analysis by Automation
  • Figure 56: Europe Value Share and BPS Analysis by Clamping Force, 2025 and 2035
  • Figure 57: Europe Y-o-Y Growth Comparison by Clamping Force, 2025-2035
  • Figure 58: Europe Attractiveness Analysis by Clamping Force
  • Figure 59: Europe Value Share and BPS Analysis by Material Type, 2025 and 2035
  • Figure 60: Europe Y-o-Y Growth Comparison by Material Type, 2025-2035
  • Figure 61: Europe Attractiveness Analysis by Material Type
  • Figure 62: Europe Value Share and BPS Analysis by End Use, 2025 and 2035
  • Figure 63: Europe Y-o-Y Growth Comparison by End Use, 2025-2035
  • Figure 64: Europe Attractiveness Analysis by End Use
  • Figure 65: East Asia Value Share and BPS Analysis by Country, 2025 and 2035
  • Figure 66: East Asia Value Share and BPS Analysis by Automation, 2025 and 2035
  • Figure 67: East Asia Y-o-Y Growth Comparison by Automation, 2025-2035
  • Figure 68: East Asia Attractiveness Analysis by Automation
  • Figure 69: East Asia Value Share and BPS Analysis by Clamping Force, 2025 and 2035
  • Figure 70: East Asia Y-o-Y Growth Comparison by Clamping Force, 2025-2035
  • Figure 71: East Asia Attractiveness Analysis by Clamping Force
  • Figure 72: East Asia Value Share and BPS Analysis by Material Type, 2025 and 2035
  • Figure 73: East Asia Y-o-Y Growth Comparison by Material Type, 2025-2035
  • Figure 74: East Asia Attractiveness Analysis by Material Type
  • Figure 75: East Asia Value Share and BPS Analysis by End Use, 2025 and 2035
  • Figure 76: East Asia Y-o-Y Growth Comparison by End Use, 2025-2035
  • Figure 77: East Asia Attractiveness Analysis by End Use
  • Figure 78: South Asia Value Share and BPS Analysis by Country, 2025 and 2035
  • Figure 79: South Asia Value Share and BPS Analysis by Automation, 2025 and 2035
  • Figure 80: South Asia Y-o-Y Growth Comparison by Automation, 2025-2035
  • Figure 81: South Asia Attractiveness Analysis by Automation
  • Figure 82: South Asia Value Share and BPS Analysis by Clamping Force, 2025 and 2035
  • Figure 83: South Asia Y-o-Y Growth Comparison by Clamping Force, 2025-2035
  • Figure 84: South Asia Attractiveness Analysis by Clamping Force
  • Figure 85: South Asia Value Share and BPS Analysis by Material Type, 2025 and 2035
  • Figure 86: South Asia Y-o-Y Growth Comparison by Material Type, 2025-2035
  • Figure 87: South Asia Attractiveness Analysis by Material Type
  • Figure 88: South Asia Value Share and BPS Analysis by End Use, 2025 and 2035
  • Figure 89: South Asia Y-o-Y Growth Comparison by End Use, 2025-2035
  • Figure 90: South Asia Attractiveness Analysis by End Use
  • Figure 91: Oceania Value Share and BPS Analysis by Country, 2025 and 2035
  • Figure 92: Oceania Value Share and BPS Analysis by Automation, 2025 and 2035
  • Figure 93: Oceania Y-o-Y Growth Comparison by Automation, 2025-2035
  • Figure 94: Oceania Attractiveness Analysis by Automation
  • Figure 95: Oceania Value Share and BPS Analysis by Clamping Force, 2025 and 2035
  • Figure 96: Oceania Y-o-Y Growth Comparison by Clamping Force, 2025-2035
  • Figure 97: Oceania Attractiveness Analysis by Clamping Force
  • Figure 98: Oceania Value Share and BPS Analysis by Material Type, 2025 and 2035
  • Figure 99: Oceania Y-o-Y Growth Comparison by Material Type, 2025-2035
  • Figure 100: Oceania Attractiveness Analysis by Material Type
  • Figure 101: Oceania Value Share and BPS Analysis by End Use, 2025 and 2035
  • Figure 102: Oceania Y-o-Y Growth Comparison by End Use, 2025-2035
  • Figure 103: Oceania Attractiveness Analysis by End Use
  • Figure 104: MEA Value Share and BPS Analysis by Country, 2025 and 2035
  • Figure 105: MEA Value Share and BPS Analysis by Automation, 2025 and 2035
  • Figure 106: MEA Y-o-Y Growth Comparison by Automation, 2025-2035
  • Figure 107: MEA Attractiveness Analysis by Automation
  • Figure 108: MEA Value Share and BPS Analysis by Clamping Force, 2025 and 2035
  • Figure 109: MEA Y-o-Y Growth Comparison by Clamping Force, 2025-2035
  • Figure 110: MEA Attractiveness Analysis by Clamping Force
  • Figure 111: MEA Value Share and BPS Analysis by Material Type, 2025 and 2035
  • Figure 112: MEA Y-o-Y Growth Comparison by Material Type, 2025-2035
  • Figure 113: MEA Attractiveness Analysis by Material Type
  • Figure 114: MEA Value Share and BPS Analysis by End Use, 2025 and 2035
  • Figure 115: MEA Y-o-Y Growth Comparison by End Use, 2025-2035
  • Figure 116: MEA Attractiveness Analysis by End Use
  • Figure 117: Global India Injection Molding Machine - Tier Structure Analysis
  • Figure 118: Global India Injection Molding Machine - Company Share Analysis

Frequently Asked Questions

What factors drive the demand for injection molding machines in India?

The growing need for precision manufacturing across industries like automotive, healthcare, and packaging, coupled with advancements in automation and sustainability, drives the demand for injection molding machines in India.

How do technological advancements influence the use of injection molding machines in India?

Technological innovations such as AI integration, IoT connectivity, and energy-efficient automation systems are enhancing the efficiency and precision of injection molding machines, making them crucial for sectors demanding high-quality and sustainable production.

What regulatory factors impact the adoption of injection molding machines in India?

Regulatory standards focused on sustainability, emissions control, and product safety are influencing the adoption of energy-efficient and eco-friendly injection molding machines in India, prompting manufacturers to align with green manufacturing practices.

Which regions in India are expected to see the highest adoption of injection molding machines?

Regions with strong industrial hubs, such as Maharashtra, Tamil Nadu, Gujarat, and Delhi NCR, are expected to see significant growth due to their established automotive, electronics, and packaging sectors.

What challenges do manufacturers face when using injection molding machines in India?

Manufacturers face challenges such as fluctuating raw material prices, rising energy costs, regulatory compliance, and the need to continuously upgrade technology to meet evolving industry standards and consumer demands.

Explore Similar Insights

Future Market Insights

Injection Molding Machines Industry Analysis in India