The global marine fuel injection system market is projected to reach USD 8.4 billion by 2035, recording an absolute increase of USD 2.5 billion over the forecast period. The market is valued at USD 5.9 billion in 2025 and is set to rise at a CAGR of 3.5% during the assessment period.
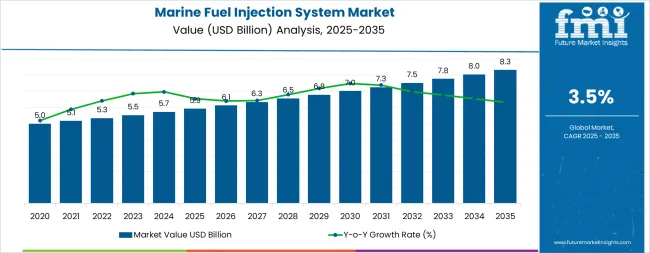
The overall market size is expected to grow by nearly 1.4 times during the same period, supported by increasing demand for efficient fuel management systems across commercial shipping and naval operations worldwide, driving demand for advanced injection technologies and increasing investments in maritime fleet modernization and emission compliance projects globally.
However, regulatory compliance challenges and complex technical integration standards may pose challenges to market expansion.
Between 2025 and 2030, the marine fuel injection system market is projected to expand from USD 5.9 billion to USD 7 billion, resulting in a value increase of USD 1.1 billion, which represents 44% of the total forecast growth for the decade.
This phase of development will be shaped by rising demand for maritime transport and commercial fleet expansion, product innovation in injection technologies and high-performance fuel systems, as well as expanding integration with environmental compliance and emission reduction initiatives. Companies are establishing competitive positions through investment in advanced fuel injection technologies, electronic control solutions, and strategic market expansion across shipping, offshore energy, and marine logistics applications.
From 2030 to 2035, the market is forecast to grow from USD 7 billion to USD 8.4 billion, adding another USD 1.4 billion, which constitutes 56% of the overall ten-year expansion. This period is expected to be characterized by the expansion of specialized injection systems, including advanced electronic fuel injection formulations and integrated control solutions tailored for specific marine engine requirements, strategic collaborations between equipment manufacturers and marine industries, and an enhanced focus on operational efficiency and environmental compliance.
The growing emphasis on fuel efficiency optimization and advanced injection processes will drive demand for comprehensive, high-performance marine fuel injection solutions across diverse maritime applications.
| Metric | Value |
|---|---|
| Market Value (2025) | USD 5.9 billion |
| Market Forecast Value (2035) | USD 8.4 billion |
| Forecast CAGR (2025 to 2035) | 3.5% |
The marine fuel injection system market grows by enabling marine operators to achieve superior fuel efficiency and emission compliance across commercial shipping facilities, ranging from small-scale fishing vessels to mega cargo ship complexes. Marine operators face mounting pressure to improve operational efficiency and regulatory compliance, with fuel injection systems typically providing 15-25% improvement in fuel efficiency compared to conventional injection systems, making advanced fuel injection technologies essential for competitive maritime operations.
The shipping industry's need for maximum fuel economy creates demand for advanced injection solutions that can minimize fuel consumption, enhance engine durability, and ensure consistent performance across diverse operational conditions.
Government initiatives promoting maritime emission reduction and fleet modernization drive adoption in commercial shipping, offshore operations, and naval applications, where fuel performance has a direct impact on operational efficiency and regulatory compliance. However, raw material price volatility and the complexity of achieving consistent performance across different engine types may limit adoption rates among cost-sensitive operators and developing regions with limited technical expertise.
The market is segmented by engine type, sales channel, engine capacity, application, and region. By engine type, the market is divided into 2-stroke and 4-stroke engines. Based on sales channel, the market is categorized into original equipment manufacturer and aftermarket. By engine capacity, the segments include up to 2000 HP, 2000 to 10000 HP, 10000 to 20000 HP, 20000 to 50000 HP, 50000 to 80000 HP, and above 80000 HP.
Based on application, the market is segmented into service vessels, passenger vessels, cargo carriers, fishing vessels, personal watercraft and sailboats, and others. Regionally, the market is divided into North America, Latin America, Western Europe, Eastern Europe, East Asia, South Asia Pacific, and Middle East & Africa.
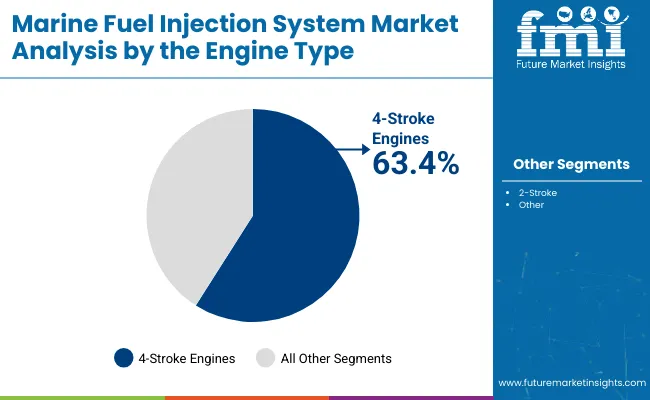
The 4-stroke engine segment represents the dominant force in the marine fuel injection system market, capturing approximately 63.4% of total market share in 2025. This advanced engine category encompasses formulations featuring superior fuel efficiency characteristics, including enhanced operational reliability and optimized performance combinations that enable superior fuel economy and enhanced emission characteristics. The 4-stroke engine segment's market leadership stems from its exceptional performance capabilities in commercial marine applications, with engines capable of handling efficient fuel combustion while maintaining consistent performance and operational reliability across diverse shipping operations.
The 2-stroke engine segment maintains a substantial market share, serving operators who require high-power output solutions for heavy-duty applications. These engines offer reliable performance for large-scale cargo shipping applications while providing sufficient power to meet demanding performance requirements in commercial shipping and industrial marine applications.
Key technological advantages driving the 4-stroke engine segment include:
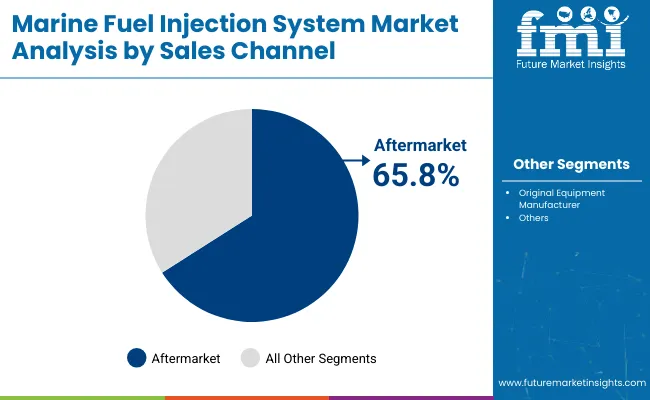
Aftermarket applications dominate the marine fuel injection system market with approximately 65.8% market share in 2025, reflecting the critical role of maintenance and retrofit services in serving marine fleet demand and supporting operational efficiency initiatives. The aftermarket segment's market leadership is reinforced by increasing fleet maintenance requirements, component replacement needs, and rising demand for cost-effective system upgrades that directly correlate with operational flexibility and fleet responsiveness.
The original equipment manufacturer segment represents the second-largest sales channel category, capturing significant market share through specialized requirements for new vessel construction, original equipment installations, and high-volume production operations. This segment benefits from growing demand for integrated fuel injection systems that meet stringent performance, efficiency, and regulatory requirements in demanding marine applications.
Key market dynamics supporting sales channel growth include:
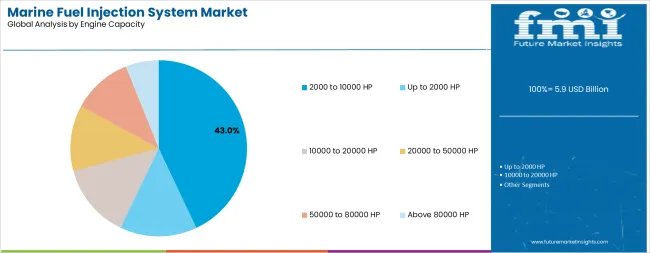
2000-10000 HP capacity applications represent a significant portion of the marine fuel injection system market with approximately 43% market share in 2025, reflecting the critical role of medium-scale marine operations in serving regional shipping demand and supporting commercial fleet initiatives. The medium-capacity segment's market position is reinforced by increasing regional maritime activities, balanced power requirements, and rising demand for versatile fuel injection optimization that directly correlates with operational flexibility and fuel efficiency.
The up to 2000 HP segment maintains substantial market share, serving operators who require cost-effective injection solutions for smaller vessel applications. This segment benefits from growing demand for fishing vessels, service boats, and coastal shipping operations that meet specific performance and efficiency requirements in diverse marine applications.
The above 80000 HP segment accounts for specialized market share, serving mega-scale cargo vessels requiring maximum power output. Other capacity ranges represent specialized market segments serving specific operational requirements.
Key market dynamics supporting capacity growth include:
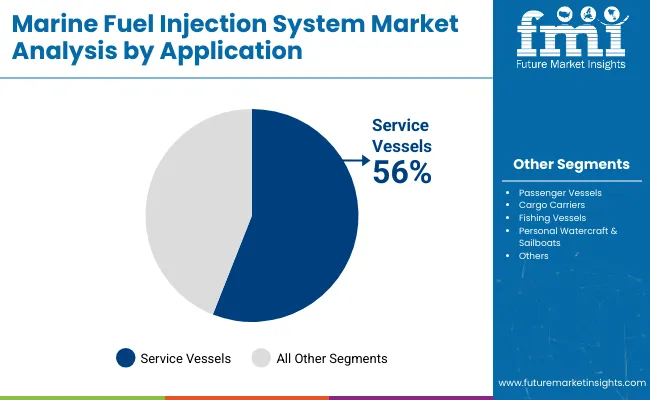
Service Vessels applications dominate the marine fuel injection system market with approximately 56% market share in 2025, reflecting the critical role of harbor operations in serving maritime infrastructure demand and supporting port efficiency initiatives. The service vessels segment's market leadership is reinforced by increasing port modernization requirements, operational support needs, and rising demand for reliable fuel injection systems that directly correlate with operational availability and service responsiveness.
The passenger vessels segment represents the second-largest application category, capturing significant market share through specialized requirements for cruise ships, ferries, and transportation services. This segment benefits from growing demand for passenger transport systems that meet stringent safety, comfort, and operational requirements in demanding marine passenger applications.
The cargo carriers segment accounts for substantial market share, serving vessels requiring high-capacity transport solutions. Other application segments capture market share through specialized marine operations, while remaining segments represent niche market applications.
Key market dynamics supporting application growth include:
The market is driven by three concrete demand factors tied to maritime and operational optimization outcomes. First, global maritime trade growth and fleet expansion create increasing demand for high-performance fuel injection solutions, with global seaborne trade projected to continue expanding, requiring specialized injection technologies for maximum fuel efficiency.
Second, modernization of aging marine fleets and emission compliance drive the adoption of superior injection technologies, with operators seeking 15-25% improvement in fuel efficiency and regulatory compliance enhancement. Third, technological advancements in electronic control systems and precision injection technologies enable more effective and efficient fuel management systems that reduce operational costs while improving long-term performance and cost-effectiveness.
Market restraints include raw material price volatility that can impact system costs and profitability margins, particularly during periods of supply chain disruption or commodity price fluctuations affecting key steel and electronic component costs. Regulatory complexity in emission compliance poses another significant challenge, as achieving consistent performance standards across different marine engine types and regulatory frameworks requires specialized expertise and quality control systems, potentially causing project delays and increased manufacturing costs.
Technical complexity in system integration and customization requirements create additional challenges for manufacturers, demanding ongoing investment in engineering capabilities and compliance with varying regional maritime standards.
Key trends indicate accelerated adoption in emerging markets, particularly China, India, and Southeast Asia, where rapid maritime infrastructure development and fleet capacity expansion drive comprehensive fuel injection system development.
Technology advancement trends toward digital integration with enhanced electronic control, real-time monitoring, and multi-functional system capabilities enable next-generation product development that addresses multiple performance requirements simultaneously. However, the market thesis could face disruption if alternative marine propulsion technologies or significant changes in shipping practices minimize reliance on traditional internal combustion marine engines.
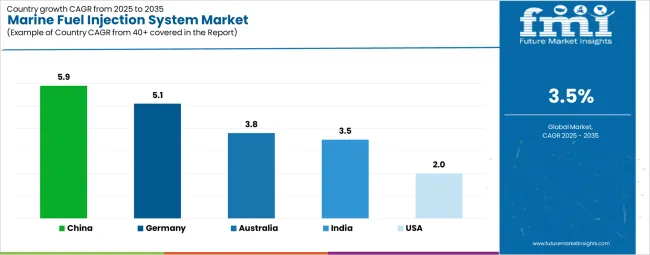
| Country | CAGR (2025-2035) |
|---|---|
| China | 5.9% |
| Germany | 5.1% |
| Australia | 3.8% |
| India | 3.5% |
| United States | 2% |
The marine fuel injection system market is gaining momentum worldwide, with China taking the lead thanks to massive maritime infrastructure expansion and government-backed fleet modernization programs. Close behind, Germany benefits from growing shipbuilding capabilities and advanced marine technology initiatives, positioning itself as a strategic growth hub in the European region.
Australia shows steady advancement, where integration of advanced marine technologies strengthens its role in the Asia-Pacific maritime supply chain. India is focusing on maritime development and commercial fleet expansion, signaling an ambition to capitalize on growing opportunities in regional shipping markets.
Meanwhile, United States stands out for its advanced marine technology development in existing fleet applications, recording consistent progress in maritime operational advancement. Together, China and Germany anchor the global expansion story, while the rest build stability and diversity into the market's growth path.
The report covers an in-depth analysis of 40+ countries top-performing countries are highlighted below.
China demonstrates the strongest growth potential in the marine fuel injection system market with a CAGR of 5.9% through 2035. The country's leadership position stems from massive maritime infrastructure projects, government-backed shipbuilding programs, and aggressive fleet modernization targets, driving the adoption of high-performance fuel injection systems.
Growth is concentrated in major shipbuilding regions, including Jiangsu, Guangdong, Shanghai, and Shandong, where marine equipment manufacturers and shipping companies are implementing advanced injection solutions for enhanced operational performance and international competitiveness.
Distribution channels through established marine suppliers and direct manufacturer relationships expand deployment across shipbuilding facilities and marine equipment centers. The country's maritime leadership strategy provides policy support for advanced marine technology development, including high-performance injection system adoption.
Key market factors:
In Hamburg, Bremen, Kiel, and Rostock, the adoption of marine fuel injection systems is accelerating across shipbuilding facilities and marine technology centers, driven by emission compliance targets and government maritime modernization initiatives.
The market demonstrates strong growth momentum with a CAGR of 5.1% through 2035, linked to comprehensive marine technology expansion and increasing focus on operational efficiency solutions. German manufacturers are implementing advanced injection systems and electronic control platforms to enhance engine performance while meeting growing demand for marine equipment in domestic and export markets.
The country's maritime development programs create continued demand for high-performance injection solutions, while increasing emphasis on local manufacturing drives adoption of advanced technologies and precision systems.
Advanced maritime industry in Australia demonstrates sophisticated implementation of marine fuel injection systems, with documented case studies showing efficiency improvements in commercial fleet applications through optimized injection solutions.
The country's marine infrastructure in major ports and shipbuilding centers, including New South Wales, Western Australia, Queensland, and Victoria, showcases integration of advanced injection technologies with existing marine systems, leveraging expertise in maritime operations and precision engineering.
Australian operators emphasize quality standards and operational compliance, creating demand for high-performance injection solutions that support efficiency initiatives and regulatory requirements. The market maintains steady growth through focus on maritime innovation and operational competitiveness, with a CAGR of 3.8% through 2035.
Key development areas:
Market in India expansion is driven by diverse maritime demand, including commercial shipping in Mumbai and Chennai regions, shipbuilding development in Kochi and Visakhapatnam, and comprehensive maritime modernization across multiple coastal areas. The country demonstrates promising growth potential with a CAGR of 3.5% through 2035, supported by national maritime programs and regional infrastructure development initiatives. Indian operators face implementation challenges related to technology integration and operational efficiency requirements, requiring injection system upgrade approaches and international partnership support. However, growing maritime targets and operational competitiveness requirements create compelling business cases for fuel injection system adoption, particularly in commercial shipping regions where efficiency performance has a direct impact on maritime competitiveness.
Market characteristics:
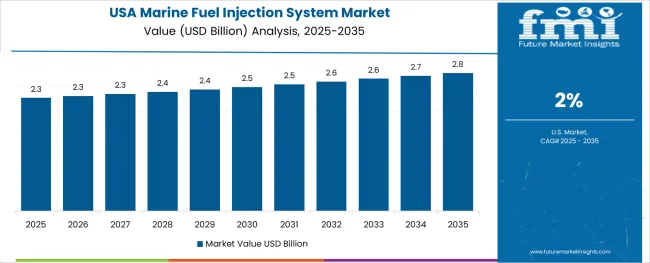
United States market leads in advanced marine innovation based on integration with next-generation propulsion technologies and sophisticated injection applications for enhanced performance characteristics. The country shows solid potential with a CAGR of 2.0% through 2035, driven by maritime modernization programs and advanced technology initiatives across major maritime regions, including Gulf Coast, West Coast, East Coast, and Great Lakes.
American operators are adopting advanced injection systems for fuel efficiency optimization and regulatory compliance, particularly in regions with environmental mandates and advanced marine facilities requiring superior performance differentiation. Technology deployment channels through established marine distributors and direct manufacturer relationships expand coverage across commercial shipping and marine operations facilities.
Leading market segments:
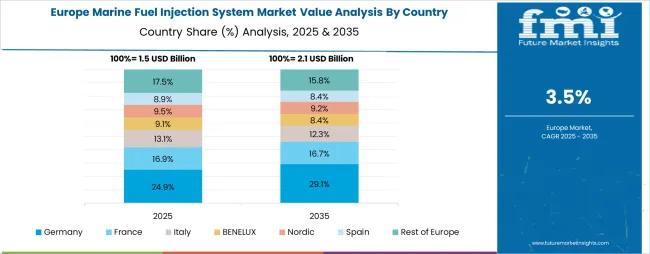
The marine fuel injection system market in Europe is projected to grow from USD 1.4 billion in 2025 to USD 2.0 billion by 2035, registering a CAGR of 3.8% over the forecast period. Germany is expected to maintain its leadership position with a 28.2% market share in 2025, declining slightly to 27.8% by 2035, supported by its extensive shipbuilding infrastructure and major marine technology centers, including Hamburg, Bremen, and coastal production facilities.
Norway follows with a 22.1% share in 2025, projected to reach 22.5% by 2035, driven by comprehensive maritime development programs and advanced offshore technology initiatives implementing injection technologies. Netherlands holds a 19.6% share in 2025, expected to maintain 19.2% by 2035 through ongoing maritime facility upgrades and marine technology development.
Denmark commands a 15.7% share, while United Kingdom accounts for 8.9% in 2025. The Rest of Europe region is anticipated to gain momentum, expanding its collective share from 5.5% to 6.7% by 2035, attributed to increasing marine fuel injection system adoption in Mediterranean countries and emerging Eastern European maritime facilities implementing advanced injection programs.
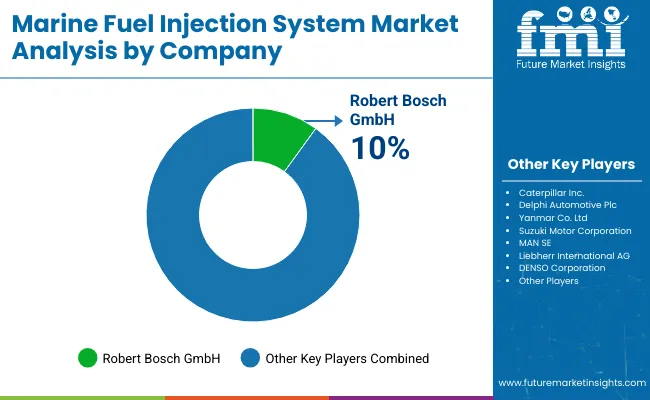
The marine fuel injection system market features approximately 15-18 meaningful players with moderate concentration, where the top three companies control roughly 30-37% of global market share through established technology platforms and extensive marine industry relationships. Competition centers on technological innovation, system reliability, and engineering expertise rather than price competition alone.
Market leaders include Robert Bosch GmbH, Caterpillar Inc., and Delphi Automotive Plc, which maintain competitive advantages through comprehensive marine solution portfolios, global manufacturing networks, and deep expertise in the marine engine and fuel system sectors, creating high switching costs for customers. These companies leverage research and development capabilities and ongoing technical support relationships to defend market positions while expanding into adjacent marine and offshore applications.
Challengers encompass Yanmar Co. Ltd and DENSO Corporation, which compete through specialized injection solutions and strong regional presence in key maritime markets. Technology specialists, including Liebherr International AG, Rolls-Royce Power Systems AG, and Suzuki Motor Corporation, focus on specific engine configurations or vertical applications, offering differentiated capabilities in injection technology, customization services, and specialized performance characteristics.
Regional players and emerging marine technology providers create competitive pressure through cost-effective solutions and rapid customization capabilities, particularly in high-growth markets including China, India, and Southeast Asia, where local presence provides advantages in customer service and regulatory compliance. Market dynamics favor companies that combine advanced injection technologies with comprehensive technical support offerings that address the complete system lifecycle from design development through ongoing operational optimization.
Marine fuel injection systems represent specialized marine technologies that enable operators to achieve 15-25% improvement in fuel efficiency compared to conventional injection systems, delivering superior operational performance and emission reduction with enhanced compliance capabilities in demanding maritime applications.
With the market projected to grow from USD 5.9 billion in 2025 to USD 8.4 billion by 2035 at a 3.5% CAGR, these injection systems offer compelling advantages - enhanced fuel efficiency, customizable injection configurations, and operational durability - making them essential for commercial shipping applications, offshore operations, and marine facilities seeking alternatives to inefficient fuel systems that compromise performance through excessive consumption.
Scaling market adoption and technological advancement requires coordinated action across maritime policy, operational standards development, equipment manufacturers, shipping industries, and marine technology investment capital.
How Governments Could Spur Local Production and Adoption?
How Industry Bodies Could Support Market Development?
How OEMs and Technology Players Could Strengthen the Ecosystem?
How Suppliers Could Navigate the Shift?
How Investors and Financial Enablers Could Unlock Value?
| Item | Value |
|---|---|
| Quantitative Units | USD 5.9 billion |
| Engine Type | 2-Stroke, 4-Stroke |
| Sales Channel | Original Equipment Manufacturer, Aftermarket |
| Engine Capacity | Up to 2000 HP, 2000 to 10000 HP, 10000 to 20000 HP, 20000 to 50000 HP, 50000 to 80000 HP, Above 80000 HP |
| Application | Service Vessels, Passenger Vessels, Cargo Carriers, Fishing Vessels, Personal Watercraft & Sailboats, Others |
| Regions Covered | North America, Latin America, Western Europe, Eastern Europe, East Asia, South Asia Pacific, Middle East & Africa |
| Country Covered | China, Germany, Australia, India, United States, and 40+ countries |
| Key Companies Profiled | Robert Bosch GmbH, Caterpillar Inc., Delphi Automotive Plc, Yanmar Co. Ltd, Suzuki Motor Corporation, MAN SE, Liebherr International AG, DENSO Corporation |
| Additional Attributes | Dollar sales by engine type and sales channel categories, regional adoption trends across East Asia, Western Europe, and South Asia Pacific, competitive landscape with injection system providers and technology integrators, marine facility requirements and specifications, integration with maritime initiatives and shipping systems, innovations in injection technology and marine systems, and development of specialized configurations with performance and durability capabilities. |
The global marine fuel injection system market is estimated to be valued at USD 5.9 billion in 2025.
The market size for the marine fuel injection system market is projected to reach USD 8.3 billion by 2035.
The marine fuel injection system market is expected to grow at a 3.5% CAGR between 2025 and 2035.
The key product types in marine fuel injection system market are 2-stroke and 4-stroke.
In terms of sales channel, aftermarket segment to command 65.8% share in the marine fuel injection system market in 2025.


Our Research Products

The "Full Research Suite" delivers actionable market intel, deep dives on markets or technologies, so clients act faster, cut risk, and unlock growth.

The Leaderboard benchmarks and ranks top vendors, classifying them as Established Leaders, Leading Challengers, or Disruptors & Challengers.

Locates where complements amplify value and substitutes erode it, forecasting net impact by horizon

We deliver granular, decision-grade intel: market sizing, 5-year forecasts, pricing, adoption, usage, revenue, and operational KPIs—plus competitor tracking, regulation, and value chains—across 60 countries broadly.

Spot the shifts before they hit your P&L. We track inflection points, adoption curves, pricing moves, and ecosystem plays to show where demand is heading, why it is changing, and what to do next across high-growth markets and disruptive tech

Real-time reads of user behavior. We track shifting priorities, perceptions of today’s and next-gen services, and provider experience, then pace how fast tech moves from trial to adoption, blending buyer, consumer, and channel inputs with social signals (#WhySwitch, #UX).

Partner with our analyst team to build a custom report designed around your business priorities. From analysing market trends to assessing competitors or crafting bespoke datasets, we tailor insights to your needs.
Supplier Intelligence
Discovery & Profiling
Capacity & Footprint
Performance & Risk
Compliance & Governance
Commercial Readiness
Who Supplies Whom
Scorecards & Shortlists
Playbooks & Docs
Category Intelligence
Definition & Scope
Demand & Use Cases
Cost Drivers
Market Structure
Supply Chain Map
Trade & Policy
Operating Norms
Deliverables
Buyer Intelligence
Account Basics
Spend & Scope
Procurement Model
Vendor Requirements
Terms & Policies
Entry Strategy
Pain Points & Triggers
Outputs
Pricing Analysis
Benchmarks
Trends
Should-Cost
Indexation
Landed Cost
Commercial Terms
Deliverables
Brand Analysis
Positioning & Value Prop
Share & Presence
Customer Evidence
Go-to-Market
Digital & Reputation
Compliance & Trust
KPIs & Gaps
Outputs
Full Research Suite comprises of:
Market outlook & trends analysis
Interviews & case studies
Strategic recommendations
Vendor profiles & capabilities analysis
5-year forecasts
8 regions and 60+ country-level data splits
Market segment data splits
12 months of continuous data updates
DELIVERED AS:
PDF EXCEL ONLINE
Fuel Injection System Market Growth - Trends & Forecast 2025 to 2035
Gas & Dual-Fuel Injection Systems Market Size and Share Forecast Outlook 2025 to 2035
Two Wheeler Fuel Injection System Market Size and Share Forecast Outlook 2025 to 2035
Demand for Gas & Dual-Fuel Injection Systems in USA Size and Share Forecast Outlook 2025 to 2035
Marine Fuel Filter Market Growth – Trends & Forecast 2025 to 2035
Marine Fuel Additives Market
Marine HVAC System Market Size and Share Forecast Outlook 2025 to 2035
Port Fuel Injection Units Market Size and Share Forecast Outlook 2025 to 2035
Marine Steering Systems Market Size and Share Forecast Outlook 2025 to 2035
Fuel rail for CNG Systems Market Size and Share Forecast Outlook 2025 to 2035
Marine Propulsion Systems Market
Marine Ventilation Systems Market
Marine Power Battery System Market Size and Share Forecast Outlook 2025 to 2035
Marine Engine Cooling Systems Market
Aircraft Fuel Systems Market Size and Share Forecast Outlook 2025 to 2035
Aircraft Fuel System Market
Marine Fire Extinguishing System Market Size and Share Forecast Outlook 2025 to 2035
Needle-Free Injection System Market Size and Share Forecast Outlook 2025 to 2035
Automotive Fuel Delivery System Market Trends - Growth & Forecast 2025 to 2035
Marine Selective Catalytic Reduction Systems Market Growth – Trends & Forecast 2025 to 2035

Thank you!
You will receive an email from our Business Development Manager. Please be sure to check your SPAM/JUNK folder too.
Chat With
MaRIA