Reports

- Global Locations -

Headquarters

Future Market Insights, Inc.

Christiana Corporate, 200
Continental Drive, Suite 401,
Newark, Delaware - 19713,
United States

T: +1-845-579-5705

Americas

Future Market Insights, Inc.

616 Corporate Way, Suite 2-9018,
Valley Cottage, NY 10989, United States

T: +1-347-918-3531

MEA

Future Market Insights

1602-6 Jumeirah Bay X2 Tower, Plot No: JLT-PH2-X2A,
Jumeirah Lakes Towers, Dubai,
United Arab Emirates

Europe

Future Market Insights

3rd Floor, 207 Regent Street,
W1B 3HH London
United Kingdom

T: + 44 (0) 20 8123 9659
D: +44 (0) 20 3287 4268

Asia Pacific

Future Market Insights

IndiaLand Global Tech Park, Unit UG-1, Behind Grand HighStreet, Phase 1, Hinjawadi, MH, Pune – 411057, India

Marine Cranes Market Outlook (2022-2032)

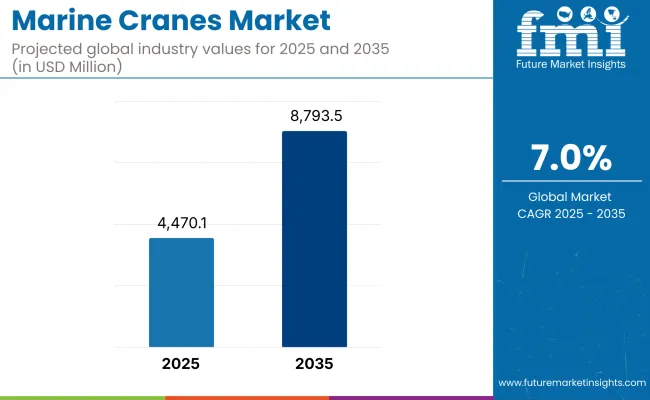
[333 Pages Report] The global marine cranes market is forecasted to be appraised at US$ 7945.2 million by 2032, up from US$ 3868.2 million in 2022, advancing at a CAGR of 7.5% during the forecast period.

Marine cranes are the types of machinery that are equipped with hoist ropes, wire ropes or chains, and sheaves, which are used both for lifting and lowering materials and to move them horizontally.

Report Attribute Details
Marine Cranes Market Value (2022) US$ 3868.2 Million
Marine Cranes Market Anticipated Value (2032) US$ 7945.2 Million
Marine Cranes Projected Growth Rate (2022-2032) 7.5%

The sales of marine cranes are likely to rise as this product is highly being used in transporting cargo or personnel for marine vessels, oil drilling platforms, navy ships, and fishing vessels. This factor is likely to boost the demand for marine cranes during the forecast period.

Moreover, rapidly growing industrialization, mainly in emerging nations, and noteworthy prominence in energy conservation have led to some remarkable advancements in the global marine crane market and are anticipated to act as a prime factor in fueling the significant growth of the marine crane market size.


Don't pay for what you don't need

Customize your report by selecting specific countries or regions and save 30%!

Key Drivers and Restraints in the Marine Cranes Market

The significant factors driving the growth of the marine crane market are increasing subsea construction and oil exploration operations and rising demand for renewable energy.

Moreover, these subsea construction machines are primarily used due to their high precision in heavy-duty operations. Some of them are assembly, repair, and supply of oil & gas extraction systems. This is driving the expansion and demand of the marine crane market.

Furthermore, increasing oil field discoveries are fuelling the need for equipment like marine cranes and increasing merchant vessels for transporting cargo and passengers, bolstering the sales of marine cranes during the forecast period.

In addition to this, there is flexibility, low operational cost, high safety, and low maintenance cost for these marine cranes, which is driving the market size for this product. Also, robust collaboration among the public and private players are driving the marine cranes market.

Furthermore, in the past few years, hydraulic, marine cranes have gained significant traction in the global marine crane market due to their high reliability and high load-bearing capacity, driving the market share for marine cranes.

Moreover, new projects associated with offshore wind turbines are roaring and also supporting the growth of lattice boom marine cranes in European countries. With these key driving factors, the future stance for the global marine crane market is projected to persist positively, and the market is expected to witness high CAGR growth in the upcoming years.

However, the complex installation process and requirement for skilled technicians & laborers to prevent damages hamper the growth of the market. In addition to this, the fluctuating raw materials price is also expected to restrain the growth of the marine cranes market.

Furthermore, high operational risk, for instance, position accuracy, suppression, and collision avoidance, may also hinder the global marine crane market throughout the forecast period. Moreover, a curb in the production of gas and oil industries has significantly impacted the growth of this market.

New product development and technology up-gradations and governmental regimes to deteriorate regional manufacturer is gaining high traction in the global marine crane market during the forecast period.

What is the Regional Outlook for Marine Cranes Market?

At present, it is anticipated that the Asia-Pacific regions are likely to dominate the global marine cranes market owing to the high presence of shipbuilding industries and transportation, particularly in South Korea, India, and China.

Furthermore, there is a rise in population and rapid urbanization, which is leading to increased seaborne traffic in these regions, and this factor is likely to hike the demand for the global marine cranes market in this region.

Currently, North American regions are holding 26% of the total market share and are also gaining significant traction in the global marine crane market during the forecast period. Europe is accountable for 30% of the global market share of marine cranes; increased offshore vessels have increased the demand for offshore marine cranes.

It is expected that these regions are going to influence market performance for marine cranes, improving the sales of marine in the near future.

Nikhil Kaitwade
Nikhil Kaitwade

Principal Consultant

Talk to Analyst

Find your sweet spots for generating winning opportunities in this market.

Key Trends in the Marine Cranes Market

Some key trends in the marine cranes market are:

  • Adoption of marine cranes to offer real-time geographical location tracking as well as monitoring of business assets, personnel and processers creating a huge opportunity for the marine cranes market.
  • With the surging requirement for profitable and equitable distribution of resources and bolstering cost efficiency, marine cranes are experiencing high-volume undertakings and will continue to see a rapid growth trajectory, particularly in the deep-sea wind energy space.

Who are the Key Players in the Marine Cranes Market?

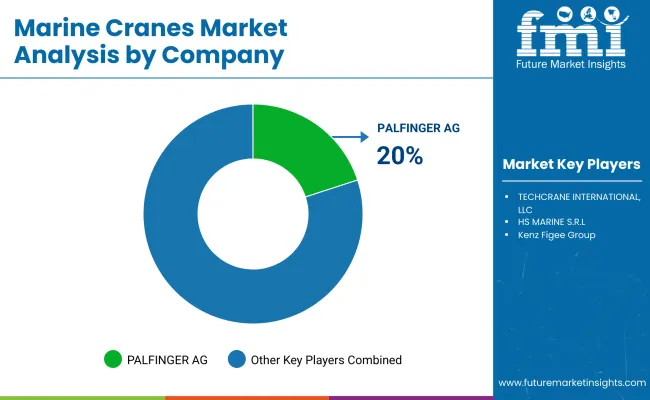
Some of the key players in the marine cranes market are: TECHCRANE INTERNATIONAL, LLC., Anupam Industries Limited, PALFINGER AG, DMW Marine Group, LLC, HS MARINE S.R.L., Kenz Figee Group, HEILA Cranes S.p.a., Fjell Marine Service AS, Gulf Crane Services, NINGENMURA COMPANY, INDUSTRIAGUERRA, S.A., Atlas Polar Company Limited, Favelle Favco Group.

Get the data you need at a Fraction of the cost

Personalize your report by choosing insights you need
and save 40%!

Report Scope

Report Attribute Details
Growth Rate CAGR of 7.5% from 2022 to 2032
Base Year for Estimation 2021
Historical Data 2014-2020
Forecast Period 2022-2032
Quantitative Units Revenue in USD million and CAGR from 2022-2032
Report Coverage Revenue Forecast, Volume Forecast, Company Ranking, Competitive Landscape, Growth Factors, Trends and Pricing Analysis
Segments Covered
  • Type
  • Lifting Capacity
  • Application
  • Region
Regions Covered
  • North America
  • Latin America
  • Europe
  • East Asia
  • South Asia
  • Oceania
  • Middle East and Africa
Key Countries Profiled
  • U.S
  • Canada
  • Brazil
  • Argentina
  • Germany
  • U.K
  • France
  • Spain
  • Italy
  • Nordics
  • BENELUX
  • Australia & New Zealand
  • China
  • India
  • ASEAN
  • GCC
  • South Africa
Key Companies Profiled
  • TECHCRANE INTERNATIONAL, LLC.
  • Anupam Industries Limited
  • PALFINGER AG
  • DMW Marine Group, LLC
  • HS MARINE S.R.L.
  • Kenz Figee Group
  • HEILA Cranes S.p.a.
  • Fjell Marine Service AS
  • Gulf Crane Services
  • NINGENMURA COMPANY
  • INDUSTRIAGUERRA, S.A.
  • Atlas Polar Company Limited
  • Favelle Favco Group
Customization Available Upon Request

Key Segments of the Marine Cranes Market

By Type:

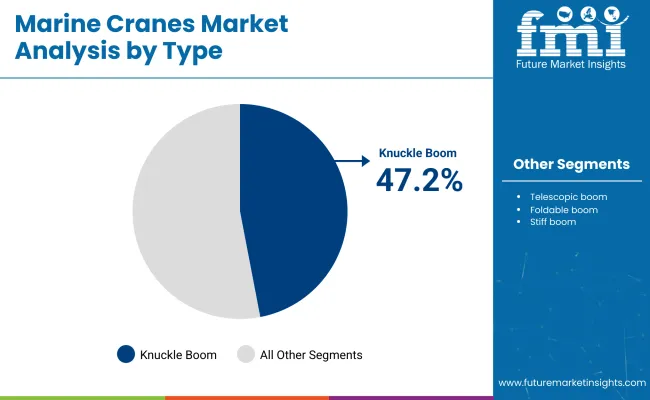
  • Knuckle boom
  • Telescopic boom
  • Foldable boom
  • Stiff boom

By Lifting Capacity:

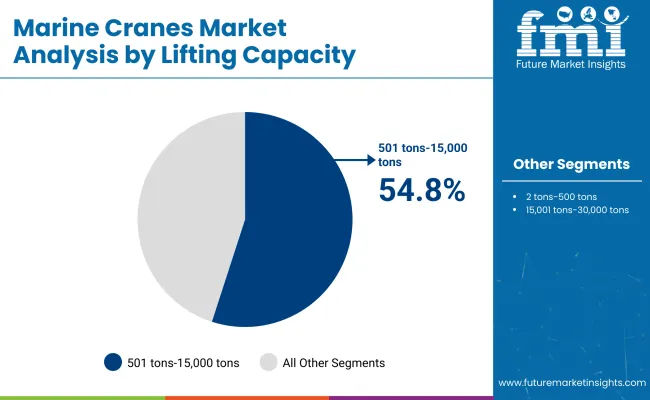
  • 2 tons–500 tons
  • 501 tons–15,000 tons
  • 15,001 tons–30,000 tons

By Application:

  • Oil & gas platforms
  • Workboats, research
  • Fishing vessels
  • Government & military

Frequently Asked Questions

At what CAGR the Marine Cranes Market is predicted to grow during the forecast period?

The marine cranes market is precited to grow at a CAGR of 7.5% during the forecast period.

What would be the valuation of the Marine Bearings Market by 2032?

The marine cranes market would be US$ 7945.2 million by the end of 2032.

Which region is likely to dominate the Marine Cranes Market during the forecast period?

The Asia Pacific regions are anticipated to dominate the marine cranes market during the forecast period.

Who are the Key Players in the Marine Cranes Market?

Some of the key players in the marine cranes market are TECHCRANE INTERNATIONAL, LLC., Anupam Industries Limited, PALFINGER AG, DMW Marine Group, LLC, HS MARINE S.R.L., Kenz Figee Group, HEILA Cranes S.p.a., Fjell Marine Service AS, Gulf Crane Services, NINGENMURA COMPANY, INDUSTRIAGUERRA, S.A., Atlas Polar Company Limited, Favelle Favco Group.

Table of Content

1. Executive Summary

    1.1. Global Market Outlook

    1.2. Demand-side Trends

    1.3. Supply-side Trends

    1.4. Technology Roadmap Analysis

    1.5. Analysis and Recommendations

2. Market Overview

    2.1. Market Coverage / Taxonomy

    2.2. Market Definition / Scope / Limitations

3. Market Background

    3.1. Market Dynamics

        3.1.1. Drivers

        3.1.2. Restraints

        3.1.3. Opportunity

        3.1.4. Trends

    3.2. Scenario Forecast

        3.2.1. Demand in Optimistic Scenario

        3.2.2. Demand in Likely Scenario

        3.2.3. Demand in Conservative Scenario

    3.3. Opportunity Map Analysis

    3.4. Product Life Cycle Analysis

    3.5. Supply Chain Analysis

        3.5.1. Supply Side Participants and their Roles

            3.5.1.1. Producers

            3.5.1.2. Mid-Level Participants (Traders/ Agents/ Brokers)

            3.5.1.3. Wholesalers and Distributors

        3.5.2. Value Added and Value Created at Node in the Supply Chain

        3.5.3. List of Raw Material Suppliers

        3.5.4. List of Existing and Potential Buyer’s

    3.6. Investment Feasibility Matrix

    3.7. Value Chain Analysis

        3.7.1. Profit Margin Analysis

        3.7.2. Wholesalers and Distributors

        3.7.3. Retailers

    3.8. PESTLE and Porter’s Analysis

    3.9. Regulatory Landscape

        3.9.1. By Key Regions

        3.9.2. By Key Countries

    3.10. Regional Parent Market Outlook

    3.11. Production and Consumption Statistics

    3.12. Import and Export Statistics

4. Global Market Analysis 2017-2021 and Forecast, 2022-2032

    4.1. Historical Market Size Value (US$ Mn) & Volume (Units) Analysis, 2017-2021

    4.2. Current and Future Market Size Value (US$ Mn) & Volume (Units) Projections, 2022-2032

        4.2.1. Y-o-Y Growth Trend Analysis

        4.2.2. Absolute $ Opportunity Analysis

5. Global Market Analysis 2017-2021 and Forecast 2022-2032, By Product Type

    5.1. Introduction / Key Findings

    5.2. Historical Market Size Value (US$ Mn) & Volume (Units) Analysis By Product Type, 2017-2021

    5.3. Current and Future Market Size Value (US$ Mn) & Volume (Units) Analysis and Forecast By Product Type, 2022-2032

        5.3.1. Hydraulic Marine Cranes

        5.3.2. Electric Marine Cranes

        5.3.3. Others

    5.4. Y-o-Y Growth Trend Analysis By Product Type, 2017-2021

    5.5. Absolute $ Opportunity Analysis By Product Type, 2022-2032

6. Global Market Analysis 2017-2021 and Forecast 2022-2032, By Design

    6.1. Introduction / Key Findings

    6.2. Historical Market Size Value (US$ Mn) & Volume (Units) Analysis By Design, 2017-2021

    6.3. Current and Future Market Size Value (US$ Mn) & Volume (Units) Analysis and Forecast By Design, 2022-2032

        6.3.1. Knuckle Boom Marine Crane

        6.3.2. Telescopic Marine Crane

        6.3.3. Lattice Boom Marine Crane

    6.4. Y-o-Y Growth Trend Analysis By Design, 2017-2021

    6.5. Absolute $ Opportunity Analysis By Design, 2022-2032

7. Global Market Analysis 2017-2021 and Forecast 2022-2032, By Application

    7.1. Introduction / Key Findings

    7.2. Historical Market Size Value (US$ Mn) & Volume (Units) Analysis By Application, 2017-2021

    7.3. Current and Future Market Size Value (US$ Mn) & Volume (Units) Analysis and Forecast By Application, 2022-2032

        7.3.1. Vessels Marine Cranes

        7.3.2. Offshore Marine Cranes

        7.3.3. Other Applications

    7.4. Y-o-Y Growth Trend Analysis By Application, 2017-2021

    7.5. Absolute $ Opportunity Analysis By Application, 2022-2032

8. Global Market Analysis 2017-2021 and Forecast 2022-2032, By End User

    8.1. Introduction / Key Findings

    8.2. Historical Market Size Value (US$ Mn) & Volume (Units) Analysis By End User, 2017-2021

    8.3. Current and Future Market Size Value (US$ Mn) & Volume (Units) Analysis and Forecast By End User, 2022-2032

        8.3.1. Terminal

        8.3.2. Port

        8.3.3. Others

    8.4. Y-o-Y Growth Trend Analysis By End User, 2017-2021

    8.5. Absolute $ Opportunity Analysis By End User, 2022-2032

9. Global Market Analysis 2017-2021 and Forecast 2022-2032, By Sales Channel

    9.1. Introduction / Key Findings

    9.2. Historical Market Size Value (US$ Mn) & Volume (Units) Analysis By Sales Channel, 2017-2021

    9.3. Current and Future Market Size Value (US$ Mn) & Volume (Units) Analysis and Forecast By Sales Channel, 2022-2032

        9.3.1. OEMs

        9.3.2. Aftermarket

    9.4. Y-o-Y Growth Trend Analysis By Sales Channel, 2017-2021

    9.5. Absolute $ Opportunity Analysis By Sales Channel, 2022-2032

10. Global Market Analysis 2017-2021 and Forecast 2022-2032, By Region

    10.1. Introduction

    10.2. Historical Market Size Value (US$ Mn) & Volume (Units) Analysis By Region, 2017-2021

    10.3. Current Market Size Value (US$ Mn) & Volume (Units) Analysis and Forecast By Region, 2022-2032

        10.3.1. North America

        10.3.2. Latin America

        10.3.3. Europe

        10.3.4. Asia Pacific

        10.3.5. MEA

    10.4. Market Attractiveness Analysis By Region

11. North America Market Analysis 2017-2021 and Forecast 2022-2032, By Country

    11.1. Historical Market Size Value (US$ Mn) & Volume (Units) Trend Analysis By Market Taxonomy, 2017-2021

    11.2. Market Size Value (US$ Mn) & Volume (Units) Forecast By Market Taxonomy, 2022-2032

        11.2.1. By Country

            11.2.1.1. U.S.

            11.2.1.2. Canada

        11.2.2. By Product Type

        11.2.3. By Design

        11.2.4. By Application

        11.2.5. By End User

        11.2.6. By Sales Channel

    11.3. Market Attractiveness Analysis

        11.3.1. By Country

        11.3.2. By Product Type

        11.3.3. By Design

        11.3.4. By Application

        11.3.5. By End User

        11.3.6. By Sales Channel

    11.4. Key Takeaways

12. Latin America Market Analysis 2017-2021 and Forecast 2022-2032, By Country

    12.1. Historical Market Size Value (US$ Mn) & Volume (Units) Trend Analysis By Market Taxonomy, 2017-2021

    12.2. Market Size Value (US$ Mn) & Volume (Units) Forecast By Market Taxonomy, 2022-2032

        12.2.1. By Country

            12.2.1.1. Brazil

            12.2.1.2. Mexico

            12.2.1.3. Rest of Latin America

        12.2.2. By Product Type

        12.2.3. By Design

        12.2.4. By Application

        12.2.5. By End User

        12.2.6. By Sales Channel

    12.3. Market Attractiveness Analysis

        12.3.1. By Country

        12.3.2. By Product Type

        12.3.3. By Design

        12.3.4. By Application

        12.3.5. By End User

        12.3.6. By Sales Channel

    12.4. Key Takeaways

13. Europe Market Analysis 2017-2021 and Forecast 2022-2032, By Country

    13.1. Historical Market Size Value (US$ Mn) & Volume (Units) Trend Analysis By Market Taxonomy, 2017-2021

    13.2. Market Size Value (US$ Mn) & Volume (Units) Forecast By Market Taxonomy, 2022-2032

        13.2.1. By Country

            13.2.1.1. Germany

            13.2.1.2. U.K.

            13.2.1.3. France

            13.2.1.4. Spain

            13.2.1.5. Italy

            13.2.1.6. Rest of Europe

        13.2.2. By Product Type

        13.2.3. By Design

        13.2.4. By Application

        13.2.5. By End User

        13.2.6. By Sales Channel

    13.3. Market Attractiveness Analysis

        13.3.1. By Country

        13.3.2. By Product Type

        13.3.3. By Design

        13.3.4. By Application

        13.3.5. By End User

        13.3.6. By Sales Channel

    13.4. Key Takeaways

14. Asia Pacific Market Analysis 2017-2021 and Forecast 2022-2032, By Country

    14.1. Historical Market Size Value (US$ Mn) & Volume (Units) Trend Analysis By Market Taxonomy, 2017-2021

    14.2. Market Size Value (US$ Mn) & Volume (Units) Forecast By Market Taxonomy, 2022-2032

        14.2.1. By Country

            14.2.1.1. China

            14.2.1.2. Japan

            14.2.1.3. South Korea

            14.2.1.4. Malaysia

            14.2.1.5. Singapore

            14.2.1.6. Australia

            14.2.1.7. New Zealand

            14.2.1.8. Rest of APAC

        14.2.2. By Product Type

        14.2.3. By Design

        14.2.4. By Application

        14.2.5. By End User

        14.2.6. By Sales Channel

    14.3. Market Attractiveness Analysis

        14.3.1. By Country

        14.3.2. By Product Type

        14.3.3. By Design

        14.3.4. By Application

        14.3.5. By End User

        14.3.6. By Sales Channel

    14.4. Key Takeaways

15. MEA Market Analysis 2017-2021 and Forecast 2022-2032, By Country

    15.1. Historical Market Size Value (US$ Mn) & Volume (Units) Trend Analysis By Market Taxonomy, 2017-2021

    15.2. Market Size Value (US$ Mn) & Volume (Units) Forecast By Market Taxonomy, 2022-2032

        15.2.1. By Country

            15.2.1.1. GCC Countries

            15.2.1.2. South Africa

            15.2.1.3. Israel

            15.2.1.4. Rest of MEA

        15.2.2. By Product Type

        15.2.3. By Design

        15.2.4. By Application

        15.2.5. By End User

        15.2.6. By Sales Channel

    15.3. Market Attractiveness Analysis

        15.3.1. By Country

        15.3.2. By Product Type

        15.3.3. By Design

        15.3.4. By Application

        15.3.5. By End User

        15.3.6. By Sales Channel

    15.4. Key Takeaways

16. Key Countries Market Analysis

    16.1. U.S.

        16.1.1. Pricing Analysis

        16.1.2. Market Share Analysis, 2021

            16.1.2.1. By Product Type

            16.1.2.2. By Design

            16.1.2.3. By Application

            16.1.2.4. By End User

            16.1.2.5. By Sales Channel

    16.2. Canada

        16.2.1. Pricing Analysis

        16.2.2. Market Share Analysis, 2021

            16.2.2.1. By Product Type

            16.2.2.2. By Design

            16.2.2.3. By Application

            16.2.2.4. By End User

            16.2.2.5. By Sales Channel

    16.3. Brazil

        16.3.1. Pricing Analysis

        16.3.2. Market Share Analysis, 2021

            16.3.2.1. By Product Type

            16.3.2.2. By Design

            16.3.2.3. By Application

            16.3.2.4. By End User

            16.3.2.5. By Sales Channel

    16.4. Mexico

        16.4.1. Pricing Analysis

        16.4.2. Market Share Analysis, 2021

            16.4.2.1. By Product Type

            16.4.2.2. By Design

            16.4.2.3. By Application

            16.4.2.4. By End User

            16.4.2.5. By Sales Channel

    16.5. Germany

        16.5.1. Pricing Analysis

        16.5.2. Market Share Analysis, 2021

            16.5.2.1. By Product Type

            16.5.2.2. By Design

            16.5.2.3. By Application

            16.5.2.4. By End User

            16.5.2.5. By Sales Channel

    16.6. U.K.

        16.6.1. Pricing Analysis

        16.6.2. Market Share Analysis, 2021

            16.6.2.1. By Product Type

            16.6.2.2. By Design

            16.6.2.3. By Application

            16.6.2.4. By End User

            16.6.2.5. By Sales Channel

    16.7. France

        16.7.1. Pricing Analysis

        16.7.2. Market Share Analysis, 2021

            16.7.2.1. By Product Type

            16.7.2.2. By Design

            16.7.2.3. By Application

            16.7.2.4. By End User

            16.7.2.5. By Sales Channel

    16.8. Spain

        16.8.1. Pricing Analysis

        16.8.2. Market Share Analysis, 2021

            16.8.2.1. By Product Type

            16.8.2.2. By Design

            16.8.2.3. By Application

            16.8.2.4. By End User

            16.8.2.5. By Sales Channel

    16.9. Italy

        16.9.1. Pricing Analysis

        16.9.2. Market Share Analysis, 2021

            16.9.2.1. By Product Type

            16.9.2.2. By Design

            16.9.2.3. By Application

            16.9.2.4. By End User

            16.9.2.5. By Sales Channel

    16.10. China

        16.10.1. Pricing Analysis

        16.10.2. Market Share Analysis, 2021

            16.10.2.1. By Product Type

            16.10.2.2. By Design

            16.10.2.3. By Application

            16.10.2.4. By End User

            16.10.2.5. By Sales Channel

    16.11. Japan

        16.11.1. Pricing Analysis

        16.11.2. Market Share Analysis, 2021

            16.11.2.1. By Product Type

            16.11.2.2. By Design

            16.11.2.3. By Application

            16.11.2.4. By End User

            16.11.2.5. By Sales Channel

    16.12. South Korea

        16.12.1. Pricing Analysis

        16.12.2. Market Share Analysis, 2021

            16.12.2.1. By Product Type

            16.12.2.2. By Design

            16.12.2.3. By Application

            16.12.2.4. By End User

            16.12.2.5. By Sales Channel

    16.13. Malaysia

        16.13.1. Pricing Analysis

        16.13.2. Market Share Analysis, 2021

            16.13.2.1. By Product Type

            16.13.2.2. By Design

            16.13.2.3. By Application

            16.13.2.4. By End User

            16.13.2.5. By Sales Channel

    16.14. Singapore

        16.14.1. Pricing Analysis

        16.14.2. Market Share Analysis, 2021

            16.14.2.1. By Product Type

            16.14.2.2. By Design

            16.14.2.3. By Application

            16.14.2.4. By End User

            16.14.2.5. By Sales Channel

    16.15. Australia

        16.15.1. Pricing Analysis

        16.15.2. Market Share Analysis, 2021

            16.15.2.1. By Product Type

            16.15.2.2. By Design

            16.15.2.3. By Application

            16.15.2.4. By End User

            16.15.2.5. By Sales Channel

    16.16. New Zealand

        16.16.1. Pricing Analysis

        16.16.2. Market Share Analysis, 2021

            16.16.2.1. By Product Type

            16.16.2.2. By Design

            16.16.2.3. By Application

            16.16.2.4. By End User

            16.16.2.5. By Sales Channel

    16.17. GCC Countries

        16.17.1. Pricing Analysis

        16.17.2. Market Share Analysis, 2021

            16.17.2.1. By Product Type

            16.17.2.2. By Design

            16.17.2.3. By Application

            16.17.2.4. By End User

            16.17.2.5. By Sales Channel

    16.18. South Africa

        16.18.1. Pricing Analysis

        16.18.2. Market Share Analysis, 2021

            16.18.2.1. By Product Type

            16.18.2.2. By Design

            16.18.2.3. By Application

            16.18.2.4. By End User

            16.18.2.5. By Sales Channel

    16.19. Israel

        16.19.1. Pricing Analysis

        16.19.2. Market Share Analysis, 2021

            16.19.2.1. By Product Type

            16.19.2.2. By Design

            16.19.2.3. By Application

            16.19.2.4. By End User

            16.19.2.5. By Sales Channel

17. Market Structure Analysis

    17.1. Competition Dashboard

    17.2. Competition Benchmarking

    17.3. Market Share Analysis of Top Players

        17.3.1. By Regional

        17.3.2. By Product Type

        17.3.3. By Design

        17.3.4. By Application

        17.3.5. By End User

        17.3.6. By Sales Channel

18. Competition Analysis

    18.1. Competition Deep Dive

        18.1.1. TECHCRANE INTERNATIONAL, LLC.

            18.1.1.1. Overview

            18.1.1.2. Product Portfolio

            18.1.1.3. Profitability by Market Segments

            18.1.1.4. Sales Footprint

            18.1.1.5. Strategy Overview

                18.1.1.5.1. Marketing Strategy

                18.1.1.5.2. Product Strategy

                18.1.1.5.3. Channel Strategy

        18.1.2. Anupam Industries Limited

            18.1.2.1. Overview

            18.1.2.2. Product Portfolio

            18.1.2.3. Profitability by Market Segments

            18.1.2.4. Sales Footprint

            18.1.2.5. Strategy Overview

                18.1.2.5.1. Marketing Strategy

                18.1.2.5.2. Product Strategy

                18.1.2.5.3. Channel Strategy

        18.1.3. PALFINGER AG

            18.1.3.1. Overview

            18.1.3.2. Product Portfolio

            18.1.3.3. Profitability by Market Segments

            18.1.3.4. Sales Footprint

            18.1.3.5. Strategy Overview

                18.1.3.5.1. Marketing Strategy

                18.1.3.5.2. Product Strategy

                18.1.3.5.3. Channel Strategy

        18.1.4. DMW Marine Group, LLC

            18.1.4.1. Overview

            18.1.4.2. Product Portfolio

            18.1.4.3. Profitability by Market Segments

            18.1.4.4. Sales Footprint

            18.1.4.5. Strategy Overview

                18.1.4.5.1. Marketing Strategy

                18.1.4.5.2. Product Strategy

                18.1.4.5.3. Channel Strategy

        18.1.5. HS MARINE S.R.L.

            18.1.5.1. Overview

            18.1.5.2. Product Portfolio

            18.1.5.3. Profitability by Market Segments

            18.1.5.4. Sales Footprint

            18.1.5.5. Strategy Overview

                18.1.5.5.1. Marketing Strategy

                18.1.5.5.2. Product Strategy

                18.1.5.5.3. Channel Strategy

        18.1.6. Kenz Figee Group

            18.1.6.1. Overview

            18.1.6.2. Product Portfolio

            18.1.6.3. Profitability by Market Segments

            18.1.6.4. Sales Footprint

            18.1.6.5. Strategy Overview

                18.1.6.5.1. Marketing Strategy

                18.1.6.5.2. Product Strategy

                18.1.6.5.3. Channel Strategy

        18.1.7. HEILA Cranes S.p.a.

            18.1.7.1. Overview

            18.1.7.2. Product Portfolio

            18.1.7.3. Profitability by Market Segments

            18.1.7.4. Sales Footprint

            18.1.7.5. Strategy Overview

                18.1.7.5.1. Marketing Strategy

                18.1.7.5.2. Product Strategy

                18.1.7.5.3. Channel Strategy

        18.1.8. Fjell Marine Service AS

            18.1.8.1. Overview

            18.1.8.2. Product Portfolio

            18.1.8.3. Profitability by Market Segments

            18.1.8.4. Sales Footprint

            18.1.8.5. Strategy Overview

                18.1.8.5.1. Marketing Strategy

                18.1.8.5.2. Product Strategy

                18.1.8.5.3. Channel Strategy

        18.1.9. Gulf Crane Services

            18.1.9.1. Overview

            18.1.9.2. Product Portfolio

            18.1.9.3. Profitability by Market Segments

            18.1.9.4. Sales Footprint

            18.1.9.5. Strategy Overview

                18.1.9.5.1. Marketing Strategy

                18.1.9.5.2. Product Strategy

                18.1.9.5.3. Channel Strategy

        18.1.10. NINGENMURA COMPANY

            18.1.10.1. Overview

            18.1.10.2. Product Portfolio

            18.1.10.3. Profitability by Market Segments

            18.1.10.4. Sales Footprint

            18.1.10.5. Strategy Overview

                18.1.10.5.1. Marketing Strategy

                18.1.10.5.2. Product Strategy

                18.1.10.5.3. Channel Strategy

        18.1.11. INDUSTRIAGUERRA, S.A.

            18.1.11.1. Overview

            18.1.11.2. Product Portfolio

            18.1.11.3. Profitability by Market Segments

            18.1.11.4. Sales Footprint

            18.1.11.5. Strategy Overview

                18.1.11.5.1. Marketing Strategy

                18.1.11.5.2. Product Strategy

                18.1.11.5.3. Channel Strategy

        18.1.12. Atlas Polar Company Limited

            18.1.12.1. Overview

            18.1.12.2. Product Portfolio

            18.1.12.3. Profitability by Market Segments

            18.1.12.4. Sales Footprint

            18.1.12.5. Strategy Overview

                18.1.12.5.1. Marketing Strategy

                18.1.12.5.2. Product Strategy

                18.1.12.5.3. Channel Strategy

        18.1.13. Favelle Favco Group

            18.1.13.1. Overview

            18.1.13.2. Product Portfolio

            18.1.13.3. Profitability by Market Segments

            18.1.13.4. Sales Footprint

            18.1.13.5. Strategy Overview

                18.1.13.5.1. Marketing Strategy

                18.1.13.5.2. Product Strategy

                18.1.13.5.3. Channel Strategy

19. Assumptions & Acronyms Used

20. Research Methodology

List of Tables

Table 1: Global Market Value (US$ Mn) Forecast by Region, 2017-2032

Table 2: Global Market Volume (Units) Forecast by Region, 2017-2032

Table 3: Global Market Value (US$ Mn) Forecast by Product Type, 2017-2032

Table 4: Global Market Volume (Units) Forecast by Product Type, 2017-2032

Table 5: Global Market Value (US$ Mn) Forecast by Design, 2017-2032

Table 6: Global Market Volume (Units) Forecast by Design, 2017-2032

Table 7: Global Market Value (US$ Mn) Forecast by Application, 2017-2032

Table 8: Global Market Volume (Units) Forecast by Application, 2017-2032

Table 9: Global Market Value (US$ Mn) Forecast by End User, 2017-2032

Table 10: Global Market Volume (Units) Forecast by End User, 2017-2032

Table 11: Global Market Value (US$ Mn) Forecast by Sales Channel, 2017-2032

Table 12: Global Market Volume (Units) Forecast by Sales Channel, 2017-2032

Table 13: North America Market Value (US$ Mn) Forecast by Country, 2017-2032

Table 14: North America Market Volume (Units) Forecast by Country, 2017-2032

Table 15: North America Market Value (US$ Mn) Forecast by Product Type, 2017-2032

Table 16: North America Market Volume (Units) Forecast by Product Type, 2017-2032

Table 17: North America Market Value (US$ Mn) Forecast by Design, 2017-2032

Table 18: North America Market Volume (Units) Forecast by Design, 2017-2032

Table 19: North America Market Value (US$ Mn) Forecast by Application, 2017-2032

Table 20: North America Market Volume (Units) Forecast by Application, 2017-2032

Table 21: North America Market Value (US$ Mn) Forecast by End User, 2017-2032

Table 22: North America Market Volume (Units) Forecast by End User, 2017-2032

Table 23: North America Market Value (US$ Mn) Forecast by Sales Channel, 2017-2032

Table 24: North America Market Volume (Units) Forecast by Sales Channel, 2017-2032

Table 25: Latin America Market Value (US$ Mn) Forecast by Country, 2017-2032

Table 26: Latin America Market Volume (Units) Forecast by Country, 2017-2032

Table 27: Latin America Market Value (US$ Mn) Forecast by Product Type, 2017-2032

Table 28: Latin America Market Volume (Units) Forecast by Product Type, 2017-2032

Table 29: Latin America Market Value (US$ Mn) Forecast by Design, 2017-2032

Table 30: Latin America Market Volume (Units) Forecast by Design, 2017-2032

Table 31: Latin America Market Value (US$ Mn) Forecast by Application, 2017-2032

Table 32: Latin America Market Volume (Units) Forecast by Application, 2017-2032

Table 33: Latin America Market Value (US$ Mn) Forecast by End User, 2017-2032

Table 34: Latin America Market Volume (Units) Forecast by End User, 2017-2032

Table 35: Latin America Market Value (US$ Mn) Forecast by Sales Channel, 2017-2032

Table 36: Latin America Market Volume (Units) Forecast by Sales Channel, 2017-2032

Table 37: Europe Market Value (US$ Mn) Forecast by Country, 2017-2032

Table 38: Europe Market Volume (Units) Forecast by Country, 2017-2032

Table 39: Europe Market Value (US$ Mn) Forecast by Product Type, 2017-2032

Table 40: Europe Market Volume (Units) Forecast by Product Type, 2017-2032

Table 41: Europe Market Value (US$ Mn) Forecast by Design, 2017-2032

Table 42: Europe Market Volume (Units) Forecast by Design, 2017-2032

Table 43: Europe Market Value (US$ Mn) Forecast by Application, 2017-2032

Table 44: Europe Market Volume (Units) Forecast by Application, 2017-2032

Table 45: Europe Market Value (US$ Mn) Forecast by End User, 2017-2032

Table 46: Europe Market Volume (Units) Forecast by End User, 2017-2032

Table 47: Europe Market Value (US$ Mn) Forecast by Sales Channel, 2017-2032

Table 48: Europe Market Volume (Units) Forecast by Sales Channel, 2017-2032

Table 49: Asia Pacific Market Value (US$ Mn) Forecast by Country, 2017-2032

Table 50: Asia Pacific Market Volume (Units) Forecast by Country, 2017-2032

Table 51: Asia Pacific Market Value (US$ Mn) Forecast by Product Type, 2017-2032

Table 52: Asia Pacific Market Volume (Units) Forecast by Product Type, 2017-2032

Table 53: Asia Pacific Market Value (US$ Mn) Forecast by Design, 2017-2032

Table 54: Asia Pacific Market Volume (Units) Forecast by Design, 2017-2032

Table 55: Asia Pacific Market Value (US$ Mn) Forecast by Application, 2017-2032

Table 56: Asia Pacific Market Volume (Units) Forecast by Application, 2017-2032

Table 57: Asia Pacific Market Value (US$ Mn) Forecast by End User, 2017-2032

Table 58: Asia Pacific Market Volume (Units) Forecast by End User, 2017-2032

Table 59: Asia Pacific Market Value (US$ Mn) Forecast by Sales Channel, 2017-2032

Table 60: Asia Pacific Market Volume (Units) Forecast by Sales Channel, 2017-2032

Table 61: MEA Market Value (US$ Mn) Forecast by Country, 2017-2032

Table 62: MEA Market Volume (Units) Forecast by Country, 2017-2032

Table 63: MEA Market Value (US$ Mn) Forecast by Product Type, 2017-2032

Table 64: MEA Market Volume (Units) Forecast by Product Type, 2017-2032

Table 65: MEA Market Value (US$ Mn) Forecast by Design, 2017-2032

Table 66: MEA Market Volume (Units) Forecast by Design, 2017-2032

Table 67: MEA Market Value (US$ Mn) Forecast by Application, 2017-2032

Table 68: MEA Market Volume (Units) Forecast by Application, 2017-2032

Table 69: MEA Market Value (US$ Mn) Forecast by End User, 2017-2032

Table 70: MEA Market Volume (Units) Forecast by End User, 2017-2032

Table 71: MEA Market Value (US$ Mn) Forecast by Sales Channel, 2017-2032

Table 72: MEA Market Volume (Units) Forecast by Sales Channel, 2017-2032

List of Charts

Figure 1: Global Market Value (US$ Mn) by Product Type, 2022-2032

Figure 2: Global Market Value (US$ Mn) by Design, 2022-2032

Figure 3: Global Market Value (US$ Mn) by Application, 2022-2032

Figure 4: Global Market Value (US$ Mn) by End User, 2022-2032

Figure 5: Global Market Value (US$ Mn) by Sales Channel, 2022-2032

Figure 6: Global Market Value (US$ Mn) by Region, 2022-2032

Figure 7: Global Market Value (US$ Mn) Analysis by Region, 2017-2032

Figure 8: Global Market Volume (Units) Analysis by Region, 2017-2032

Figure 9: Global Market Value Share (%) and BPS Analysis by Region, 2022-2032

Figure 10: Global Market Y-o-Y Growth (%) Projections by Region, 2022-2032

Figure 11: Global Market Value (US$ Mn) Analysis by Product Type, 2017-2032

Figure 12: Global Market Volume (Units) Analysis by Product Type, 2017-2032

Figure 13: Global Market Value Share (%) and BPS Analysis by Product Type, 2022-2032

Figure 14: Global Market Y-o-Y Growth (%) Projections by Product Type, 2022-2032

Figure 15: Global Market Value (US$ Mn) Analysis by Design, 2017-2032

Figure 16: Global Market Volume (Units) Analysis by Design, 2017-2032

Figure 17: Global Market Value Share (%) and BPS Analysis by Design, 2022-2032

Figure 18: Global Market Y-o-Y Growth (%) Projections by Design, 2022-2032

Figure 19: Global Market Value (US$ Mn) Analysis by Application, 2017-2032

Figure 20: Global Market Volume (Units) Analysis by Application, 2017-2032

Figure 21: Global Market Value Share (%) and BPS Analysis by Application, 2022-2032

Figure 22: Global Market Y-o-Y Growth (%) Projections by Application, 2022-2032

Figure 23: Global Market Value (US$ Mn) Analysis by End User, 2017-2032

Figure 24: Global Market Volume (Units) Analysis by End User, 2017-2032

Figure 25: Global Market Value Share (%) and BPS Analysis by End User, 2022-2032

Figure 26: Global Market Y-o-Y Growth (%) Projections by End User, 2022-2032

Figure 27: Global Market Value (US$ Mn) Analysis by Sales Channel, 2017-2032

Figure 28: Global Market Volume (Units) Analysis by Sales Channel, 2017-2032

Figure 29: Global Market Value Share (%) and BPS Analysis by Sales Channel, 2022-2032

Figure 30: Global Market Y-o-Y Growth (%) Projections by Sales Channel, 2022-2032

Figure 31: Global Market Attractiveness by Product Type, 2022-2032

Figure 32: Global Market Attractiveness by Design, 2022-2032

Figure 33: Global Market Attractiveness by Application, 2022-2032

Figure 34: Global Market Attractiveness by End User, 2022-2032

Figure 35: Global Market Attractiveness by Sales Channel, 2022-2032

Figure 36: Global Market Attractiveness by Region, 2022-2032

Figure 37: North America Market Value (US$ Mn) by Product Type, 2022-2032

Figure 38: North America Market Value (US$ Mn) by Design, 2022-2032

Figure 39: North America Market Value (US$ Mn) by Application, 2022-2032

Figure 40: North America Market Value (US$ Mn) by End User, 2022-2032

Figure 41: North America Market Value (US$ Mn) by Sales Channel, 2022-2032

Figure 42: North America Market Value (US$ Mn) by Country, 2022-2032

Figure 43: North America Market Value (US$ Mn) Analysis by Country, 2017-2032

Figure 44: North America Market Volume (Units) Analysis by Country, 2017-2032

Figure 45: North America Market Value Share (%) and BPS Analysis by Country, 2022-2032

Figure 46: North America Market Y-o-Y Growth (%) Projections by Country, 2022-2032

Figure 47: North America Market Value (US$ Mn) Analysis by Product Type, 2017-2032

Figure 48: North America Market Volume (Units) Analysis by Product Type, 2017-2032

Figure 49: North America Market Value Share (%) and BPS Analysis by Product Type, 2022-2032

Figure 50: North America Market Y-o-Y Growth (%) Projections by Product Type, 2022-2032

Figure 51: North America Market Value (US$ Mn) Analysis by Design, 2017-2032

Figure 52: North America Market Volume (Units) Analysis by Design, 2017-2032

Figure 53: North America Market Value Share (%) and BPS Analysis by Design, 2022-2032

Figure 54: North America Market Y-o-Y Growth (%) Projections by Design, 2022-2032

Figure 55: North America Market Value (US$ Mn) Analysis by Application, 2017-2032

Figure 56: North America Market Volume (Units) Analysis by Application, 2017-2032

Figure 57: North America Market Value Share (%) and BPS Analysis by Application, 2022-2032

Figure 58: North America Market Y-o-Y Growth (%) Projections by Application, 2022-2032

Figure 59: North America Market Value (US$ Mn) Analysis by End User, 2017-2032

Figure 60: North America Market Volume (Units) Analysis by End User, 2017-2032

Figure 61: North America Market Value Share (%) and BPS Analysis by End User, 2022-2032

Figure 62: North America Market Y-o-Y Growth (%) Projections by End User, 2022-2032

Figure 63: North America Market Value (US$ Mn) Analysis by Sales Channel, 2017-2032

Figure 64: North America Market Volume (Units) Analysis by Sales Channel, 2017-2032

Figure 65: North America Market Value Share (%) and BPS Analysis by Sales Channel, 2022-2032

Figure 66: North America Market Y-o-Y Growth (%) Projections by Sales Channel, 2022-2032

Figure 67: North America Market Attractiveness by Product Type, 2022-2032

Figure 68: North America Market Attractiveness by Design, 2022-2032

Figure 69: North America Market Attractiveness by Application, 2022-2032

Figure 70: North America Market Attractiveness by End User, 2022-2032

Figure 71: North America Market Attractiveness by Sales Channel, 2022-2032

Figure 72: North America Market Attractiveness by Country, 2022-2032

Figure 73: Latin America Market Value (US$ Mn) by Product Type, 2022-2032

Figure 74: Latin America Market Value (US$ Mn) by Design, 2022-2032

Figure 75: Latin America Market Value (US$ Mn) by Application, 2022-2032

Figure 76: Latin America Market Value (US$ Mn) by End User, 2022-2032

Figure 77: Latin America Market Value (US$ Mn) by Sales Channel, 2022-2032

Figure 78: Latin America Market Value (US$ Mn) by Country, 2022-2032

Figure 79: Latin America Market Value (US$ Mn) Analysis by Country, 2017-2032

Figure 80: Latin America Market Volume (Units) Analysis by Country, 2017-2032

Figure 81: Latin America Market Value Share (%) and BPS Analysis by Country, 2022-2032

Figure 82: Latin America Market Y-o-Y Growth (%) Projections by Country, 2022-2032

Figure 83: Latin America Market Value (US$ Mn) Analysis by Product Type, 2017-2032

Figure 84: Latin America Market Volume (Units) Analysis by Product Type, 2017-2032

Figure 85: Latin America Market Value Share (%) and BPS Analysis by Product Type, 2022-2032

Figure 86: Latin America Market Y-o-Y Growth (%) Projections by Product Type, 2022-2032

Figure 87: Latin America Market Value (US$ Mn) Analysis by Design, 2017-2032

Figure 88: Latin America Market Volume (Units) Analysis by Design, 2017-2032

Figure 89: Latin America Market Value Share (%) and BPS Analysis by Design, 2022-2032

Figure 90: Latin America Market Y-o-Y Growth (%) Projections by Design, 2022-2032

Figure 91: Latin America Market Value (US$ Mn) Analysis by Application, 2017-2032

Figure 92: Latin America Market Volume (Units) Analysis by Application, 2017-2032

Figure 93: Latin America Market Value Share (%) and BPS Analysis by Application, 2022-2032

Figure 94: Latin America Market Y-o-Y Growth (%) Projections by Application, 2022-2032

Figure 95: Latin America Market Value (US$ Mn) Analysis by End User, 2017-2032

Figure 96: Latin America Market Volume (Units) Analysis by End User, 2017-2032

Figure 97: Latin America Market Value Share (%) and BPS Analysis by End User, 2022-2032

Figure 98: Latin America Market Y-o-Y Growth (%) Projections by End User, 2022-2032

Figure 99: Latin America Market Value (US$ Mn) Analysis by Sales Channel, 2017-2032

Figure 100: Latin America Market Volume (Units) Analysis by Sales Channel, 2017-2032

Figure 101: Latin America Market Value Share (%) and BPS Analysis by Sales Channel, 2022-2032

Figure 102: Latin America Market Y-o-Y Growth (%) Projections by Sales Channel, 2022-2032

Figure 103: Latin America Market Attractiveness by Product Type, 2022-2032

Figure 104: Latin America Market Attractiveness by Design, 2022-2032

Figure 105: Latin America Market Attractiveness by Application, 2022-2032

Figure 106: Latin America Market Attractiveness by End User, 2022-2032

Figure 107: Latin America Market Attractiveness by Sales Channel, 2022-2032

Figure 108: Latin America Market Attractiveness by Country, 2022-2032

Figure 109: Europe Market Value (US$ Mn) by Product Type, 2022-2032

Figure 110: Europe Market Value (US$ Mn) by Design, 2022-2032

Figure 111: Europe Market Value (US$ Mn) by Application, 2022-2032

Figure 112: Europe Market Value (US$ Mn) by End User, 2022-2032

Figure 113: Europe Market Value (US$ Mn) by Sales Channel, 2022-2032

Figure 114: Europe Market Value (US$ Mn) by Country, 2022-2032

Figure 115: Europe Market Value (US$ Mn) Analysis by Country, 2017-2032

Figure 116: Europe Market Volume (Units) Analysis by Country, 2017-2032

Figure 117: Europe Market Value Share (%) and BPS Analysis by Country, 2022-2032

Figure 118: Europe Market Y-o-Y Growth (%) Projections by Country, 2022-2032

Figure 119: Europe Market Value (US$ Mn) Analysis by Product Type, 2017-2032

Figure 120: Europe Market Volume (Units) Analysis by Product Type, 2017-2032

Figure 121: Europe Market Value Share (%) and BPS Analysis by Product Type, 2022-2032

Figure 122: Europe Market Y-o-Y Growth (%) Projections by Product Type, 2022-2032

Figure 123: Europe Market Value (US$ Mn) Analysis by Design, 2017-2032

Figure 124: Europe Market Volume (Units) Analysis by Design, 2017-2032

Figure 125: Europe Market Value Share (%) and BPS Analysis by Design, 2022-2032

Figure 126: Europe Market Y-o-Y Growth (%) Projections by Design, 2022-2032

Figure 127: Europe Market Value (US$ Mn) Analysis by Application, 2017-2032

Figure 128: Europe Market Volume (Units) Analysis by Application, 2017-2032

Figure 129: Europe Market Value Share (%) and BPS Analysis by Application, 2022-2032

Figure 130: Europe Market Y-o-Y Growth (%) Projections by Application, 2022-2032

Figure 131: Europe Market Value (US$ Mn) Analysis by End User, 2017-2032

Figure 132: Europe Market Volume (Units) Analysis by End User, 2017-2032

Figure 133: Europe Market Value Share (%) and BPS Analysis by End User, 2022-2032

Figure 134: Europe Market Y-o-Y Growth (%) Projections by End User, 2022-2032

Figure 135: Europe Market Value (US$ Mn) Analysis by Sales Channel, 2017-2032

Figure 136: Europe Market Volume (Units) Analysis by Sales Channel, 2017-2032

Figure 137: Europe Market Value Share (%) and BPS Analysis by Sales Channel, 2022-2032

Figure 138: Europe Market Y-o-Y Growth (%) Projections by Sales Channel, 2022-2032

Figure 139: Europe Market Attractiveness by Product Type, 2022-2032

Figure 140: Europe Market Attractiveness by Design, 2022-2032

Figure 141: Europe Market Attractiveness by Application, 2022-2032

Figure 142: Europe Market Attractiveness by End User, 2022-2032

Figure 143: Europe Market Attractiveness by Sales Channel, 2022-2032

Figure 144: Europe Market Attractiveness by Country, 2022-2032

Figure 145: Asia Pacific Market Value (US$ Mn) by Product Type, 2022-2032

Figure 146: Asia Pacific Market Value (US$ Mn) by Design, 2022-2032

Figure 147: Asia Pacific Market Value (US$ Mn) by Application, 2022-2032

Figure 148: Asia Pacific Market Value (US$ Mn) by End User, 2022-2032

Figure 149: Asia Pacific Market Value (US$ Mn) by Sales Channel, 2022-2032

Figure 150: Asia Pacific Market Value (US$ Mn) by Country, 2022-2032

Figure 151: Asia Pacific Market Value (US$ Mn) Analysis by Country, 2017-2032

Figure 152: Asia Pacific Market Volume (Units) Analysis by Country, 2017-2032

Figure 153: Asia Pacific Market Value Share (%) and BPS Analysis by Country, 2022-2032

Figure 154: Asia Pacific Market Y-o-Y Growth (%) Projections by Country, 2022-2032

Figure 155: Asia Pacific Market Value (US$ Mn) Analysis by Product Type, 2017-2032

Figure 156: Asia Pacific Market Volume (Units) Analysis by Product Type, 2017-2032

Figure 157: Asia Pacific Market Value Share (%) and BPS Analysis by Product Type, 2022-2032

Figure 158: Asia Pacific Market Y-o-Y Growth (%) Projections by Product Type, 2022-2032

Figure 159: Asia Pacific Market Value (US$ Mn) Analysis by Design, 2017-2032

Figure 160: Asia Pacific Market Volume (Units) Analysis by Design, 2017-2032

Figure 161: Asia Pacific Market Value Share (%) and BPS Analysis by Design, 2022-2032

Figure 162: Asia Pacific Market Y-o-Y Growth (%) Projections by Design, 2022-2032

Figure 163: Asia Pacific Market Value (US$ Mn) Analysis by Application, 2017-2032

Figure 164: Asia Pacific Market Volume (Units) Analysis by Application, 2017-2032

Figure 165: Asia Pacific Market Value Share (%) and BPS Analysis by Application, 2022-2032

Figure 166: Asia Pacific Market Y-o-Y Growth (%) Projections by Application, 2022-2032

Figure 167: Asia Pacific Market Value (US$ Mn) Analysis by End User, 2017-2032

Figure 168: Asia Pacific Market Volume (Units) Analysis by End User, 2017-2032

Figure 169: Asia Pacific Market Value Share (%) and BPS Analysis by End User, 2022-2032

Figure 170: Asia Pacific Market Y-o-Y Growth (%) Projections by End User, 2022-2032

Figure 171: Asia Pacific Market Value (US$ Mn) Analysis by Sales Channel, 2017-2032

Figure 172: Asia Pacific Market Volume (Units) Analysis by Sales Channel, 2017-2032

Figure 173: Asia Pacific Market Value Share (%) and BPS Analysis by Sales Channel, 2022-2032

Figure 174: Asia Pacific Market Y-o-Y Growth (%) Projections by Sales Channel, 2022-2032

Figure 175: Asia Pacific Market Attractiveness by Product Type, 2022-2032

Figure 176: Asia Pacific Market Attractiveness by Design, 2022-2032

Figure 177: Asia Pacific Market Attractiveness by Application, 2022-2032

Figure 178: Asia Pacific Market Attractiveness by End User, 2022-2032

Figure 179: Asia Pacific Market Attractiveness by Sales Channel, 2022-2032

Figure 180: Asia Pacific Market Attractiveness by Country, 2022-2032

Figure 181: MEA Market Value (US$ Mn) by Product Type, 2022-2032

Figure 182: MEA Market Value (US$ Mn) by Design, 2022-2032

Figure 183: MEA Market Value (US$ Mn) by Application, 2022-2032

Figure 184: MEA Market Value (US$ Mn) by End User, 2022-2032

Figure 185: MEA Market Value (US$ Mn) by Sales Channel, 2022-2032

Figure 186: MEA Market Value (US$ Mn) by Country, 2022-2032

Figure 187: MEA Market Value (US$ Mn) Analysis by Country, 2017-2032

Figure 188: MEA Market Volume (Units) Analysis by Country, 2017-2032

Figure 189: MEA Market Value Share (%) and BPS Analysis by Country, 2022-2032

Figure 190: MEA Market Y-o-Y Growth (%) Projections by Country, 2022-2032

Figure 191: MEA Market Value (US$ Mn) Analysis by Product Type, 2017-2032

Figure 192: MEA Market Volume (Units) Analysis by Product Type, 2017-2032

Figure 193: MEA Market Value Share (%) and BPS Analysis by Product Type, 2022-2032

Figure 194: MEA Market Y-o-Y Growth (%) Projections by Product Type, 2022-2032

Figure 195: MEA Market Value (US$ Mn) Analysis by Design, 2017-2032

Figure 196: MEA Market Volume (Units) Analysis by Design, 2017-2032

Figure 197: MEA Market Value Share (%) and BPS Analysis by Design, 2022-2032

Figure 198: MEA Market Y-o-Y Growth (%) Projections by Design, 2022-2032

Figure 199: MEA Market Value (US$ Mn) Analysis by Application, 2017-2032

Figure 200: MEA Market Volume (Units) Analysis by Application, 2017-2032

Figure 201: MEA Market Value Share (%) and BPS Analysis by Application, 2022-2032

Figure 202: MEA Market Y-o-Y Growth (%) Projections by Application, 2022-2032

Figure 203: MEA Market Value (US$ Mn) Analysis by End User, 2017-2032

Figure 204: MEA Market Volume (Units) Analysis by End User, 2017-2032

Figure 205: MEA Market Value Share (%) and BPS Analysis by End User, 2022-2032

Figure 206: MEA Market Y-o-Y Growth (%) Projections by End User, 2022-2032

Figure 207: MEA Market Value (US$ Mn) Analysis by Sales Channel, 2017-2032

Figure 208: MEA Market Volume (Units) Analysis by Sales Channel, 2017-2032

Figure 209: MEA Market Value Share (%) and BPS Analysis by Sales Channel, 2022-2032

Figure 210: MEA Market Y-o-Y Growth (%) Projections by Sales Channel, 2022-2032

Figure 211: MEA Market Attractiveness by Product Type, 2022-2032

Figure 212: MEA Market Attractiveness by Design, 2022-2032

Figure 213: MEA Market Attractiveness by Application, 2022-2032

Figure 214: MEA Market Attractiveness by End User, 2022-2032

Figure 215: MEA Market Attractiveness by Sales Channel, 2022-2032

Figure 216: MEA Market Attractiveness by Country, 2022-2032

Recommendations

Industrial Automation

Tower Crane Market

Published : October 2023

Industrial Automation

Mobile Cranes Market

Published : July 2023

Industrial Automation

Global Mini Cranes Market

Published : June 2023

Explore Industrial Automation Insights

View Reports