Marine Collagen Market Size and Share Forecast Outlook 2025 to 2035

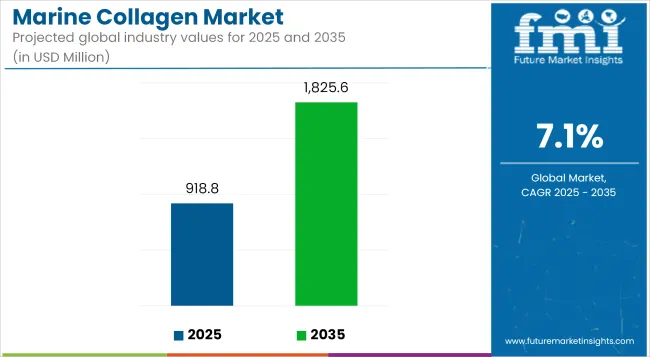
The global marine collagen market, valued at USD 918.8 million in 2025, is set to reach USD 1,825.6 million by 2035, advancing at a 7.1% CAGR. This expansion is being underpinned by broader acceptance of clean-label ingestibles, growing preference for pescatarian protein sources, and active R-and-D into high-purity peptide extraction that improves bioavailability. Key trends in the market include the arrival of animal-free recombinant variants and the upcycling of fishery by-products into premium collagen inputs.
Quick Stats of Marine Collagen Market

  • Market Value (2025): USD 918.8 million
  • Forecast Value (2035): USD 1,825.6 million
  • Forecast CAGR (2025 to 2035): 7.1%
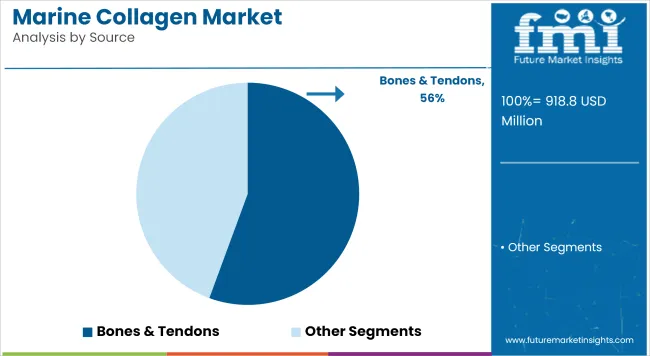
  • Segment Leader by Source (2025): Bones & Tendons (55.9% share)
  • Top Application Segment: Nutraceuticals (expanding rapidly)
  • Key Players: Weishardt Group, Seagarden AS, Vital Proteins LLC, Ashland, Darling Ingredients Inc.

Marine Collagen Market Industry Value Analysis

Attributes Details
Market Size, 2025 USD 918.8 million
Market Size, 2035 USD 1,825.6 million
Value-based CAGR (2025 to 2035) 7.1%

The marine collagen market is poised for sustained expansion through 2035, fueled by advancements in enzymatic hydrolysis, deodorization, and clean-label processing. A rising preference for high-bioavailability proteins among wellness-focused consumers is propelling marine collagen into mainstream formats like ready-to-drink beverages, functional powders, and soft chews.

Key growth has also stemmed from the valorization of fish skin and scales once discarded as waste into high-purity collagen peptides, enabling both environmental impact reduction and margin expansion for processors. Asia Pacific, led by Japan, China, and South Korea, is expected to remain at the forefront of global demand due to the normalization of ingestible skincare and beauty-from-within routines across all age demographics.

In parallel, next-gen applications are emerging that stretch beyond traditional nutraceuticals. Biomedical interest in marine collagen is rising due to its biocompatibility and lower immunogenicity compared to bovine or porcine sources, making it suitable for wound dressings, surgical scaffolds, and tissue engineering.

Recombinant and bioengineered variants are being explored to offer animal-free alternatives with enhanced peptide stability. Meanwhile, increasing regulatory scrutiny is encouraging full traceability in sourcing and refining, pushing brands to adopt blockchain tagging and third-party certification. This convergence of science, sustainability, and personalization is anticipated to define the next wave of market competitiveness.
Analyzing the Marine Collagen Market by Top Investment Segments

Fish-Based Collagen Remains the Top Animal-Derived Segment

Marine Collagen Market Analysis By Animal Type

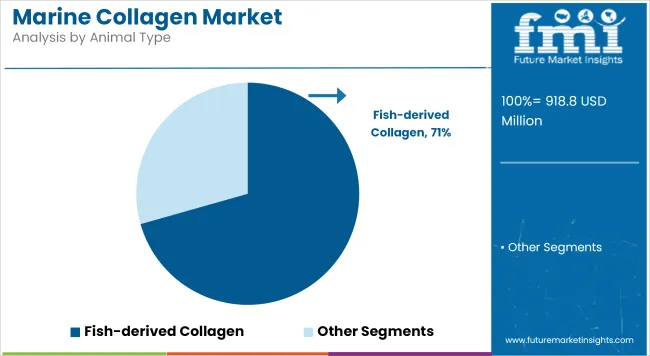
Fish-derived collagen continued to dominate the marine collagen market in 2025, holding a 70.6% value share. Companies like Rousselot, GELITA AG, and Nitta Gelatin Inc. have been instrumental in shaping this segment through innovations in fish collagen peptide formulations. Rousselot’s Peptan® marine collagen is widely used in supplements for joint and skin health, targeting health-conscious consumers across Asia and North America.

GELITA AG focuses on sustainable sourcing and advanced hydrolysis techniques to increase absorption and functionality, ensuring premium-grade fish collagen for cosmetic and pharmaceutical uses. Meanwhile, Nitta Gelatin has leveraged its Japanese heritage in collagen science to create high-purity marine collagen that appeals to clean-label and eco-conscious consumers.

The fish segment’s versatility in applications-including powders, beverages, creams, and capsules-has attracted both wellness brands and cosmeceutical giants. With strong backing from clinical studies and marketing campaigns centered around anti-aging and joint care, fish-based collagen continues to secure strategic investment and product development across global markets.
Bones and Tendons Lead as the Primary Source for Marine Collagen Extraction

Marine Collagen Market Analysis By Source

Bones and tendons maintained their lead as the main source of marine collagen, accounting for 55.9% of the market in 2025. Major players like Weishardt Group, Amicogen Inc., and Vital Proteins (Nestlé Health Science) are actively involved in this segment. Weishardt has expanded its marine collagen portfolio through sustainable extraction from fish bones and tendons, especially in Europe. Its ingredients are widely used in clinical-grade supplements and beauty drinks. South Korea’s Amicogen focuses on enzymatic hydrolysis methods to extract bioactive peptides from fish tendons, supporting applications in medical nutrition and sports recovery.

Vital Proteins, backed by Nestlé, integrates bone- and tendon-sourced collagen into its flagship products, targeting millennials and athletes, reinforcing credibility through influencer campaigns and verified claims. These companies not only emphasize scientific backing but also streamline traceability and sustainability certifications, further boosting consumer trust. As the demand for clinically proven, multi-functional wellness ingredients rises, bones and tendons are projected to remain the primary extraction source for marine collagen.

Key Market Highlights

Emergence of Animal-free Collagen Disrupts the Industry

Due to changing customer demands for sustainable, morally-responsible, and cruelty-free products, the formation of animal-free marine collagen is an important milestone in the marine collagen industry.

As environmental sustainability and animal welfare become more pressing issues, there is more of an urge for ethical substitutes for the conventional marine collagen made from fish. Traditional methods of producing marine collagen frequently entail overfishing, habitat degradation, and marine pollution.

The availability of marine collagen made without using animals expands the prospects for collagen-based goods by drawing in customers who were previously turned off by dietary or ethical restrictions.

Leveraging this trend, leading global cosmetic company L'Oréal debuted its second version of Age Perfect Collagen Royal Anti-Aging Face Cream in December 2023; it was created especially for the discriminating Chinese market.

This innovative release signaled a turning point for L'Oréal Paris skincare as it first included recombinant collagen into its product range, a first for the industry. It also represents a significant step toward the recombinant collagen industry's commercialization.

Emphasis on Clean Label and Transparency Boosting Market Demand

In the current era of increased consumer consciousness and ingredient inspection, the marine collagen industry is exhibiting an apparent shift toward clean label and transparent formulations. Customers are placing a higher value on goods that don't include artificial chemicals, preservatives, or allergies. They also want complete transparency when it comes to the sourcing, production, and quality control procedures.

Prioritizing clean label initiatives and offering complete transparency throughout the product lifecycle can help brands stand out in an increasingly crowded market that is flooded with deceptive claims and greenwashing techniques. It can also help brands gain consumer trust and enhance brand credibility.

Personalization and Customization Trends Gain Traction in the Market

Personalized marine collagen products are becoming increasingly popular as customers look for solutions that are specifically designed to meet their unique demands in terms of wellbeing and health.

Companies are using technological advancements like artificial intelligence and DNA testing to provide tailored formulas and suggestions based on the needs, interests, and genetic profiles of each customer.

This trend encourages brand support and loyalty in the highly competitive market environment by driving customer pleasure and product efficacy in addition to improving consumer engagement.
Marine Collagen Market Trends Analysis

  • Functional foods and beverages that provide health advantages beyond basic diet are growing increasingly popular with consumers.
  • Marine collagen’s potential in connective tissue regeneration, muscle recovery, and joint health is driving its demand in the sports nutrition industry.
  • Global aging populations are creating demand for solutions that treat age-related health issues like loss of muscle mass, diminished skin elasticity, and stiff joints.
  • Through a range of distribution channels, including as e-commerce sites, specialized shops, pharmacies, and health food stores, marine collagen products are becoming more widely available.
  • The development of marine collagen supplements for animals is boosting market growth as owners realize how beneficial marine collagen can be for their pets’ mobility, joints, and general health.

Marine Collagen Market Opportunities Analysis

  • Businesses can explore cutting-edge delivery techniques, including microencapsulation or nanoencapsulation, to improve the bioavailability and effectiveness of marine collagen supplements.
  • Obtaining third-party certifications like MSC or ASC accreditation and investing in sustainable sourcing practices like wild-caught or ethically farmed marine sources can boost brand credibility and appeals to environmentally concerned consumers.
  • Aging populations are causing substantial demographic transformations in emerging countries, especially in Asia and Latin America. Businesses have the opportunity to customize marine collagen goods and marketing tactics to the particular requirements and tastes of geriatric customers in these regions.
  • Scales from fish skin can be used, among other underused or wasted materials, to extract marine collagen. This is because the seafood business produces a lot of marine byproducts.
  • Marine collagen businesses have the potential to develop synergistic formulations with greater health benefits when mixed with other bioactive substances, including antioxidants, vitamins, minerals, and plant extracts.

Country-wise Insights

Marine Collagen Market Cagr Analysis By Country

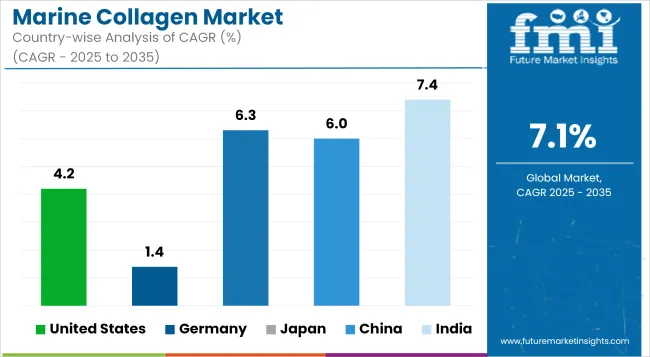
Countries Value-based CAGR (2025 to 2035)
United States 4.2%
Germany 1.4%
Japan 6.3%
China 6.0%
India 7.4%

Rise in Plant-based and Vegan Alternatives Boost Demand in the United States

The demand for marine collagen in the United States is projected to surge at a 4.2% CAGR through 2035. As a result, plant-based collagen substitutes made from fungus or algae present a great opportunity for marine collagen producers to meet the rising demand for vegan-friendly goods and plant-based diets.

For consumers looking for cruelty-free and eco-friendly collagen products, these vegan alternatives provide a morally and environmentally sound choice. Marine collagen companies can boost customer diversity, capitalize on changing dietary habits in the United States, and diversify their product offerings by entering the growing plant-based sector.

Cultural Preference for Natural and Organic Products Amplifies Sales in Germany

The sales of marine collagen in Germany will amplify at a 1.4% CAGR through 2035. Natural and organic items are preferred by German customers who value natural components over artificial ones. Germany's marine collagen industry is growing due to consumer demand for clean-label collagen products derived from premium, organic sources.

German consumers looking for high-end marine collagen goods are drawn to companies that promote organic certification, transparency, and visibility in their sourcing and production procedures. The market is growing because of the societal inclination for natural and organic components, which carves out a niche for high-end collagen products that suit the tastes and values of consumers.

Aging Population and Wellness Concerns Boost Growth in Japan

The marine collagen market growth in Japan is estimated at a 6.3% CAGR through 2035. Japan's population is aging fast, which raises concerns over age-related health problems and staying youthful. The demand for collagen supplements that target bone density, skin elasticity, and joint health is driving growth in the marine collagen industry in Japan.

Businesses can capitalize on this demographic shift and propel market penetration in Japan's lucrative aging population segment by positioning marine collagen as a scientifically validated solution for age-related health problems.

Shift toward Western Beauty Standards Propels Product Demand in China

The demand for marine collagen in China is going to increase at a 6.3% CAGR through 2035. With a focus on youthful, glowing skin and a healthy lifestyle, China's beauty industry is gravitating toward Western beauty standards. China's marine collagen industry continues to flourish as more people look to collagen supplements to address problems associated with aging, maintain youthful skin, and enhance complexion.

Businesses can take advantage of this changing customer demand and propel market expansion in the Chinese beauty industry by positioning marine collagen as a crucial component in skincare and beauty products that are in line with Western beauty standards.

Evolving Beauty and Wellness Trends Influence Sales in India

The sales of marine collagen in India are bound to rise at a 7.4% CAGR through 2035. Indian beauty and wellness industry is expanding quickly because of shifting tastes and lifestyle fads. Customers are looking for new and effective skincare products to cope with aging, damage caused by pollution, and uneven skin tone.

Businesses that create skincare products using marine collagen and target these new beauty trends can gain from the rising demand for high-end skincare brands. Offering marine collagen formulas that are clinically proven to provide noticeable benefits can help companies stand out and get momentum in the Indian beauty and wellness market.

Marine Collagen Industry Players and their Strategies

Product launches, product approvals, and other organic growth techniques, such as patents and events, are being prioritized by a number of companies. Acquisitions and partnerships, as well as collaborations, were identified as two inorganic growth strategies in the market.

Market participants are growing their client base and expanding their operations. With rising global demand for marine collagen, market are expected to benefit from promising growth prospects in the future.

The marine collagen supply chain has been characterised by a clear two-tier structure. Tier 1 comprises globally integrated ingredient producers Darling Ingredients’ Rousselot, Gelita AG, and Nitta Gelatin whose internal networks handle everything from fish-by-product procurement to multi-step hydrolysis and in-house application labs.

Tier 2 is occupied by regional processors and bio-start-ups that specialise in niche formats such as recombinant or flavour-masked peptides, often relying on contract hydrolysis and third-party blending facilities.

Product innovation is being pursued as the primary competitive lever. High-purity peptide cuts, low-odour extraction, and rapid-dispersibility technologies are being prioritised so that collagen can be used in gummies, RTD beverages, and powdered sachets. Batch-level QR traceability is being rolled out, reassuring brand owners about origin, allergen status, and good-manufacturing compliance. Forward-integration into joint-care, sports-recovery, and medical-nutrition channels is expected to accelerate as clinical data packages are strengthened.

Capacity build-out has been observed across Asia and Latin America where fishery by-products are plentiful. Joint ventures with local seafood processors are locking in low-cost feedstock and helping firms bypass cold-chain bottlenecks.

Recombinant, animal-free collagen has been identified as the next disruption, with Tier 2 bio-foundries expected to supply base molecules that Tier 1 companies will refine and commercialise once cost parity is reached.

Recent Marine Collagen Industry Updates

  • In January 2025, Ashland launched collapeptyl, a new biofunctional marine collagen innovation designed for advanced skin and hair health applications. This product leverages marine-sourced ingredients and is supported by ongoing research into bioavailability and efficacy.
  • Gelita continues to invest in marine collagen peptide research and product development. The company remains a key innovator in hydrolyzed marine collagen, focusing on improved bioavailability and expanding its product range for the beauty and nutraceutical sectors.
  • Nitta Gelatin has secured patents for novel collagen extraction technologies and maintains a strong presence in Asia, especially in functional food and dietary supplement markets. The company is actively expanding its marine collagen production capacity to meet growing demand in India and the Middle East.

Key Players in the Marine Collagen Market

  • Ashland Inc.
  • Darling Ingredients Inc. (including Rousselot brand)
  • Weishardt Group
  • Gelita AG
  • Nitta Gelatin Inc.
  • Seagarden AS
  • Vital Proteins LLC
  • Amicogen, Inc.
  • BHN International Co. Ltd.
  • Connoils LLC
  • Italgelatine S.p.A
  • COBIOSA
  • ETChem
  • Hangzhou Nutrition Biotechnology Co., Ltd.
  • HUM Nutrition Inc.
  • Titan Biotech Limited

Key Coverage in the Marine Collagen Market Report

  • Adjacent Study of the Fish Collagen Market, Marine Collagen Powder Market, Collagen Market, Fish Collagen Peptides Market, and the Marine Hydrolyzed Collagen Market.
  • Demand Analysis of Collagen Derived from Fish Industry Waste
  • Revenue Analysis of China Marine Collagen Market
  • Consumption Analysis of Russia Marine Collagen Market

Report Scope Table - Marine Collagen Market

Report Attributes Details
Current Total Market Size (2025) USD 918.8 million
Projected Market Size (2035) USD 1,825.6 million
CAGR (2025 to 2035) 7.1%
Base Year for Estimation 2023
Historical Period 2020 to 2024
Projections Period 2025 to 2035
Quantitative Units USD million for value; Metric tons for volume
Sources Analyzed (Segment 1) Skin, Muscles, Scales, Bones & Tendons
Animal Types Analyzed (Segment 2) Fish, Marine Organisms
Applications Analyzed (Segment 3) Cosmetic, Healthcare, Medical, Nutraceuticals
Regions Covered North America; Latin America; Western Europe; Eastern Europe; South Asia and Pacific; East Asia; Middle East & Africa
Countries Covered United States, Canada, Germany, United Kingdom, France, Japan, China, India, South Korea, Brazil
Key Players Influencing the Market Ashland Inc., Darling Ingredients Inc. (including Rousselot brand), Weishardt Group, Gelita AG, Nitta Gelatin Inc., Seagarden AS, Vital Proteins LLC, Amicogen,  Inc., BHN International Co. Ltd., Connoils LLC, Italgelatine S.p.A, COBIOSA, ETChem, Hangzhou Nutrition Biotechnology Co.,  Ltd., HUM Nutrition Inc., Titan Biotech Limited
Additional Attributes Growing preference for sustainable collagen alternatives, Expansion in beauty and wellness products, Rising clinical use in regenerative medicine
Customization and Pricing Customization and Pricing Available on Request

Market Segmentation

By Source:

  • Skin
  • Muscles
  • Scales
  • Bones & Tendons

By Animal Type:

  • Fish
  • Marine Organisms

By Application:

  • Cosmetic
  • Healthcare
  • Medical
  • Nutraceuticals

By Region:

  • North America
  • Latin America
  • Western Europe
  • Eastern Europe
  • Asia Pacific (APAC)
  • Middle East & Africa (MEA)

Table of Content

  • 1. Executive Summary
  • 2. Market Overview
  • 3. Market Background
  • 4. Global Market Analysis 2020 to 2024 and Forecast, 2025 to 2035
  • 5. Global Market Analysis 2020 to 2024 and Forecast 2025 to 2035, By Source
    • 5.1. Skin
    • 5.2. Muscles
    • 5.3. Scales
    • 5.4. Bones & Tendons
  • 6. Global Market Analysis 2020 to 2024 and Forecast 2025 to 2035, By Animal Type
    • 6.1. Fish
    • 6.2. Marine Organisms
  • 7. Global Market Analysis 2020 to 2024 and Forecast 2025 to 2035, By Application
    • 7.1. Cosmetic
    • 7.2. Healthcare
    • 7.3. Medical
    • 7.4. Nutraceuticals
  • 8. Global Market Analysis 2020 to 2024 and Forecast 2025 to 2035, By Region
    • 8.1. North America
    • 8.2. Latin America
    • 8.3. Western Europe
    • 8.4. Eastern Europe
    • 8.5. South Asia and Pacific
    • 8.6. East Asia
    • 8.7. Middle East and Africa
  • 9. North America Market Analysis 2020 to 2024 and Forecast 2025 to 2035, By Country
  • 10. Latin America Market Analysis 2020 to 2024 and Forecast 2025 to 2035, By Country
  • 11. Western Europe Market Analysis 2020 to 2024 and Forecast 2025 to 2035, By Country
  • 12. Eastern Europe Market Analysis 2020 to 2024 and Forecast 2025 to 2035, By Country
  • 13. South Asia and Pacific Market Analysis 2020 to 2024 and Forecast 2025 to 2035, By Country
  • 14. East Asia Market Analysis 2020 to 2024 and Forecast 2025 to 2035, By Country
  • 15. Middle East and Africa Market Analysis 2020 to 2024 and Forecast 2025 to 2035, By Country
  • 16. Key Countries Market Analysis
  • 17. Market Structure Analysis
  • 18. Competition Analysis
    • 18.1. Ashland Inc.
    • 18.2. Darling Ingredients Inc. (including Rousselot brand)
    • 18.3. Weishardt Group
    • 18.4. Gelita AG
    • 18.5. Nitta Gelatin Inc.
    • 18.6. Seagarden AS
    • 18.7. Vital Proteins LLC
    • 18.8. Amicogen, Inc.
    • 18.9. Weishardt Group
    • 18.10. BHN International Co. Ltd.
  • 19. Assumptions & Acronyms Used
  • 20. Research Methodology

List of Tables

  • Table 1: Global Market Value (USD Million) Forecast by Region, 2020 to 2035
  • Table 2: Global Market Volume (Tons) Forecast by Region, 2020 to 2035
  • Table 3: Global Market Value (USD Million) Forecast by Source, 2020 to 2035
  • Table 4: Global Market Volume (Tons) Forecast by Source, 2020 to 2035
  • Table 5: Global Market Value (USD Million) Forecast by Animal Type, 2020 to 2035
  • Table 6: Global Market Volume (Tons) Forecast by Animal Type, 2020 to 2035
  • Table 7: Global Market Value (USD Million) Forecast by Application, 2020 to 2035
  • Table 8: Global Market Volume (Tons) Forecast by Application, 2020 to 2035
  • Table 9: North America Market Value (USD Million) Forecast by Country, 2020 to 2035
  • Table 10: North America Market Volume (Tons) Forecast by Country, 2020 to 2035
  • Table 11: North America Market Value (USD Million) Forecast by Source, 2020 to 2035
  • Table 12: North America Market Volume (Tons) Forecast by Source, 2020 to 2035
  • Table 13: North America Market Value (USD Million) Forecast by Animal Type, 2020 to 2035
  • Table 14: North America Market Volume (Tons) Forecast by Animal Type, 2020 to 2035
  • Table 15: North America Market Value (USD Million) Forecast by Application, 2020 to 2035
  • Table 16: North America Market Volume (Tons) Forecast by Application, 2020 to 2035
  • Table 17: Latin America Market Value (USD Million) Forecast by Country, 2020 to 2035
  • Table 18: Latin America Market Volume (Tons) Forecast by Country, 2020 to 2035
  • Table 19: Latin America Market Value (USD Million) Forecast by Source, 2020 to 2035
  • Table 20: Latin America Market Volume (Tons) Forecast by Source, 2020 to 2035
  • Table 21: Latin America Market Value (USD Million) Forecast by Animal Type, 2020 to 2035
  • Table 22: Latin America Market Volume (Tons) Forecast by Animal Type, 2020 to 2035
  • Table 23: Latin America Market Value (USD Million) Forecast by Application, 2020 to 2035
  • Table 24: Latin America Market Volume (Tons) Forecast by Application, 2020 to 2035
  • Table 25: Western Europe Market Value (USD Million) Forecast by Country, 2020 to 2035
  • Table 26: Western Europe Market Volume (Tons) Forecast by Country, 2020 to 2035
  • Table 27: Western Europe Market Value (USD Million) Forecast by Source, 2020 to 2035
  • Table 28: Western Europe Market Volume (Tons) Forecast by Source, 2020 to 2035
  • Table 29: Western Europe Market Value (USD Million) Forecast by Animal Type, 2020 to 2035
  • Table 30: Western Europe Market Volume (Tons) Forecast by Animal Type, 2020 to 2035
  • Table 31: Western Europe Market Value (USD Million) Forecast by Application, 2020 to 2035
  • Table 32: Western Europe Market Volume (Tons) Forecast by Application, 2020 to 2035
  • Table 33: Eastern Europe Market Value (USD Million) Forecast by Country, 2020 to 2035
  • Table 34: Eastern Europe Market Volume (Tons) Forecast by Country, 2020 to 2035
  • Table 35: Eastern Europe Market Value (USD Million) Forecast by Source, 2020 to 2035
  • Table 36: Eastern Europe Market Volume (Tons) Forecast by Source, 2020 to 2035
  • Table 37: Eastern Europe Market Value (USD Million) Forecast by Animal Type, 2020 to 2035
  • Table 38: Eastern Europe Market Volume (Tons) Forecast by Animal Type, 2020 to 2035
  • Table 39: Eastern Europe Market Value (USD Million) Forecast by Application, 2020 to 2035
  • Table 40: Eastern Europe Market Volume (Tons) Forecast by Application, 2020 to 2035
  • Table 41: South Asia and Pacific Market Value (USD Million) Forecast by Country, 2020 to 2035
  • Table 42: South Asia and Pacific Market Volume (Tons) Forecast by Country, 2020 to 2035
  • Table 43: South Asia and Pacific Market Value (USD Million) Forecast by Source, 2020 to 2035
  • Table 44: South Asia and Pacific Market Volume (Tons) Forecast by Source, 2020 to 2035
  • Table 45: South Asia and Pacific Market Value (USD Million) Forecast by Animal Type, 2020 to 2035
  • Table 46: South Asia and Pacific Market Volume (Tons) Forecast by Animal Type, 2020 to 2035
  • Table 47: South Asia and Pacific Market Value (USD Million) Forecast by Application, 2020 to 2035
  • Table 48: South Asia and Pacific Market Volume (Tons) Forecast by Application, 2020 to 2035
  • Table 49: East Asia Market Value (USD Million) Forecast by Country, 2020 to 2035
  • Table 50: East Asia Market Volume (Tons) Forecast by Country, 2020 to 2035
  • Table 51: East Asia Market Value (USD Million) Forecast by Source, 2020 to 2035
  • Table 52: East Asia Market Volume (Tons) Forecast by Source, 2020 to 2035
  • Table 53: East Asia Market Value (USD Million) Forecast by Animal Type, 2020 to 2035
  • Table 54: East Asia Market Volume (Tons) Forecast by Animal Type, 2020 to 2035
  • Table 55: East Asia Market Value (USD Million) Forecast by Application, 2020 to 2035
  • Table 56: East Asia Market Volume (Tons) Forecast by Application, 2020 to 2035
  • Table 57: Middle East and Africa Market Value (USD Million) Forecast by Country, 2020 to 2035
  • Table 58: Middle East and Africa Market Volume (Tons) Forecast by Country, 2020 to 2035
  • Table 59: Middle East and Africa Market Value (USD Million) Forecast by Source, 2020 to 2035
  • Table 60: Middle East and Africa Market Volume (Tons) Forecast by Source, 2020 to 2035
  • Table 61: Middle East and Africa Market Value (USD Million) Forecast by Animal Type, 2020 to 2035
  • Table 62: Middle East and Africa Market Volume (Tons) Forecast by Animal Type, 2020 to 2035
  • Table 63: Middle East and Africa Market Value (USD Million) Forecast by Application, 2020 to 2035
  • Table 64: Middle East and Africa Market Volume (Tons) Forecast by Application, 2020 to 2035

List of Figures

  • Figure 1: Global Market Value (USD Million) by Source, 2025 to 2035
  • Figure 2: Global Market Value (USD Million) by Animal Type, 2025 to 2035
  • Figure 3: Global Market Value (USD Million) by Application, 2025 to 2035
  • Figure 4: Global Market Value (USD Million) by Region, 2025 to 2035
  • Figure 5: Global Market Value (USD Million) Analysis by Region, 2020 to 2035
  • Figure 6: Global Market Volume (Tons) Analysis by Region, 2020 to 2035
  • Figure 7: Global Market Value Share (%) and BPS Analysis by Region, 2025 to 2035
  • Figure 8: Global Market Y-o-Y Growth (%) Projections by Region, 2025 to 2035
  • Figure 9: Global Market Value (USD Million) Analysis by Source, 2020 to 2035
  • Figure 10: Global Market Volume (Tons) Analysis by Source, 2020 to 2035
  • Figure 11: Global Market Value Share (%) and BPS Analysis by Source, 2025 to 2035
  • Figure 12: Global Market Y-o-Y Growth (%) Projections by Source, 2025 to 2035
  • Figure 13: Global Market Value (USD Million) Analysis by Animal Type, 2020 to 2035
  • Figure 14: Global Market Volume (Tons) Analysis by Animal Type, 2020 to 2035
  • Figure 15: Global Market Value Share (%) and BPS Analysis by Animal Type, 2025 to 2035
  • Figure 16: Global Market Y-o-Y Growth (%) Projections by Animal Type, 2025 to 2035
  • Figure 17: Global Market Value (USD Million) Analysis by Application, 2020 to 2035
  • Figure 18: Global Market Volume (Tons) Analysis by Application, 2020 to 2035
  • Figure 19: Global Market Value Share (%) and BPS Analysis by Application, 2025 to 2035
  • Figure 20: Global Market Y-o-Y Growth (%) Projections by Application, 2025 to 2035
  • Figure 21: Global Market Attractiveness by Source, 2025 to 2035
  • Figure 22: Global Market Attractiveness by Animal Type, 2025 to 2035
  • Figure 23: Global Market Attractiveness by Application, 2025 to 2035
  • Figure 24: Global Market Attractiveness by Region, 2025 to 2035
  • Figure 25: North America Market Value (USD Million) by Source, 2025 to 2035
  • Figure 26: North America Market Value (USD Million) by Animal Type, 2025 to 2035
  • Figure 27: North America Market Value (USD Million) by Application, 2025 to 2035
  • Figure 28: North America Market Value (USD Million) by Country, 2025 to 2035
  • Figure 29: North America Market Value (USD Million) Analysis by Country, 2020 to 2035
  • Figure 30: North America Market Volume (Tons) Analysis by Country, 2020 to 2035
  • Figure 31: North America Market Value Share (%) and BPS Analysis by Country, 2025 to 2035
  • Figure 32: North America Market Y-o-Y Growth (%) Projections by Country, 2025 to 2035
  • Figure 33: North America Market Value (USD Million) Analysis by Source, 2020 to 2035
  • Figure 34: North America Market Volume (Tons) Analysis by Source, 2020 to 2035
  • Figure 35: North America Market Value Share (%) and BPS Analysis by Source, 2025 to 2035
  • Figure 36: North America Market Y-o-Y Growth (%) Projections by Source, 2025 to 2035
  • Figure 37: North America Market Value (USD Million) Analysis by Animal Type, 2020 to 2035
  • Figure 38: North America Market Volume (Tons) Analysis by Animal Type, 2020 to 2035
  • Figure 39: North America Market Value Share (%) and BPS Analysis by Animal Type, 2025 to 2035
  • Figure 40: North America Market Y-o-Y Growth (%) Projections by Animal Type, 2025 to 2035
  • Figure 41: North America Market Value (USD Million) Analysis by Application, 2020 to 2035
  • Figure 42: North America Market Volume (Tons) Analysis by Application, 2020 to 2035
  • Figure 43: North America Market Value Share (%) and BPS Analysis by Application, 2025 to 2035
  • Figure 44: North America Market Y-o-Y Growth (%) Projections by Application, 2025 to 2035
  • Figure 45: North America Market Attractiveness by Source, 2025 to 2035
  • Figure 46: North America Market Attractiveness by Animal Type, 2025 to 2035
  • Figure 47: North America Market Attractiveness by Application, 2025 to 2035
  • Figure 48: North America Market Attractiveness by Country, 2025 to 2035
  • Figure 49: Latin America Market Value (USD Million) by Source, 2025 to 2035
  • Figure 50: Latin America Market Value (USD Million) by Animal Type, 2025 to 2035
  • Figure 51: Latin America Market Value (USD Million) by Application, 2025 to 2035
  • Figure 52: Latin America Market Value (USD Million) by Country, 2025 to 2035
  • Figure 53: Latin America Market Value (USD Million) Analysis by Country, 2020 to 2035
  • Figure 54: Latin America Market Volume (Tons) Analysis by Country, 2020 to 2035
  • Figure 55: Latin America Market Value Share (%) and BPS Analysis by Country, 2025 to 2035
  • Figure 56: Latin America Market Y-o-Y Growth (%) Projections by Country, 2025 to 2035
  • Figure 57: Latin America Market Value (USD Million) Analysis by Source, 2020 to 2035
  • Figure 58: Latin America Market Volume (Tons) Analysis by Source, 2020 to 2035
  • Figure 59: Latin America Market Value Share (%) and BPS Analysis by Source, 2025 to 2035
  • Figure 60: Latin America Market Y-o-Y Growth (%) Projections by Source, 2025 to 2035
  • Figure 61: Latin America Market Value (USD Million) Analysis by Animal Type, 2020 to 2035
  • Figure 62: Latin America Market Volume (Tons) Analysis by Animal Type, 2020 to 2035
  • Figure 63: Latin America Market Value Share (%) and BPS Analysis by Animal Type, 2025 to 2035
  • Figure 64: Latin America Market Y-o-Y Growth (%) Projections by Animal Type, 2025 to 2035
  • Figure 65: Latin America Market Value (USD Million) Analysis by Application, 2020 to 2035
  • Figure 66: Latin America Market Volume (Tons) Analysis by Application, 2020 to 2035
  • Figure 67: Latin America Market Value Share (%) and BPS Analysis by Application, 2025 to 2035
  • Figure 68: Latin America Market Y-o-Y Growth (%) Projections by Application, 2025 to 2035
  • Figure 69: Latin America Market Attractiveness by Source, 2025 to 2035
  • Figure 70: Latin America Market Attractiveness by Animal Type, 2025 to 2035
  • Figure 71: Latin America Market Attractiveness by Application, 2025 to 2035
  • Figure 72: Latin America Market Attractiveness by Country, 2025 to 2035
  • Figure 73: Western Europe Market Value (USD Million) by Source, 2025 to 2035
  • Figure 74: Western Europe Market Value (USD Million) by Animal Type, 2025 to 2035
  • Figure 75: Western Europe Market Value (USD Million) by Application, 2025 to 2035
  • Figure 76: Western Europe Market Value (USD Million) by Country, 2025 to 2035
  • Figure 77: Western Europe Market Value (USD Million) Analysis by Country, 2020 to 2035
  • Figure 78: Western Europe Market Volume (Tons) Analysis by Country, 2020 to 2035
  • Figure 79: Western Europe Market Value Share (%) and BPS Analysis by Country, 2025 to 2035
  • Figure 80: Western Europe Market Y-o-Y Growth (%) Projections by Country, 2025 to 2035
  • Figure 81: Western Europe Market Value (USD Million) Analysis by Source, 2020 to 2035
  • Figure 82: Western Europe Market Volume (Tons) Analysis by Source, 2020 to 2035
  • Figure 83: Western Europe Market Value Share (%) and BPS Analysis by Source, 2025 to 2035
  • Figure 84: Western Europe Market Y-o-Y Growth (%) Projections by Source, 2025 to 2035
  • Figure 85: Western Europe Market Value (USD Million) Analysis by Animal Type, 2020 to 2035
  • Figure 86: Western Europe Market Volume (Tons) Analysis by Animal Type, 2020 to 2035
  • Figure 87: Western Europe Market Value Share (%) and BPS Analysis by Animal Type, 2025 to 2035
  • Figure 88: Western Europe Market Y-o-Y Growth (%) Projections by Animal Type, 2025 to 2035
  • Figure 89: Western Europe Market Value (USD Million) Analysis by Application, 2020 to 2035
  • Figure 90: Western Europe Market Volume (Tons) Analysis by Application, 2020 to 2035
  • Figure 91: Western Europe Market Value Share (%) and BPS Analysis by Application, 2025 to 2035
  • Figure 92: Western Europe Market Y-o-Y Growth (%) Projections by Application, 2025 to 2035
  • Figure 93: Western Europe Market Attractiveness by Source, 2025 to 2035
  • Figure 94: Western Europe Market Attractiveness by Animal Type, 2025 to 2035
  • Figure 95: Western Europe Market Attractiveness by Application, 2025 to 2035
  • Figure 96: Western Europe Market Attractiveness by Country, 2025 to 2035
  • Figure 97: Eastern Europe Market Value (USD Million) by Source, 2025 to 2035
  • Figure 98: Eastern Europe Market Value (USD Million) by Animal Type, 2025 to 2035
  • Figure 99: Eastern Europe Market Value (USD Million) by Application, 2025 to 2035
  • Figure 100: Eastern Europe Market Value (USD Million) by Country, 2025 to 2035
  • Figure 101: Eastern Europe Market Value (USD Million) Analysis by Country, 2020 to 2035
  • Figure 102: Eastern Europe Market Volume (Tons) Analysis by Country, 2020 to 2035
  • Figure 103: Eastern Europe Market Value Share (%) and BPS Analysis by Country, 2025 to 2035
  • Figure 104: Eastern Europe Market Y-o-Y Growth (%) Projections by Country, 2025 to 2035
  • Figure 105: Eastern Europe Market Value (USD Million) Analysis by Source, 2020 to 2035
  • Figure 106: Eastern Europe Market Volume (Tons) Analysis by Source, 2020 to 2035
  • Figure 107: Eastern Europe Market Value Share (%) and BPS Analysis by Source, 2025 to 2035
  • Figure 108: Eastern Europe Market Y-o-Y Growth (%) Projections by Source, 2025 to 2035
  • Figure 109: Eastern Europe Market Value (USD Million) Analysis by Animal Type, 2020 to 2035
  • Figure 110: Eastern Europe Market Volume (Tons) Analysis by Animal Type, 2020 to 2035
  • Figure 111: Eastern Europe Market Value Share (%) and BPS Analysis by Animal Type, 2025 to 2035
  • Figure 112: Eastern Europe Market Y-o-Y Growth (%) Projections by Animal Type, 2025 to 2035
  • Figure 113: Eastern Europe Market Value (USD Million) Analysis by Application, 2020 to 2035
  • Figure 114: Eastern Europe Market Volume (Tons) Analysis by Application, 2020 to 2035
  • Figure 115: Eastern Europe Market Value Share (%) and BPS Analysis by Application, 2025 to 2035
  • Figure 116: Eastern Europe Market Y-o-Y Growth (%) Projections by Application, 2025 to 2035
  • Figure 117: Eastern Europe Market Attractiveness by Source, 2025 to 2035
  • Figure 118: Eastern Europe Market Attractiveness by Animal Type, 2025 to 2035
  • Figure 119: Eastern Europe Market Attractiveness by Application, 2025 to 2035
  • Figure 120: Eastern Europe Market Attractiveness by Country, 2025 to 2035
  • Figure 121: South Asia and Pacific Market Value (USD Million) by Source, 2025 to 2035
  • Figure 122: South Asia and Pacific Market Value (USD Million) by Animal Type, 2025 to 2035
  • Figure 123: South Asia and Pacific Market Value (USD Million) by Application, 2025 to 2035
  • Figure 124: South Asia and Pacific Market Value (USD Million) by Country, 2025 to 2035
  • Figure 125: South Asia and Pacific Market Value (USD Million) Analysis by Country, 2020 to 2035
  • Figure 126: South Asia and Pacific Market Volume (Tons) Analysis by Country, 2020 to 2035
  • Figure 127: South Asia and Pacific Market Value Share (%) and BPS Analysis by Country, 2025 to 2035
  • Figure 128: South Asia and Pacific Market Y-o-Y Growth (%) Projections by Country, 2025 to 2035
  • Figure 129: South Asia and Pacific Market Value (USD Million) Analysis by Source, 2020 to 2035
  • Figure 130: South Asia and Pacific Market Volume (Tons) Analysis by Source, 2020 to 2035
  • Figure 131: South Asia and Pacific Market Value Share (%) and BPS Analysis by Source, 2025 to 2035
  • Figure 132: South Asia and Pacific Market Y-o-Y Growth (%) Projections by Source, 2025 to 2035
  • Figure 133: South Asia and Pacific Market Value (USD Million) Analysis by Animal Type, 2020 to 2035
  • Figure 134: South Asia and Pacific Market Volume (Tons) Analysis by Animal Type, 2020 to 2035
  • Figure 135: South Asia and Pacific Market Value Share (%) and BPS Analysis by Animal Type, 2025 to 2035
  • Figure 136: South Asia and Pacific Market Y-o-Y Growth (%) Projections by Animal Type, 2025 to 2035
  • Figure 137: South Asia and Pacific Market Value (USD Million) Analysis by Application, 2020 to 2035
  • Figure 138: South Asia and Pacific Market Volume (Tons) Analysis by Application, 2020 to 2035
  • Figure 139: South Asia and Pacific Market Value Share (%) and BPS Analysis by Application, 2025 to 2035
  • Figure 140: South Asia and Pacific Market Y-o-Y Growth (%) Projections by Application, 2025 to 2035
  • Figure 141: South Asia and Pacific Market Attractiveness by Source, 2025 to 2035
  • Figure 142: South Asia and Pacific Market Attractiveness by Animal Type, 2025 to 2035
  • Figure 143: South Asia and Pacific Market Attractiveness by Application, 2025 to 2035
  • Figure 144: South Asia and Pacific Market Attractiveness by Country, 2025 to 2035
  • Figure 145: East Asia Market Value (USD Million) by Source, 2025 to 2035
  • Figure 146: East Asia Market Value (USD Million) by Animal Type, 2025 to 2035
  • Figure 147: East Asia Market Value (USD Million) by Application, 2025 to 2035
  • Figure 148: East Asia Market Value (USD Million) by Country, 2025 to 2035
  • Figure 149: East Asia Market Value (USD Million) Analysis by Country, 2020 to 2035
  • Figure 150: East Asia Market Volume (Tons) Analysis by Country, 2020 to 2035
  • Figure 151: East Asia Market Value Share (%) and BPS Analysis by Country, 2025 to 2035
  • Figure 152: East Asia Market Y-o-Y Growth (%) Projections by Country, 2025 to 2035
  • Figure 153: East Asia Market Value (USD Million) Analysis by Source, 2020 to 2035
  • Figure 154: East Asia Market Volume (Tons) Analysis by Source, 2020 to 2035
  • Figure 155: East Asia Market Value Share (%) and BPS Analysis by Source, 2025 to 2035
  • Figure 156: East Asia Market Y-o-Y Growth (%) Projections by Source, 2025 to 2035
  • Figure 157: East Asia Market Value (USD Million) Analysis by Animal Type, 2020 to 2035
  • Figure 158: East Asia Market Volume (Tons) Analysis by Animal Type, 2020 to 2035
  • Figure 159: East Asia Market Value Share (%) and BPS Analysis by Animal Type, 2025 to 2035
  • Figure 160: East Asia Market Y-o-Y Growth (%) Projections by Animal Type, 2025 to 2035
  • Figure 161: East Asia Market Value (USD Million) Analysis by Application, 2020 to 2035
  • Figure 162: East Asia Market Volume (Tons) Analysis by Application, 2020 to 2035
  • Figure 163: East Asia Market Value Share (%) and BPS Analysis by Application, 2025 to 2035
  • Figure 164: East Asia Market Y-o-Y Growth (%) Projections by Application, 2025 to 2035
  • Figure 165: East Asia Market Attractiveness by Source, 2025 to 2035
  • Figure 166: East Asia Market Attractiveness by Animal Type, 2025 to 2035
  • Figure 167: East Asia Market Attractiveness by Application, 2025 to 2035
  • Figure 168: East Asia Market Attractiveness by Country, 2025 to 2035
  • Figure 169: Middle East and Africa Market Value (USD Million) by Source, 2025 to 2035
  • Figure 170: Middle East and Africa Market Value (USD Million) by Animal Type, 2025 to 2035
  • Figure 171: Middle East and Africa Market Value (USD Million) by Application, 2025 to 2035
  • Figure 172: Middle East and Africa Market Value (USD Million) by Country, 2025 to 2035
  • Figure 173: Middle East and Africa Market Value (USD Million) Analysis by Country, 2020 to 2035
  • Figure 174: Middle East and Africa Market Volume (Tons) Analysis by Country, 2020 to 2035
  • Figure 175: Middle East and Africa Market Value Share (%) and BPS Analysis by Country, 2025 to 2035
  • Figure 176: Middle East and Africa Market Y-o-Y Growth (%) Projections by Country, 2025 to 2035
  • Figure 177: Middle East and Africa Market Value (USD Million) Analysis by Source, 2020 to 2035
  • Figure 178: Middle East and Africa Market Volume (Tons) Analysis by Source, 2020 to 2035
  • Figure 179: Middle East and Africa Market Value Share (%) and BPS Analysis by Source, 2025 to 2035
  • Figure 180: Middle East and Africa Market Y-o-Y Growth (%) Projections by Source, 2025 to 2035
  • Figure 181: Middle East and Africa Market Value (USD Million) Analysis by Animal Type, 2020 to 2035
  • Figure 182: Middle East and Africa Market Volume (Tons) Analysis by Animal Type, 2020 to 2035
  • Figure 183: Middle East and Africa Market Value Share (%) and BPS Analysis by Animal Type, 2025 to 2035
  • Figure 184: Middle East and Africa Market Y-o-Y Growth (%) Projections by Animal Type, 2025 to 2035
  • Figure 185: Middle East and Africa Market Value (USD Million) Analysis by Application, 2020 to 2035
  • Figure 186: Middle East and Africa Market Volume (Tons) Analysis by Application, 2020 to 2035
  • Figure 187: Middle East and Africa Market Value Share (%) and BPS Analysis by Application, 2025 to 2035
  • Figure 188: Middle East and Africa Market Y-o-Y Growth (%) Projections by Application, 2025 to 2035
  • Figure 189: Middle East and Africa Market Attractiveness by Source, 2025 to 2035
  • Figure 190: Middle East and Africa Market Attractiveness by Animal Type, 2025 to 2035
  • Figure 191: Middle East and Africa Market Attractiveness by Application, 2025 to 2035
  • Figure 192: Middle East and Africa Market Attractiveness by Country, 2025 to 2035

Frequently Asked Questions

What is Marine Collagen Market Worth in 2025?

The marine collagen market is valued at USD 918.8 million in 2025.

What is the Projected CAGR of the Marine Collagen Market?

The marine collagen market size is estimated to increase at a 7.1% CAGR through 2035.

What is the Future Stance for the Marine Collagen Market?

The marine collagen market is expected to be worth USD 1,825.6 million by 2035.

Which is the Preferred Source of Marine Collagen?

Bones and tendons are highly preferred in the market.

Which Country is Rising at a Higher CAGR in the Marine Collagen Market?

The Indian marine collagen market is predicted to expand at a 7.4% CAGR through 2035.

Explore Similar Insights

Future Market Insights

Marine Collagen Market