Marine Radar Market Outlook and Forecast 2025 to 2035

The global marine radar market is valued at USD 1.57 billion in 2025 and is slated to be worth USD 2.56 billion by 2035, which shows a CAGR of 5% over the forecast period. This growth is projected to be driven by increasing demand for advanced navigation systems, rising maritime security concerns, and the expansion of global shipping activities. Furthermore, contributions to market expansion are expected to be made by advancements in AI-powered radar technologies and increasing investments in autonomous vessels over the forecast period.

Marine Radar Market Quick Stats

  • Market Value (2025): USD 1.57 billion
  • Forecast Value (2035): USD 2.56 billion
  • Forecast CAGR: 5%
  • Type Leader in 2025: X-Band Radar (47% share)
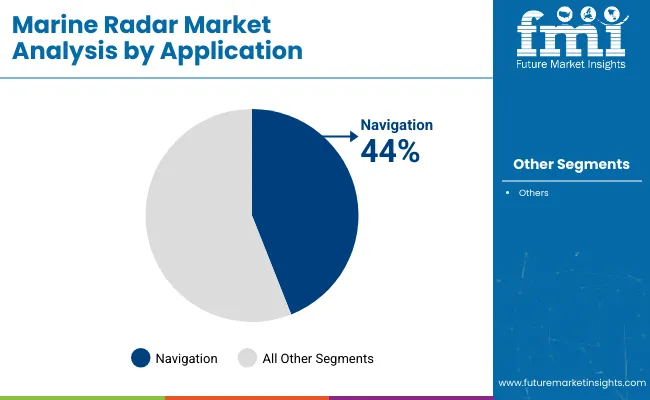
  • Top Application Segment: Navigation (44% share)
  • Key Growth Region: East Asia (Japan is the fastest-growing market with 5.3% CAGR)

Marine Radar Market

Metric Value
2025 Market Size USD 1.57 billion
2035 Market Size USD 2.56 billion
CAGR (2025 to 2035) 5%

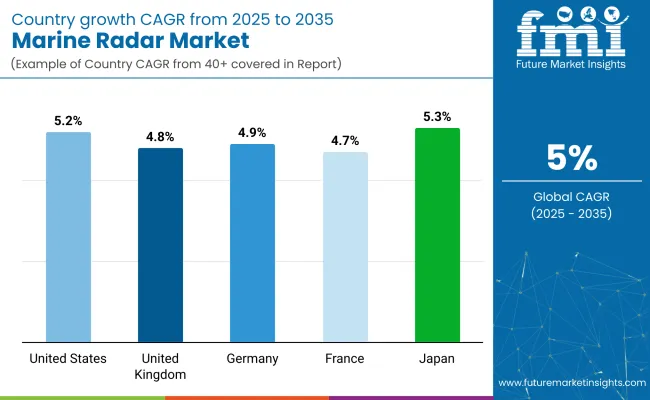
Japan is expected to be the fastest-growing country, with a projected CAGR of 5.3% from 2025 to 2035. X-Band radar will dominate the type segment, capturing a 47% market share in 2025. Navigation applications are anticipated to lead with a 44% share, driven by rising demand for precise route tracking. Commercial vessels will account for 40% of total end use. The USA and Germany are also projected to grow steadily, with CAGRs of 5.2% and 4.9%, respectively.

Marine radar technology has undergone significant innovation in recent years, enhancing safety, navigation, and situational awareness at sea. One of the most transformative advances is the adoption of solid-state radar systems, such as those using CHIRP (Compressed High-Intensity Radiated Pulse) and Doppler processing.

These systems offer superior target resolution and range discrimination compared to traditional magnetron-based radars. CHIRP technology, in particular, enables radars to distinguish between small targets like buoys or kayaks and large vessels, even in cluttered environments or poor weather.

Another key innovation is the integration of automatic target tracking (ARPA) with AIS (Automatic Identification System) data. This fusion provides dynamic, real-time information on the movement, speed, and identity of nearby vessels, improving decision-making and reducing collision risk. Modern systems also incorporate doppler-based color-coding to indicate whether objects are approaching or receding, which enhances threat assessment.

Marine Radar Market Analysis by Top Investment Segments

The market is segmented into type, component, application, end use, and region. By type, the market is divided into X-band radar, S-band radar, and others (K-band and C-band radars). Based on component, the market is categorized into transmitters, antennas, receivers, displays, and processors. In terms of application, the market is segmented into navigation, collision avoidance, and surveillance & security.

By end use, the market is divided into commercial vessels, fishing vessels, naval & defense, recreational boats, and offshore oil & gas. Regionally, the market is classified into North America, Latin America, Western Europe, South Asia, East Asia, Eastern Europe, and the Middle East & Africa.
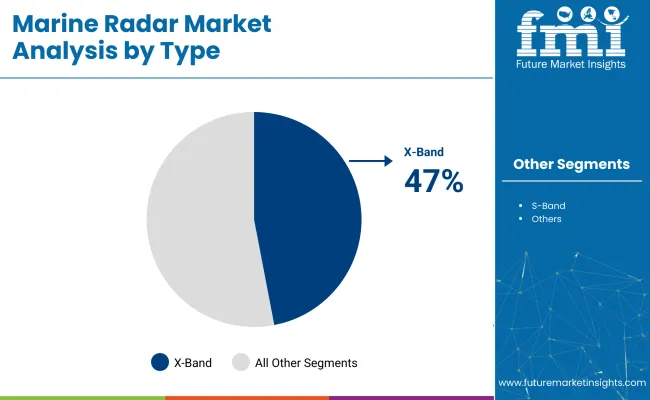
X-Band Radars Lead the Type Segment with 47% Market Share

X-Band radars are projected to lead the product type segment with a 47% share in 2025.Their prominence is being driven by high-resolution imaging, compact design, and suitability for short-range maritime navigation.
  • X-Band radars are widely preferred for their compact size, high-resolution imaging, and efficient performance in short-range navigation and collision avoidance. These radars operate in the 8-12 GHz frequency range, making them ideal for detecting small objects such as buoys and nearby vessels.
  • Their affordability and accuracy have made them indispensable for commercial and fishing vessels operating in dense or congested maritime zones. As global shipping routes expand and regulatory safety standards tighten, the demand for X-Band radars continues to rise.

Marine Radar Market Analysis By Type

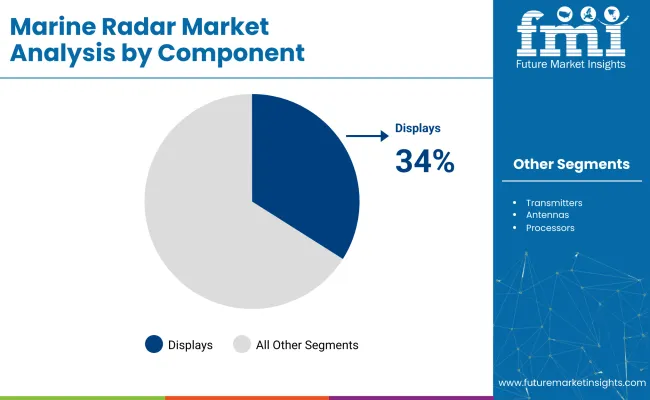
Displays Lead the Component Segment with 34% Market Share

Displays are expected to lead the component segment with a 34% share in 2025. This dominance is anticipated to be driven by the rising adoption of integrated, high-definition radar interfaces across commercial and defense marine vessels.
  • Displays serve as the central interface for radar data visualization, allowing operators to interpret real-time marine conditions and make timely navigational decisions.
  • Modern marine radar systems are being equipped with high-definition screens that integrate radar with ARPA, ECDIS, and GPS systems for maximum operational clarity.
  • The increasing preference for touchscreen and multifunction displays is driving this segment forward.
  • Companies like Raymarine and Japan Radio Co., Ltd. are investing heavily in advanced display technology, ensuring clear visibility and integrated functionality even under challenging weather conditions.

Marine Radar Market Analysis By Component

Navigation Leads the Application Segment with 44% Market Share

Navigation is set to lead the application segment, holding an estimated 44% share by 2025.This prominence is driven by its critical role in ensuring safe vessel movement and route optimization across global waters.

Marine Radar Market Analysis By Application

  • Navigation has remained the core application for marine radar systems, especially for commercial and defense vessels requiring reliable route tracking and collision prevention.
  • The push toward autonomous vessels and regulatory requirements for radar-based navigation systems have positioned this segment as the most critical and lucrative application area in the marine radar market.

Commercial Vessels Lead the End Use Segment with 40% Market Share

Commercial vessels are projected to capture 40% of the marine radar market by end use in 2025.
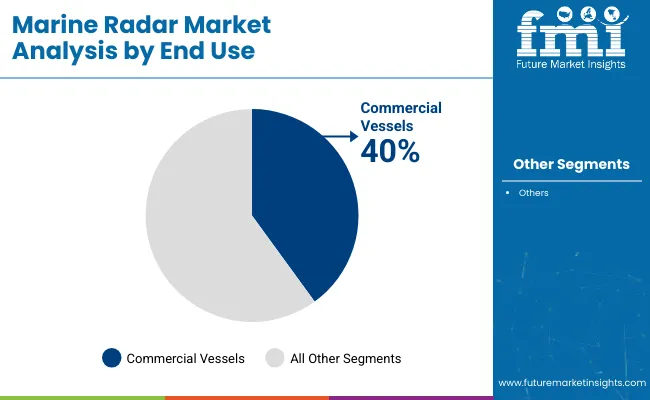
Marine Radar Market Analysis By End Use

  • These include cargo ships, oil tankers, and bulk carriers, which depend extensively on radar systems for secure navigation across congested international trade routes.
  • Radar systems are mandated on commercial vessels by the International Maritime Organization (IMO), boosting segment demand.
  • Radar technology upgrades are being pursued by global shipping companies to reduce risk, enable automation, and enhance performance.
  • Advanced radar solutions are being supplied by players such as Northrop Grumman and JRC to meet these operational demands.

Top Marine Radar Market Dynamics

The market is being driven by advancements in navigation technology, rising demand for maritime safety, and global shipping growth. However, growth is being constrained by high installation costs, compliance burdens, and cybersecurity risks associated with radar-linked systems.

Recent Trends in the Marine Radar Market

  • AI-powered radar systems are being adopted for automated tracking and route prediction.
  • The emergence of autonomous vessels is increasing the demand for intelligent radar integration.
  • Solid-state and Doppler radar technologies are being preferred for higher resolution and energy efficiency.

Challenges in the Marine Radar Market

  • High acquisition and integration costs are limiting adoption among smaller fleet operators.
  • Evolving IMO regulations are increasing the technical and financial burden on manufacturers.
  • Cybersecurity vulnerabilities are emerging due to reliance on connected radar networks.

Analyzing Top Countries Manufacturing and Distributing Marine Radars

Country Wise Analysis Of Marine Radar Market Cagr 2025 To 2035

USA Marine Radar Market Analysis

The USA marine radar market is projected to expand at a CAGR of 5.2% during 2025 to 2035, driven by navy modernization and maritime surveillance investments. Radar innovation is being led by Raytheon, Lockheed Martin, and Northrop Grumman, contributing to the region’s growth. Integration with satellite and cloud-based systems is being prioritized.

  • Expansion of USA Coast Guard and Navy radar modernization programs.
  • Increased demand for multi-band, high-resolution radar systems.
  • Integration of radar with satellite and cloud-based surveillance platforms.

Marine Radar Sales Analysis in the UK

The UK marine radar market is forecasted to grow at 4.8% CAGR, supported by investments in coastal radar networks and port infrastructure. BAE Systems and Kelvin Hughes are leading development in this area.

  • Government investment in coastal radar networks and maritime safety.
  • Solid-state radar technologies being adopted for port surveillance.
  • Growth in autonomous vessel operations using AI-enabled radar.

Germany Marine Radar Market Analysis

Germany’s marine radar market is anticipated to expand at 4.9% CAGR due to defense radar innovation and shipping modernization efforts. Rohde & Schwarz and Hensoldt are advancing local marine electronics R&D.

  • Navy modernization and radar upgrades boosting domestic demand.
  • Growing adoption of radar in commercial shipping and maritime logistics.
  • Emphasis on environmental monitoring using radar-linked systems.

Marine Radar Demand Analysis in France

France’s marine radar market is forecasted to expand at 4.7% CAGR, led by naval defense initiatives and NATO radar collaborations. Thales Group is expanding radar solutions for coast guards and research fleets.

  • High demand for radar in naval operations and anti-piracy efforts.
  • Investment in smart ports and radar-assisted cargo tracking.
  • Collaborative R&D for long-range radar with NATO partners.

Japan Marine Radar Market Analysis

Japan’s marine radar market is forecasted to grow at a CAGR of 5.3% from 2025 to 2035fueled by maritime safety priorities and strong radar technology innovation. Furuno, JRC, and Mitsubishi Electric are delivering advanced radar for coastal, defense, and commercial vessels.

  • Strong government support for autonomous vessels and radar R&D.
  • AI-driven radar being widely adopted in fishing and shipping sectors.
  • Demand rising for weather-resistant radar solutions for coastal fleets.

Leading Marine Radar Suppliers and Distributors

The marine radar market is consolidated, with major players such as Simrad (Navico), Hexagon AB, HENSOLDT (Kelvin Hughes), SAAB, and BAE Systems controlling significant market shares. Competition is being driven by AI-driven radar innovation, strategic defense partnerships, geographic expansion, and enhanced integration capabilities. Premium features such as cloud connectivity and multi-band operability are justifying higher price points in select segments.

Hexagon AB has been emphasizing sensor fusion and precision engineering, as demonstrated by its recent MoU with GPR, Inc. to integrate ground-penetrating radar into its navigation platforms, alongside a planned spin-off of its Asset Lifecycle Intelligence business.

Marine Radar Industry News

  • In June 2025, Saab launched the Coast Control Radar, a next-generation, non-rotating, software-defined radar developed in the UAE. This radar is designed for easy integration into infrastructure such as buildings, towers, and waterway bridges, offering comprehensive 360-degree coverage and advanced detection capabilities for small and fast-moving objects in demanding coastal environments.
  • In February 2025, HENSOLDT and Abu Dhabi Ship Building (ADSB), an EDGE Group entity, signed a Memorandum of Understanding (MoU) at IDEX 2025 to explore collaboration opportunities in the development of advanced naval technologies.
  • In March 2024, Sensor solutions provider HENSOLDT UK announced the successful completion of Type Approval for its latest Manta NEO X band radar system, designed specifically for the commercial shipping market.

Marine Radar Market Report Scope

Report Attributes Details
Current Total Market Size (2025) USD 1.57 billion
Projected Market Size (2035) USD 2.56 billion
CAGR (2025 to 2035) 5%
Base Year for Estimation 2024
Historical Period 2020 to 2024
Projections Period 2025 to 2035
Report Parameter Revenue in USD billions /units
By Type X-Band Radar, S-Band Radar, and Others (K-Band, C-Band)
By Component Transmitters, Antennas, Receivers, Displays, and Processors
By Application Navigation, Collision Avoidance, Surveillance & Security
By End Use Commercial Vessels, Fishing Vessels, Naval & Defense , Recreational Boats, and Offshore Oil & Gas
Regions Covered North America, Latin America, Western Europe, Eastern Europe, South Asia, East Asia, Middle East & Africa
Countries Covered United States, Canada, United Kingdom, Germany, France, China, Japan, South Korea, Brazil, Australia
Key Players Hexagon AB, Blum- Novotest GmbH, Marposs S.p.A., Heidenhain GmbH, Simrad ( Navico Group), SAAB AB, Kelvin Hughes Ltd., Koden Electronics Co., Ltd., BAE Systems plc, and Hensoldt AG.
Additional Attributes Dollar sales by value, market share analysis by region, country-wise analysis.

Key Segmentation

By Type:

The market is segmented into X-Band Radar, S-Band Radar, and Others.

By Component:

The industry is divided into Transmitters, Antennas, Receivers, Displays, and Processors.

By Application:

The market caters to Navigation, Collision Avoidance, and Surveillance & Security.

By End-Use Industry:

The report covers key sectors, including Commercial Vessels, Fishing Vessels, Naval & Defense, Recreational Boats, and Offshore Oil & Gas.

By Region:

The report covers key regions, including North America, Latin America, Western Europe, Eastern Europe, East Asia, South Asia, and the Middle East & Africa (MEA).

Table of Content

  1. Executive Summary
  2. Industry Introduction, including Taxonomy and Market Definition
  3. Market Trends and Success Factors, including Macro-economic Factors, Market Dynamics, and Recent Industry Developments
  4. Global Market Demand Analysis 2020 to 2024 and Forecast 2025 to 2035, including Historical Analysis and Future Projections
  5. Pricing Analysis
  6. Global Market Analysis 2020 to 2024 and Forecast 2025 to 2035
    • Type
    • Component
    • Application
    • End Use
  7. Global Market Analysis 2020 to 2024 and Forecast 2025 to 2035, By Type
    • X-Band Radar
    • S-Band Radar
    • Others
  8. Global Market Analysis 2020 to 2024 and Forecast 2025 to 2035, By Component
    • Transmitters
    • Antennas
    • Receivers
    • Displays
    • Processors
  9. Global Market Analysis 2020 to 2024 and Forecast 2025 to 2035, By Application
    • Navigation
    • Collision Avoidance
    • Surveillance & Security
  10. Global Market Analysis 2020 to 2024 and Forecast 2025 to 2035, By End Use
    • Commercial Vessels
    • Fishing Vessels
    • Naval & Defense
    • Recreational Boats
    • Offshore Oil & Gas
  11. Global Market Analysis 2020 to 2024 and Forecast 2025 to 2035, By Region
    • North America
    • Latin America
    • Western Europe
    • South Asia
    • East Asia
    • Eastern Europe
    • Middle East & Africa
  12. North America Sales Analysis 2020 to 2024 and Forecast 2025 to 2035, by Key Segments and Countries
  13. Latin America Sales Analysis 2020 to 2024 and Forecast 2025 to 2035, by Key Segments and Countries
  14. Western Europe Sales Analysis 2020 to 2024 and Forecast 2025 to 2035, by Key Segments and Countries
  15. South Asia Sales Analysis 2020 to 2024 and Forecast 2025 to 2035, by Key Segments and Countries
  16. East Asia Sales Analysis 2020 to 2024 and Forecast 2025 to 2035, by Key Segments and Countries
  17. Eastern Europe Sales Analysis 2020 to 2024 and Forecast 2025 to 2035, by Key Segments and Countries
  18. Middle East & Africa Sales Analysis 2020 to 2024 and Forecast 2025 to 2035, by Key Segments and Countries
  19. Sales Forecast 2025 to 2035 by Type, Component, Application, and End Use for 30 Countries
  20. Competition Outlook, including Market Structure Analysis, Company Share Analysis by Key Players, and Competition Dashboard
  21. Company Profile
    • Hexagon AB
    • Blum-Novotest GmbH
    • Marposs S.p.A.
    • Heidenhain GmbH
    • Simrad (Navico Group)
    • SAAB AB
    • Kelvin Hughes Ltd.
    • Koden Electronics Co., Ltd.
    • BAE Systems plc
    • Hensoldt AG

List of Tables

  • Table 1: Global Market Value (USD Billion) Forecast By Region, 2020 to 2035
  • Table 2: Global Market Volume (Units) Forecast By Region, 2020 to 2035
  • Table 3: Global Market Value (USD Billion) Forecast By Type, 2020 to 2035
  • Table 4: Global Market Volume (Units) Forecast By Type, 2020 to 2035
  • Table 5: Global Market Value (USD Billion) Forecast By Component, 2020 to 2035
  • Table 6: Global Market Volume (Units) Forecast By Component, 2020 to 2035
  • Table 7: Global Market Value (USD Billion) Forecast By End Use, 2020 to 2035
  • Table 8: Global Market Volume (Units) Forecast By End Use, 2020 to 2035
  • Table 9: Global Market Value (USD Billion) Forecast By Application, 2020 to 2035
  • Table 10: Global Market Volume (Units) Forecast By Application, 2020 to 2035
  • Table 11: North America Market Value (USD Billion) Forecast By Country, 2020 to 2035
  • Table 12: North America Market Volume (Units) Forecast By Country, 2020 to 2035
  • Table 13: North America Market Value (USD Billion) Forecast By Type, 2020 to 2035
  • Table 14: North America Market Volume (Units) Forecast By Type, 2020 to 2035
  • Table 15: North America Market Value (USD Billion) Forecast By Component, 2020 to 2035
  • Table 16: North America Market Volume (Units) Forecast By Component, 2020 to 2035
  • Table 17: North America Market Value (USD Billion) Forecast By End Use, 2020 to 2035
  • Table 18: North America Market Volume (Units) Forecast By End Use, 2020 to 2035
  • Table 19: North America Market Value (USD Billion) Forecast By Application, 2020 to 2035
  • Table 20: North America Market Volume (Units) Forecast By Application, 2020 to 2035
  • Table 21: Latin America Market Value (USD Billion) Forecast By Country, 2020 to 2035
  • Table 22: Latin America Market Volume (Units) Forecast By Country, 2020 to 2035
  • Table 23: Latin America Market Value (USD Billion) Forecast By Type, 2020 to 2035
  • Table 24: Latin America Market Volume (Units) Forecast By Type, 2020 to 2035
  • Table 25: Latin America Market Value (USD Billion) Forecast By Component, 2020 to 2035
  • Table 26: Latin America Market Volume (Units) Forecast By Component, 2020 to 2035
  • Table 27: Latin America Market Value (USD Billion) Forecast By End Use, 2020 to 2035
  • Table 28: Latin America Market Volume (Units) Forecast By End Use, 2020 to 2035
  • Table 29: Latin America Market Value (USD Billion) Forecast By Application, 2020 to 2035
  • Table 30: Latin America Market Volume (Units) Forecast By Application, 2020 to 2035
  • Table 31: Western Europe Market Value (USD Billion) Forecast By Country, 2020 to 2035
  • Table 32: Western Europe Market Volume (Units) Forecast By Country, 2020 to 2035
  • Table 33: Western Europe Market Value (USD Billion) Forecast By Type, 2020 to 2035
  • Table 34: Western Europe Market Volume (Units) Forecast By Type, 2020 to 2035
  • Table 35: Western Europe Market Value (USD Billion) Forecast By Component, 2020 to 2035
  • Table 36: Western Europe Market Volume (Units) Forecast By Component, 2020 to 2035
  • Table 37: Western Europe Market Value (USD Billion) Forecast By End Use, 2020 to 2035
  • Table 38: Western Europe Market Volume (Units) Forecast By End Use, 2020 to 2035
  • Table 39: Western Europe Market Value (USD Billion) Forecast By Application, 2020 to 2035
  • Table 40: Western Europe Market Volume (Units) Forecast By Application, 2020 to 2035
  • Table 41: Eastern Europe Market Value (USD Billion) Forecast By Country, 2020 to 2035
  • Table 42: Eastern Europe Market Volume (Units) Forecast By Country, 2020 to 2035
  • Table 43: Eastern Europe Market Value (USD Billion) Forecast By Type, 2020 to 2035
  • Table 44: Eastern Europe Market Volume (Units) Forecast By Type, 2020 to 2035
  • Table 45: Eastern Europe Market Value (USD Billion) Forecast By Component, 2020 to 2035
  • Table 46: Eastern Europe Market Volume (Units) Forecast By Component, 2020 to 2035
  • Table 47: Eastern Europe Market Value (USD Billion) Forecast By End Use, 2020 to 2035
  • Table 48: Eastern Europe Market Volume (Units) Forecast By End Use, 2020 to 2035
  • Table 49: Eastern Europe Market Value (USD Billion) Forecast By Application, 2020 to 2035
  • Table 50: Eastern Europe Market Volume (Units) Forecast By Application, 2020 to 2035
  • Table 51: East Asia Market Value (USD Billion) Forecast By Country, 2020 to 2035
  • Table 52: East Asia Market Volume (Units) Forecast By Country, 2020 to 2035
  • Table 53: East Asia Market Value (USD Billion) Forecast By Type, 2020 to 2035
  • Table 54: East Asia Market Volume (Units) Forecast By Type, 2020 to 2035
  • Table 55: East Asia Market Value (USD Billion) Forecast By Component, 2020 to 2035
  • Table 56: East Asia Market Volume (Units) Forecast By Component, 2020 to 2035
  • Table 57: East Asia Market Value (USD Billion) Forecast By End Use, 2020 to 2035
  • Table 58: East Asia Market Volume (Units) Forecast By End Use, 2020 to 2035
  • Table 59: East Asia Market Value (USD Billion) Forecast By Application, 2020 to 2035
  • Table 60: East Asia Market Volume (Units) Forecast By Application, 2020 to 2035
  • Table 61: South Asia & Pacific Market Value (USD Billion) Forecast By Country, 2020 to 2035
  • Table 62: South Asia & Pacific Market Volume (Units) Forecast By Country, 2020 to 2035
  • Table 63: South Asia & Pacific Market Value (USD Billion) Forecast By Type, 2020 to 2035
  • Table 64: South Asia & Pacific Market Volume (Units) Forecast By Type, 2020 to 2035
  • Table 65: South Asia & Pacific Market Value (USD Billion) Forecast By Component, 2020 to 2035
  • Table 66: South Asia & Pacific Market Volume (Units) Forecast By Component, 2020 to 2035
  • Table 67: South Asia & Pacific Market Value (USD Billion) Forecast By End Use, 2020 to 2035
  • Table 68: South Asia & Pacific Market Volume (Units) Forecast By End Use, 2020 to 2035
  • Table 69: South Asia & Pacific Market Value (USD Billion) Forecast By Application, 2020 to 2035
  • Table 70: South Asia & Pacific Market Volume (Units) Forecast By Application, 2020 to 2035
  • Table 71: Middle East and Africa Market Value (USD Billion) Forecast By Country, 2020 to 2035
  • Table 72: Middle East and Africa Market Volume (Units) Forecast By Country, 2020 to 2035
  • Table 73: Middle East and Africa Market Value (USD Billion) Forecast By Type, 2020 to 2035
  • Table 74: Middle East and Africa Market Volume (Units) Forecast By Type, 2020 to 2035
  • Table 75: Middle East and Africa Market Value (USD Billion) Forecast By Component, 2020 to 2035
  • Table 76: Middle East and Africa Market Volume (Units) Forecast By Component, 2020 to 2035
  • Table 77: Middle East and Africa Market Value (USD Billion) Forecast By End Use, 2020 to 2035
  • Table 78: Middle East and Africa Market Volume (Units) Forecast By End Use, 2020 to 2035
  • Table 79: Middle East and Africa Market Value (USD Billion) Forecast By Application, 2020 to 2035
  • Table 80: Middle East and Africa Market Volume (Units) Forecast By Application, 2020 to 2035

List of Figures

  • Figure 1: Global Market Volume (Units) Forecast 2020 to 2035
  • Figure 2: Global Market Pricing Analysis
  • Figure 3: Global Market Value (USD Billion) Forecast 2020 to 2035
  • Figure 4: Global Market Value Share and BPS Analysis By Type, 2025 and 2035
  • Figure 5: Global Market Y-o-Y Growth Comparison By Type, 2025 to 2035
  • Figure 6: Global Market Attractiveness Analysis By Type
  • Figure 7: Global Market Value Share and BPS Analysis By Component, 2025 and 2035
  • Figure 8: Global Market Y-o-Y Growth Comparison By Component, 2025 to 2035
  • Figure 9: Global Market Attractiveness Analysis By Component
  • Figure 10: Global Market Value Share and BPS Analysis By End Use, 2025 and 2035
  • Figure 11: Global Market Y-o-Y Growth Comparison By End Use, 2025 to 2035
  • Figure 12: Global Market Attractiveness Analysis By End Use
  • Figure 13: Global Market Value Share and BPS Analysis By Application, 2025 and 2035
  • Figure 14: Global Market Y-o-Y Growth Comparison By Application, 2025 to 2035
  • Figure 15: Global Market Attractiveness Analysis By Application
  • Figure 16: Global Market Value (USD Billion) Share and BPS Analysis By Region, 2025 and 2035
  • Figure 17: Global Market Y-o-Y Growth Comparison By Region, 2025 to 2035
  • Figure 18: Global Market Attractiveness Analysis By Region
  • Figure 19: North America Market Incremental $ Opportunity, 2025 to 2035
  • Figure 20: Latin America Market Incremental $ Opportunity, 2025 to 2035
  • Figure 21: Western Europe Market Incremental $ Opportunity, 2025 to 2035
  • Figure 22: Eastern Europe Market Incremental $ Opportunity, 2025 to 2035
  • Figure 23: East Asia Market Incremental $ Opportunity, 2025 to 2035
  • Figure 24: South Asia & Pacific Market Incremental $ Opportunity, 2025 to 2035
  • Figure 25: Middle East and Africa Market Incremental $ Opportunity, 2025 to 2035
  • Figure 26: North America Market Value Share and BPS Analysis By Country, 2025 and 2035
  • Figure 27: North America Market Value Share and BPS Analysis By Type, 2025 and 2035
  • Figure 28: North America Market Y-o-Y Growth Comparison By Type, 2025 to 2035
  • Figure 29: North America Market Attractiveness Analysis By Type
  • Figure 30: North America Market Value Share and BPS Analysis By Component, 2025 and 2035
  • Figure 31: North America Market Y-o-Y Growth Comparison By Component, 2025 to 2035
  • Figure 32: North America Market Attractiveness Analysis By Component
  • Figure 33: North America Market Value Share and BPS Analysis By End Use, 2025 and 2035
  • Figure 34: North America Market Y-o-Y Growth Comparison By End Use, 2025 to 2035
  • Figure 35: North America Market Attractiveness Analysis By End Use
  • Figure 36: North America Market Value Share and BPS Analysis By Application, 2025 and 2035
  • Figure 37: North America Market Y-o-Y Growth Comparison By Application, 2025 to 2035
  • Figure 38: North America Market Attractiveness Analysis By Application
  • Figure 39: Latin America Market Value Share and BPS Analysis By Country, 2025 and 2035
  • Figure 40: Latin America Market Value Share and BPS Analysis By Type, 2025 and 2035
  • Figure 41: Latin America Market Y-o-Y Growth Comparison By Type, 2025 to 2035
  • Figure 42: Latin America Market Attractiveness Analysis By Type
  • Figure 43: Latin America Market Value Share and BPS Analysis By Component, 2025 and 2035
  • Figure 44: Latin America Market Y-o-Y Growth Comparison By Component, 2025 to 2035
  • Figure 45: Latin America Market Attractiveness Analysis By Component
  • Figure 46: Latin America Market Value Share and BPS Analysis By End Use, 2025 and 2035
  • Figure 47: Latin America Market Y-o-Y Growth Comparison By End Use, 2025 to 2035
  • Figure 48: Latin America Market Attractiveness Analysis By End Use
  • Figure 49: Latin America Market Value Share and BPS Analysis By Application, 2025 and 2035
  • Figure 50: Latin America Market Y-o-Y Growth Comparison By Application, 2025 to 2035
  • Figure 51: Latin America Market Attractiveness Analysis By Application
  • Figure 52: Western Europe Market Value Share and BPS Analysis By Country, 2025 and 2035
  • Figure 53: Western Europe Market Value Share and BPS Analysis By Type, 2025 and 2035
  • Figure 54: Western Europe Market Y-o-Y Growth Comparison By Type, 2025 to 2035
  • Figure 55: Western Europe Market Attractiveness Analysis By Type
  • Figure 56: Western Europe Market Value Share and BPS Analysis By Component, 2025 and 2035
  • Figure 57: Western Europe Market Y-o-Y Growth Comparison By Component, 2025 to 2035
  • Figure 58: Western Europe Market Attractiveness Analysis By Component
  • Figure 59: Western Europe Market Value Share and BPS Analysis By End Use, 2025 and 2035
  • Figure 60: Western Europe Market Y-o-Y Growth Comparison By End Use, 2025 to 2035
  • Figure 61: Western Europe Market Attractiveness Analysis By End Use
  • Figure 62: Western Europe Market Value Share and BPS Analysis By Application, 2025 and 2035
  • Figure 63: Western Europe Market Y-o-Y Growth Comparison By Application, 2025 to 2035
  • Figure 64: Western Europe Market Attractiveness Analysis By Application
  • Figure 65: Eastern Europe Market Value Share and BPS Analysis By Country, 2025 and 2035
  • Figure 66: Eastern Europe Market Value Share and BPS Analysis By Type, 2025 and 2035
  • Figure 67: Eastern Europe Market Y-o-Y Growth Comparison By Type, 2025 to 2035
  • Figure 68: Eastern Europe Market Attractiveness Analysis By Type
  • Figure 69: Eastern Europe Market Value Share and BPS Analysis By Component, 2025 and 2035
  • Figure 70: Eastern Europe Market Y-o-Y Growth Comparison By Component, 2025 to 2035
  • Figure 71: Eastern Europe Market Attractiveness Analysis By Component
  • Figure 72: Eastern Europe Market Value Share and BPS Analysis By End Use, 2025 and 2035
  • Figure 73: Eastern Europe Market Y-o-Y Growth Comparison By End Use, 2025 to 2035
  • Figure 74: Eastern Europe Market Attractiveness Analysis By End Use
  • Figure 75: Eastern Europe Market Value Share and BPS Analysis By Application, 2025 and 2035
  • Figure 76: Eastern Europe Market Y-o-Y Growth Comparison By Application, 2025 to 2035
  • Figure 77: Eastern Europe Market Attractiveness Analysis By Application
  • Figure 78: East Asia Market Value Share and BPS Analysis By Country, 2025 and 2035
  • Figure 79: East Asia Market Value Share and BPS Analysis By Type, 2025 and 2035
  • Figure 80: East Asia Market Y-o-Y Growth Comparison By Type, 2025 to 2035
  • Figure 81: East Asia Market Attractiveness Analysis By Type
  • Figure 82: East Asia Market Value Share and BPS Analysis By Component, 2025 and 2035
  • Figure 83: East Asia Market Y-o-Y Growth Comparison By Component, 2025 to 2035
  • Figure 84: East Asia Market Attractiveness Analysis By Component
  • Figure 85: East Asia Market Value Share and BPS Analysis By End Use, 2025 and 2035
  • Figure 86: East Asia Market Y-o-Y Growth Comparison By End Use, 2025 to 2035
  • Figure 87: East Asia Market Attractiveness Analysis By End Use
  • Figure 88: East Asia Market Value Share and BPS Analysis By Application, 2025 and 2035
  • Figure 89: East Asia Market Y-o-Y Growth Comparison By Application, 2025 to 2035
  • Figure 90: East Asia Market Attractiveness Analysis By Application
  • Figure 91: South Asia & Pacific Market Value Share and BPS Analysis By Country, 2025 and 2035
  • Figure 92: South Asia & Pacific Market Value Share and BPS Analysis By Type, 2025 and 2035
  • Figure 93: South Asia & Pacific Market Y-o-Y Growth Comparison By Type, 2025 to 2035
  • Figure 94: South Asia & Pacific Market Attractiveness Analysis By Type
  • Figure 95: South Asia & Pacific Market Value Share and BPS Analysis By Component, 2025 and 2035
  • Figure 96: South Asia & Pacific Market Y-o-Y Growth Comparison By Component, 2025 to 2035
  • Figure 97: South Asia & Pacific Market Attractiveness Analysis By Component
  • Figure 98: South Asia & Pacific Market Value Share and BPS Analysis By End Use, 2025 and 2035
  • Figure 99: South Asia & Pacific Market Y-o-Y Growth Comparison By End Use, 2025 to 2035
  • Figure 100: South Asia & Pacific Market Attractiveness Analysis By End Use
  • Figure 101: South Asia & Pacific Market Value Share and BPS Analysis By Application, 2025 and 2035
  • Figure 102: South Asia & Pacific Market Y-o-Y Growth Comparison By Application, 2025 to 2035
  • Figure 103: South Asia & Pacific Market Attractiveness Analysis By Application
  • Figure 104: Middle East and Africa Market Value Share and BPS Analysis By Country, 2025 and 2035
  • Figure 105: Middle East and Africa Market Value Share and BPS Analysis By Type, 2025 and 2035
  • Figure 106: Middle East and Africa Market Y-o-Y Growth Comparison By Type, 2025 to 2035
  • Figure 107: Middle East and Africa Market Attractiveness Analysis By Type
  • Figure 108: Middle East and Africa Market Value Share and BPS Analysis By Component, 2025 and 2035
  • Figure 109: Middle East and Africa Market Y-o-Y Growth Comparison By Component, 2025 to 2035
  • Figure 110: Middle East and Africa Market Attractiveness Analysis By Component
  • Figure 111: Middle East and Africa Market Value Share and BPS Analysis By End Use, 2025 and 2035
  • Figure 112: Middle East and Africa Market Y-o-Y Growth Comparison By End Use, 2025 to 2035
  • Figure 113: Middle East and Africa Market Attractiveness Analysis By End Use
  • Figure 114: Middle East and Africa Market Value Share and BPS Analysis By Application, 2025 and 2035
  • Figure 115: Middle East and Africa Market Y-o-Y Growth Comparison By Application, 2025 to 2035
  • Figure 116: Middle East and Africa Market Attractiveness Analysis By Application
  • Figure 117: Global Market - Tier Structure Analysis
  • Figure 118: Global Market - Company Share Analysis

Frequently Asked Questions

What is the projected size of the marine radar market by 2035?

The market is expected to reach USD 2.56 billion by 2035.

What is the growth rate of the marine radar market?

The market is projected to grow at a CAGR of 5% from 2025 to 2035.

Which radar type holds the largest share in the marine radar market?

X-Band radar leads the market with a 47% share due to its high-resolution and cost-efficiency.

Which region leads the global marine radar market?

North America holds the leading regional share, driven by defense and port security investments.

Who are the key players in the marine radar market?

Key players include Furuno, Simrad (Navico), HENSOLDT, Hexagon AB, and BAE Systems.

Explore Similar Insights

Future Market Insights

Marine Radar Market