Marine Nutraceutical Market Size and Share Forecast Outlook From 2025 to 2035

The marine nutraceutical market is experiencing strong growth due to increasing consumer awareness of the health benefits associated with marine-derived compounds. Demand is being driven by the growing preference for natural and functional ingredients that support cardiovascular health, cognitive function, and overall wellness. Current market dynamics reflect an expansion of the dietary supplement sector and a rising inclination toward preventive healthcare.

Manufacturers are investing in sustainable sourcing practices, advanced extraction technologies, and formulation innovation to improve purity and bioavailability. Regulatory emphasis on quality and safety standards is further enhancing consumer trust and market acceptance.

The future outlook is positive as product diversification, technological advancements, and expansion into emerging markets continue to boost global demand Growth rationale is anchored on evolving dietary patterns, increased consumer spending on premium nutraceutical products, and the ability of marine ingredients to deliver proven physiological benefits, positioning the market for sustained long-term development.
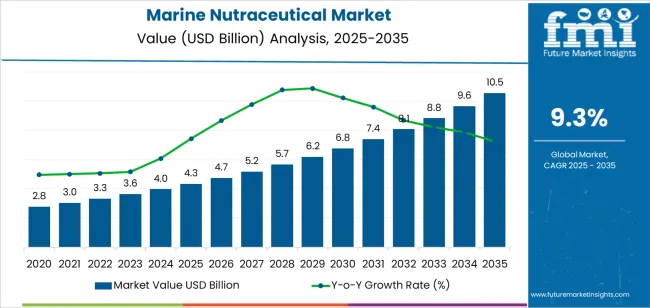
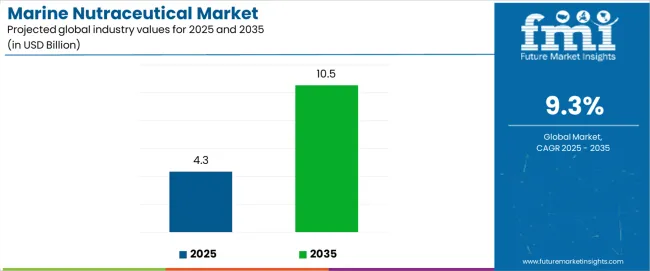
Marine Nutraceutical Market Market Value Analysis

Quick Stats for Marine Nutraceutical Market

  • Marine Nutraceutical Market Industry Value (2025): USD 4.3 billion
  • Marine Nutraceutical Market Forecast Value (2035): USD 10.5 billion
  • Marine Nutraceutical Market Forecast CAGR: 9.3%
  • Leading Segment in Marine Nutraceutical Market in 2025: Fatty Acids (27.4%)
  • Key Growth Region in Marine Nutraceutical Market: North America, Asia-Pacific, Europe
  • Top Key Players in Marine Nutraceutical Market: Amway Corp., Rousselot, Aditivos Group (KEMTIA), GFR Pharma, General Mills Inc., Standard Functional Foods Group Inc., Abbott Laboratories, Roquette Kloetze, AlgaNovo International Co., Ltd, Yigeda Bio-Technology Co., Ltd, EID Parry, BASF, Natural Beta Technologies, Cyanotech, Mera Pharma, BioReal

Marine Nutraceutical Market Industry Value Analysis

Metric Value
Marine Nutraceutical Market Estimated Value in (2025 E) USD 4.3 billion
Marine Nutraceutical Market Forecast Value in (2035 F) USD 10.5 billion
Forecast CAGR (2025 to 2035) 9.3%

Segmental Analysis

The market is segmented by Active Compounds, Product Type, Form, and Sales Channel and region. By Active Compounds, the market is divided into Fatty Acids, Vitamins, Minerals, Carotenoids, and Marine Collagen. In terms of Product Type, the market is classified into Dietary Supplement, Functional Foods, Probiotics Fortified Foods, Omega fatty Acid Fortified Foods, Functional Beverages, Energy Drinks, Health Drinks, Fortified Juices, Protein Supplements, Vitamins And Minerals, Herbal Supplements, and Other Dietary Supplements. Based on Form, the market is segmented into Capsules, Liquids, Tablets, and Powder & Granule. By Sales Channel, the market is divided into Indirect Sales/B2C, On Direct Sales/B2B, Pharmacies/Drugstores, Modern Trade Channel, and Online Retailing. Regionally, the market is classified into North America, Latin America, Western Europe, Eastern Europe, Balkan & Baltic Countries, Russia & Belarus, Central Asia, East Asia, South Asia & Pacific, and the Middle East & Africa.
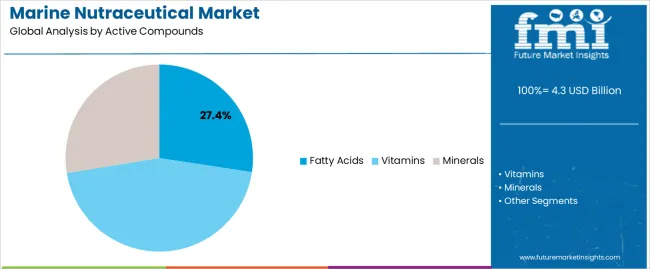
Insights into the Active Compounds Segment

Marine Nutraceutical Market Analysis By Active Compounds

The fatty acids segment, accounting for 27.40% of the active compounds category, has been leading the market due to its established role in promoting cardiovascular, neurological, and metabolic health. Omega-3 and other marine-derived fatty acids have gained consistent demand owing to their clinically validated benefits and strong consumer recognition.

Production improvements and purification technologies have enhanced concentration levels and absorption efficiency, strengthening the segment’s competitive position. Regulatory approvals and favorable labeling standards have supported market penetration across multiple regions.

Increasing research activities and new product launches incorporating fatty acids into functional foods and supplements are expected to sustain segment growth The combination of scientific validation and consumer familiarity ensures the segment’s continued dominance within the marine nutraceutical landscape.
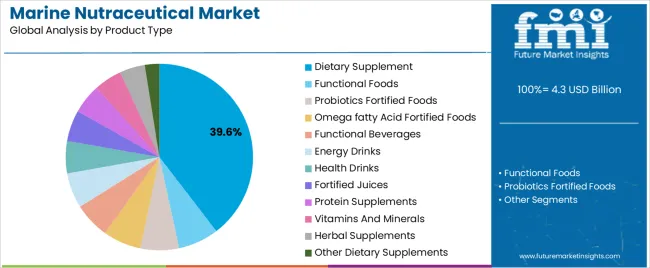
Insights into the Product Type Segment

Marine Nutraceutical Market Analysis By Product Type

The dietary supplement segment, representing 39.60% of the product type category, has maintained leadership due to rising global adoption of preventive health practices and increasing availability of marine-based formulations. Product innovation, including blends with vitamins, minerals, and botanical extracts, has expanded consumer appeal.

The segment’s growth is supported by the shift toward self-care and the increasing use of e-commerce platforms for supplement distribution. Enhanced product stability and improved taste-masking techniques have further strengthened acceptance.

Manufacturers are prioritizing clean-label claims and sustainable sourcing to meet consumer expectations for transparency and environmental responsibility Continued R&D investment and growing awareness of marine-derived health benefits are expected to reinforce the dietary supplement segment’s leading position over the forecast period.
Insights into the Form Segment

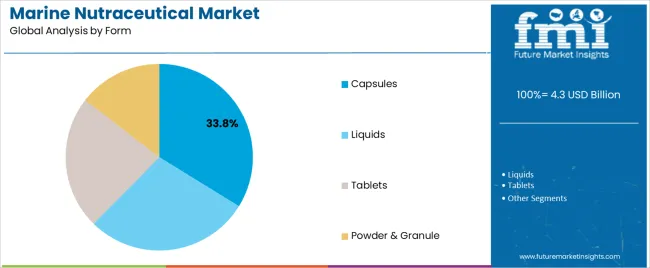
Marine Nutraceutical Market Analysis By Form

The capsules segment, holding 33.80% of the form category, has emerged as the dominant delivery format due to its convenience, accurate dosage, and extended shelf life. Capsules provide superior protection for sensitive marine compounds such as omega oils, ensuring stability and efficacy throughout the product’s lifecycle.

Their popularity has been supported by consumer preference for easy-to-consume, portable formats with minimal aftertaste. Advances in encapsulation technologies, including soft-gel and enteric-coated variants, have improved absorption and consumer compliance.

The pharmaceutical-grade presentation of capsules has enhanced trust among health-conscious users and healthcare professionals With sustained demand for high-quality marine nutraceuticals and innovations in capsule formulation, this segment is expected to retain its leadership and contribute significantly to the overall market expansion.

Global Overview of the Marine Nutraceutical Market

  • Demand for marine nutraceuticals is rising rapidly, and the trend will likely persist through 2035. This is due to growing consumer preference for marine-based ingredients. These nutritional and health-promoting chemicals are obtained from marine resources such as sponges, crabs, fish, algae, and other aquatic creatures.
  • Vitamins, minerals, omega-3 fatty acids, antioxidants, peptides, polysaccharides, and collagen are a few bioactive substances found in abundance in marine-based components. Growing demand for these marine bioactive compounds from industries like functional foods and dietary supplements will likely foster sales growth.
  • Marine-based nutraceuticals have a variety of positive health effects. As a result, health-conscious consumers are keen to consume them, thereby fueling their demand.
  • People are consuming different nutraceutical supplements to stay healthy, improve their immune systems, and prevent disease development or acquisition. This will continue to provide impetus for market growth.
  • Fatty acids such as EPA and DHA are gaining immense popularity for their support of cardiovascular health, anti-inflammatory qualities, and beneficial impacts on eye health.
  • In the cosmetics and skincare industries, collagen from marine sources is frequently used. It encourages the well-being of the nails, hair, and bones and improves skin moisture and suppleness.
  • As manufacturers focus more on extending and improving their product lines, sales of marine nutritional supplements are anticipated to rise.
  • To attract customers, businesses are releasing fresh, cutting-edge goods that use organic and natural components.
  • For instance, Protein Rebel, a sports nutrition company, launched Run Easy marine collagen peptides powder for runners and triathletes, helping them strengthen ligaments and joints and lowering the risk of injury.
  • Omega-3 supplements made from algae provide a healthy and sustainable substitute for conventional fish oil supplements.
  • The effects of overfishing and worries about their effects on marine ecosystems have caused a shift in consumer preferences towards environmentally friendly and sustainable products. Omega-3 supplements made from algae offer a regenerative and non-depleting supply of these crucial fatty acids.

Top Factors Driving Growth of the Marine Nutraceutical Market

  • Increasing demand for marine proteins like collagen is set to boost the market.
  • Growing awareness of the health benefits of marine-derived supplements is acting as a catalyst driving market growth.
  • Rapid urbanization and changing food preferences will positively influence marine nutraceutical sales.
  • Escalating awareness of the benefits of marine-derived nutrients is set to benefit the market.
  • Increasing applications of marine-derived nutraceuticals in beauty and skincare products due to their anti-aging properties
  • Rising sales of marine Nutraceuticals through e-commerce platforms are anticipated to boost revenues.
  • High consumer spending on marine health supplements
  • Surging popularity of marine omega-3 fatty acids due to their anti-inflammatory and heart-healthy properties will support market expansion.
  • Widening application of marine collagen in nutraceutical market will create growth prospects for manufacturers.

Top Marine Nutraceutical Market Dynamics and Industry Trends

  • Increasing customer preference for natural and organic ingredients is expected to fuel market growth.
  • Growing demand for customized and personalized nutritional supplements will likely foster growth of marine nutraceutical market.
  • The rising adoption of marine protein protamine as a natural preservative in the food industry is expected to fuel sales growth.
  • Increasing acceptance of functional foods and beverages is anticipated to create growth opportunities for the ocean nutraceutical market.
  • Surging popularity of nutraceuticals derived from marine algae as a sustainable alternative to fish-derived marine products will benefit the market.
  • Rising consumer preference for organic marine nutraceuticals is set to create new opportunities for companies.
  • Increasing focus on preventive healthcare will likely result in increased marine nutraceutical consumption.
  • Continuous product innovation is playing a key role in fostering market growth.

Comparison of Historical vs Future Outlook on Changing Consumer Trends for Marine Nutraceutical Industry

According to the latest analysis, global marine nutraceuticals sales grew at a CAGR of 8.8% from 2020 to 2025. For the next ten years, the worldwide marine nutraceutical industry is forecast to progress at 9.3% CAGR.

  • Consumers are continually searching for ways to prevent chronic illnesses and maintain their physical well-being because of the rising healthcare expenses. This is expected to uplift demand for marine nutraceuticals.
  • Growing interest in preventive healthcare will likely boost sales of marine nutraceuticals through 2035. Sea-based nutraceuticals are considered a natural and proactive approach to health management, offering nutritional support to enhance general health and perhaps lower the risk of chronic illnesses.
  • The attention towards healthy aging and preserving quality of life is growing as the world's population is aging. Older persons seeking to promote their well-being and age gracefully find ocean-derived nutraceuticals beneficial. This is due to their potential advantages for cardiovascular health, cognitive function, joint health, and skin health.
  • The consumer desire for goods that provide both nutrition and health benefits is propelling considerable expansion of functional food and beverage business. This, in turn, is anticipated to create growth opportunities for marine nutraceutical manufacturers.
  • Marine nutraceuticals are being incorporated into several functional food and beverage items. These include fortified juices, snacks, smoothies, and nutritional supplements. Growing demand for these products is expected to increase the need for sea-based nutraceuticals during the forecast period.

Overview of Adjacent Markets Impacting Marine Nutraceutical Industry

In this section, the marine nutraceutical market is compared to the global nutraceutical industry and the marine active ingredient market based on growth factors and key trends. This will help businesses to get a better understanding of the market scenario.

The global marine nutraceutical industry is set to grow at a higher CAGR during the forecast period. Factors like rising awareness of the potential benefits of marine-based nutraceuticals and rising interest in preventive healthcare will likely drive this growth.

Global Marine Nutraceutical Market Analysis:

Attributes Global Marine Nutraceutical Market Forecast
CAGR (2025 to 2035) 9.3%
Growth Factor Increasing marine nutraceutical applications in functional foods and dietary supplements is expected to foster growth of sea-based nutraceutical industry.
Global Trends in Marine Nutraceutical Market Rising interest in preventive healthcare and growing demand for fish oil nutraceuticals are key growth-shaping trends.

Global Nutraceutical Market Analysis:

Attributes Global Nutraceutical Industry Outlook
CAGR (2025 to 2035) 5.3%
Growth Factor Growing health consciousness and rising demand for nutraceuticals for specific health issues are expected to foster market growth.
Global Nutraceutical Market Trend Increasing demand for organic and natural ingredients and shift towards healthier and more sustainable food options will likely fuel sales.

Global Marine Active Ingredient Market Analysis:

Attributes Marine Active Ingredient Demand Outlook
CAGR (2025 to 2035) 6.4%
Growth Factor Escalating demand for natural and sustainable ingredients is set to fuel sales of marine active ingredients.
Marine Active Ingredient Market Trends Key growth-shaping trends include rising popularity of collagen in anti-aging and skin rejuvenation treatments and development of new marine chemicals.

Analysis of Top Countries, Harvesting, Processing, Packaging, Distributing, and Consuming Marine Nutraceutical

The table below highlights key countries’ marine nutraceutical market revenues. The United States, China, and Japan are expected to remain the top three consumers of marine nutraceuticals, with estimated valuations of USD 2,545.1 million, USD 895.0 million, and USD 389.3 million, respectively, in 2035.

Countries Projected Marine Nutraceutical Market Revenue (2035)
United States USD 2,545.1 million
United Kingdom USD 373.8 million
China USD 895.0 million
India USD 315.4 million
Japan USD 389.3 million

The below table shows the predicted growth rates of the top nations. India, Japan, and China are anticipated to record higher CAGRs of 7.5%, 7.2%, and 6.3%, respectively, through 2035.

Countries Projected Marine Nutraceutical Market CAGR (2025 to 2035)
United States 5.3%
United Kingdom 5.8%
China 6.3%
India 7.5%
Japan 7.2%

Growing Health Awareness Propelling Demand in China

As per the latest analysis, China marine nutraceutical market is expected to reach a valuation of around USD 895.0 million by 2035. Overall demand for marine nutraceuticals in China will likely increase at 6.3% CAGR during the next ten years, driven by factors like:
  • Rising health awareness, coupled with increasing spending on health and wellness products
  • Increasing interest in preventive healthcare
  • Growing popularity of online shopping as it allows consumers to purchase marine nutraceuticals easily
  • Surging demand for sports nutrition products containing marine nutraceuticals

Growing Popularity of Personalized Nutrition Fueling Sales in the United States

Marine Nutraceutical Market Country Value Analysis

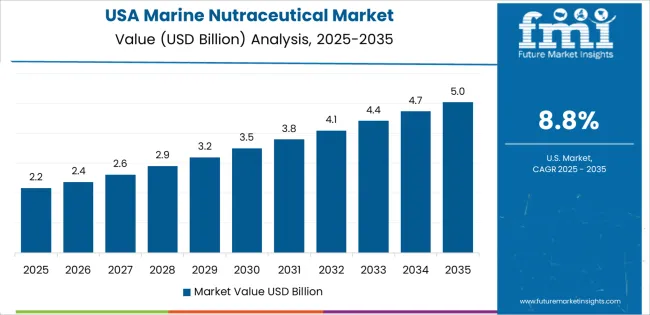
The United States marine nutraceutical industry is set to exhibit a CAGR of 5.3% during the assessment period. By 2035, the United States market size is expected to reach USD 2,545.1 million. Some of the key drivers/trends include:

  • Rising popularity of personalized nutrition
  • Increasing health and wellness trends
  • Growing demand for marine collagen due to its multiple benefits
  • Changing consumer preference toward natural and sustainable products
  • Widening applications of marine nutraceuticals in dairy products

Increasing Demand for Functional Foods Boosting India Market

Marine nutraceutical demand in India is anticipated to rise at a rapid CAGR of 7.5% during the forecast period. Accordingly, the marine nutraceutical market in India is expected to be valued at USD 3,15.4 million by 2035. This can be attributed to factors like:

  • Increasing demand for functional foods and dietary supplements containing marine nutraceuticals
  • Rising health concerns and increasing cases of diseases like diabetes
  • Growing popularity of marine-based nutraceuticals rich in vitamins and omega-3 fatty acids
  • Escalating awareness about the benefits of marine ingredients like astaxanthin
  • Increasing consumption of seaweed supplements

India has a long history of traditional medicine systems like Ayurveda, which uses organic materials and herbs for medicinal reasons. This huge knowledge base is being leveraged to explore potential of marine-derived ingredients in Ayurvedic formulations and dietary supplements.

The rise of e-commerce platforms and online retail play a key role in the accessibility and availability of marine collagen, omega 3, vitamins, and calcium dietary supplements in India. This, in turn, will likely improve India’s marine nutraceutical market share through 2035.

Key marine nutraceutical manufacturers in India are trying to market their products to reach every potential customer. Hence, strong growth has been predicted for India's marine-derived nutraceutical industry over the next ten years.

Marine Nutraceutical Industry Analysis by Top Investment Segments

The below section shows the fatty acids category dominating the marine nutraceutical industry. It is projected to grow at 5.3% CAGR through 2035. Based on product type, the functional foods segment will likely progress at a CAGR of 7.6% during the assessment period.

Demand Remains High for Fatty Acid Supplements

Top Segment (Active Compounds) Fatty Acids
Predicted CAGR (2025 to 2035) 5.3%

Based on active compounds, demand is expected to remain high for marine-based fatty acids during the assessment period. As per the latest analysis, the fatty acids segment is projected to grow at 5.3% CAGR, totaling a valuation of USD 4,150.0 million in 2035.

  • Growing popularity of marine omega-3 fatty acids due to their potential health benefits is a key factor boosting the target segment.
  • Omega-3 fatty acids like docosahexaenoic acid (DHA) and eicosapentaenoic acid (EPA) are essential for the healthy operation of the human body. Hence, consumers are continuously seeking products rich in these fatty acids.
  • The human body cannot make omega-3 fatty acids on its own. As a result, they must be obtained through diet, creating growth prospects for marine oils.
  • Marine-based sources, including fatty seafood, algae, and krill, are particularly high in EPA and DHA. Thus, they represent a significant dietary choice for satisfying omega-3 needs.
  • Several marine-based fatty acid supplements are available on the market to cater a variety of consumer preferences. These include krill oil preparations, functional meals and drinks with omega-3 fatty acids, algae-based nutraceuticals, and fish oil capsules.

Functional Foods Segment to Generate Significant Revenue through 2035

Top Segment (Product Type) Functional Foods
Predicted CAGR (2025 to 2035) 7.6%

As per the latest analysis, the functional food segment is expected to register a CAGR of 7.6% during the assessment period. It will likely generate revenue worth USD 3,23.8 million by 2035.
  • Increasing consumer interest in functional foods containing marine nutraceuticals is a prominent factor boosting segment growth.
  • Consumers are looking for functional meals that provide extra health advantages beyond that of basic nutrition due to increasing emphasis on health and wellbeing. This is expected to drive demand for functional foods rich in marine nutraceuticals.
  • Marine nutraceutical-based functional foods, which combine nutritional value of marine ingredients with specific bioactive compounds, are gaining wider popularity. This is due to their potential to support various aspects of health, including cardiovascular health, brain function, immune support, and anti-inflammatory effects.

Leading Suppliers of Marine Nutraceutical

Marine Nutraceutical Market Analysis By Company

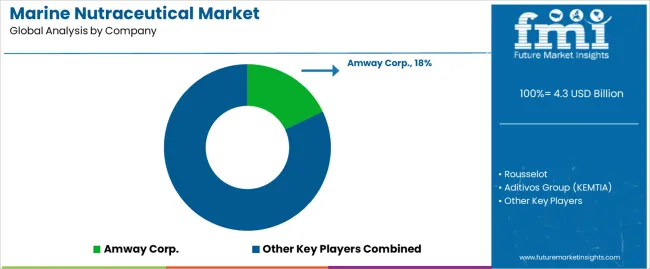
Leading manufacturers of marine nutraceuticals are constantly launching a new range of marine nutraceutical products to meet growing consumer demand. Ongoing advancements in marine biotechnology are enabling them to discover new marine bioactive compounds and extractive techniques.

Several marine nutraceutical companies are shifting toward sustainable sourcing practices to reduce environmental impacts. They are also using strategies such as partnerships, distribution agreements, mergers, advertisements, acquisitions, collaborations, and celebrity endorsements to stay ahead of the competition.

Recent Developments in the Marine Nutraceutical Market

  • In 2025, Amway launched a new range of Nutrilite Advanced Omega and Nutrilite Omega sourced from sustainable fish oil.
  • In 2024, Rousselot launched Peptan Marine, which is claimed to be the highest quality fish collagen peptide and is MSC certified fish collagen.
  • Recently, Gelita Inc. opened a new collagen peptide facility in the United States.

Top Segments Studied in the Marine Nutraceutical Market Report

  • Adjacent Study on Global Marine Functional Ingredients Market and Bio-marine Ingredients Market
  • Expected Marine Collagen in Nutraceutical Market Size
  • Emerging Marine Collagen Market Growth Opportunities
  • Health Benefits and Functional Properties of Seafood Nutraceuticals
  • Recent Advances in Marine-based Nutraceuticals
  • Marine-origin Nutraceuticals Vs Plant-based Nutraceuticals
  • Factors Encouraging Adoption of Algae-based Nutraceuticals
  • Potential Benefits of Marine Oils and other Marine Nutraceuticals
  • Ongoing Advances in Marine Drugs
  • Marine Bioactives and their Application in the Food Industry
  • Benefits of Seaweed-based Nutraceuticals
  • Growth Prospects for Nutraceutical Products Market in India

Key Shifting Preferences Covered in Marine Nutraceutical Market Report

Attribute Details
Market Size Value in 2025 USD 4.3 billion
Market Forecast Value in 2035 USD 10.5 billion
Anticipated Growth Rate (2025 to 2035) 9.3% CAGR
Forecast Period 2025 to 2035
Historical Data Available for 2020 to 2025
Market Analysis Volume (MT) and Value (USD Million)
Key Regions Covered Latin America; North America; Europe; South Asia; East Asia; Oceania; and Middle East & Africa
Key Countries Covered Canada, United States, Mexico, Brazil, Chile, Peru, Argentina, Germany, France, Italy, Spain, United Kingdom, Netherlands, Belgium, Nordic, Russia, Poland, China, Japan, South Korea, India, Thailand, Malaysia, Indonesia, Singapore, Australia, New Zealand, GCC Countries, South Africa, Central Africa, and others
Key Market Segments Covered Active Compounds, Product Type, Form, Sales Channel, and Region
Key Companies Profiled

Rousselot; Aditivos Group (KEMTIA); GFR Pharma; Amway Corp.; General Mills Inc; Standard Functional Foods Group Inc.; Abbott Laboratories; Roquette Kloetze; AlgaNovo International Co., Ltd; Yigeda Bio-Technology Co., Ltd; EID Parry; BASF; Natural Beta Technologies; Cyanotech; Mera Pharma; BioReal

Top Investment Segments Studied in Marine Nutraceutical Market

By Active Compounds:

  • Fatty Acids
    • Omega 3
    • Omega 6
    • Amino Acid
    • Arginine
    • Histidine
    • Isoleucine
    • Methionine
    • Others (Threonine, Phenylalanine, Valine, Tyrosine, etc)
  • Vitamins
    • Vitamin A
    • Vitamin D
    • Vitamin B Complex
  • Minerals
    • Iron
    • Zinc
    • Calcium
    • Iodine
  • Carotenoids
  • Marine Collagen

By Product Type:

  • Functional Foods
  • Probiotics Fortified Foods
  • Omega fatty acid fortified foods
  • Functional Beverages
  • Energy Drinks
  • Health Drinks
  • Fortified Juices
  • Dietary Supplement
  • Protein Supplements
  • Vitamins and Minerals
  • Herbal Supplements
  • Other Dietary Supplements

By Form:

  • Capsules
  • Liquids
  • Tablets
  • Powder & Granule

By Sales Channel:

  • On Direct Sales/B2B
  • Indirect Sales/B2C
  • Pharmacies/Drugstores
  • Modern Trade Channel
  • Online Retailing

By Region:

  • North America
  • Latin America
  • Europe
  • East Asia
  • South Asia
  • Oceania
  • Middle East & Africa

Frequently Asked Questions

How big is the marine nutraceutical market in 2025?

The global marine nutraceutical market is estimated to be valued at USD 4.3 billion in 2025.

What will be the size of marine nutraceutical market in 2035?

The market size for the marine nutraceutical market is projected to reach USD 10.5 billion by 2035.

How much will be the marine nutraceutical market growth between 2025 and 2035?

The marine nutraceutical market is expected to grow at a 9.3% CAGR between 2025 and 2035.

What are the key product types in the marine nutraceutical market?

The key product types in marine nutraceutical market are fatty acids, _omega 3, _omega 6, _amino acid, _arginine, _histidine, _isoleucine, _methionine, _others (threonine, phenylalanine, valine, tyrosine, etc), vitamins, _vitamin a, _vitamin d, _vitamin b complex, minerals, _iron, _zinc, _calcium, _iodine, carotenoids and marine collagen.

Which product type segment to contribute significant share in the marine nutraceutical market in 2025?

In terms of product type, dietary supplement segment to command 39.6% share in the marine nutraceutical market in 2025.

Table of Content

  1. Executive Summary
    • Global Market Outlook
    • Demand to side Trends
    • Supply to side Trends
    • Technology Roadmap Analysis
    • Analysis and Recommendations
  2. Market Overview
    • Market Coverage / Taxonomy
    • Market Definition / Scope / Limitations
  3. Market Background
    • Market Dynamics
      • Drivers
      • Restraints
      • Opportunity
      • Trends
    • Scenario Forecast
      • Demand in Optimistic Scenario
      • Demand in Likely Scenario
      • Demand in Conservative Scenario
    • Opportunity Map Analysis
    • Product Life Cycle Analysis
    • Supply Chain Analysis
    • Investment Feasibility Matrix
    • Value Chain Analysis
    • PESTLE and Porter’s Analysis
    • Regulatory Landscape
    • Regional Parent Market Outlook
    • Production and Consumption Statistics
    • Import and Export Statistics
  4. Global Market Analysis 2020 to 2024 and Forecast, 2025 to 2035
    • Historical Market Size Value (USD Million) Analysis, 2020 to 2024
    • Current and Future Market Size Value (USD Million) Projections, 2025 to 2035
      • Y to o to Y Growth Trend Analysis
      • Absolute $ Opportunity Analysis
  5. Global Market Pricing Analysis 2020 to 2024 and Forecast 2025 to 2035
  6. Global Market Analysis 2020 to 2024 and Forecast 2025 to 2035, By Active Compounds
    • Introduction / Key Findings
    • Historical Market Size Value (USD Million) Analysis By Active Compounds , 2020 to 2024
    • Current and Future Market Size Value (USD Million) Analysis and Forecast By Active Compounds , 2025 to 2035
      • Fatty Acids
        • Omega 3
        • Omega 6
        • Amino Acid
        • Arginine
        • Histidine
        • Isoleucine
        • Methionine
        • Others (Threonine, Phenylalanine, Valine, Tyrosine, etc)
      • Vitamins
        • Vitamin A
        • Vitamin D
        • Vitamin B Complex
      • Minerals
        • Iron
        • Zinc
        • Calcium
        • Iodine
      • Carotenoids
      • Marine Collagen
    • Y to o to Y Growth Trend Analysis By Active Compounds , 2020 to 2024
    • Absolute $ Opportunity Analysis By Active Compounds , 2025 to 2035
  7. Global Market Analysis 2020 to 2024 and Forecast 2025 to 2035, By Product Type
    • Introduction / Key Findings
    • Historical Market Size Value (USD Million) Analysis By Product Type, 2020 to 2024
    • Current and Future Market Size Value (USD Million) Analysis and Forecast By Product Type, 2025 to 2035
      • Dietary Supplement
      • Functional Foods
      • Probiotics Fortified Foods
      • Omega fatty Acid Fortified Foods
      • Functional Beverages
      • Energy Drinks
      • Health Drinks
      • Fortified Juices
      • Protein Supplements
      • Vitamins And Minerals
      • Herbal Supplements
    • Y to o to Y Growth Trend Analysis By Product Type, 2020 to 2024
    • Absolute $ Opportunity Analysis By Product Type, 2025 to 2035
  8. Global Market Analysis 2020 to 2024 and Forecast 2025 to 2035, By Form
    • Introduction / Key Findings
    • Historical Market Size Value (USD Million) Analysis By Form, 2020 to 2024
    • Current and Future Market Size Value (USD Million) Analysis and Forecast By Form, 2025 to 2035
      • Capsules
      • Liquids
      • Tablets
      • Powder & Granule
    • Y to o to Y Growth Trend Analysis By Form, 2020 to 2024
    • Absolute $ Opportunity Analysis By Form, 2025 to 2035
  9. Global Market Analysis 2020 to 2024 and Forecast 2025 to 2035, By Sales Channel
    • Introduction / Key Findings
    • Historical Market Size Value (USD Million) Analysis By Sales Channel, 2020 to 2024
    • Current and Future Market Size Value (USD Million) Analysis and Forecast By Sales Channel, 2025 to 2035
      • Indirect Sales/B2C
      • On Direct Sales/B2B
      • Pharmacies/Drugstores
      • Modern Trade Channel
      • Online Retailing
    • Y to o to Y Growth Trend Analysis By Sales Channel, 2020 to 2024
    • Absolute $ Opportunity Analysis By Sales Channel, 2025 to 2035
  10. Global Market Analysis 2020 to 2024 and Forecast 2025 to 2035, By Region
    • Introduction
    • Historical Market Size Value (USD Million) Analysis By Region, 2020 to 2024
    • Current Market Size Value (USD Million) Analysis and Forecast By Region, 2025 to 2035
      • North America
      • Latin America
      • Western Europe
      • Eastern Europe
      • East Asia
      • South Asia and Pacific
      • Middle East & Africa
    • Market Attractiveness Analysis By Region
  11. North America Market Analysis 2020 to 2024 and Forecast 2025 to 2035, By Country
    • Historical Market Size Value (USD Million) Trend Analysis By Market Taxonomy, 2020 to 2024
    • Market Size Value (USD Million) Forecast By Market Taxonomy, 2025 to 2035
      • By Country
        • USA
        • Canada
        • Mexico
      • By Active Compounds
      • By Product Type
      • By Form
      • By Sales Channel
    • Market Attractiveness Analysis
      • By Country
      • By Active Compounds
      • By Product Type
      • By Form
      • By Sales Channel
    • Key Takeaways
  12. Latin America Market Analysis 2020 to 2024 and Forecast 2025 to 2035, By Country
    • Historical Market Size Value (USD Million) Trend Analysis By Market Taxonomy, 2020 to 2024
    • Market Size Value (USD Million) Forecast By Market Taxonomy, 2025 to 2035
      • By Country
        • Brazil
        • Chile
        • Rest of Latin America
      • By Active Compounds
      • By Product Type
      • By Form
      • By Sales Channel
    • Market Attractiveness Analysis
      • By Country
      • By Active Compounds
      • By Product Type
      • By Form
      • By Sales Channel
    • Key Takeaways
  13. Western Europe Market Analysis 2020 to 2024 and Forecast 2025 to 2035, By Country
    • Historical Market Size Value (USD Million) Trend Analysis By Market Taxonomy, 2020 to 2024
    • Market Size Value (USD Million) Forecast By Market Taxonomy, 2025 to 2035
      • By Country
        • Germany
        • UK
        • Italy
        • Spain
        • France
        • Nordic
        • BENELUX
        • Rest of Western Europe
      • By Active Compounds
      • By Product Type
      • By Form
      • By Sales Channel
    • Market Attractiveness Analysis
      • By Country
      • By Active Compounds
      • By Product Type
      • By Form
      • By Sales Channel
    • Key Takeaways
  14. Eastern Europe Market Analysis 2020 to 2024 and Forecast 2025 to 2035, By Country
    • Historical Market Size Value (USD Million) Trend Analysis By Market Taxonomy, 2020 to 2024
    • Market Size Value (USD Million) Forecast By Market Taxonomy, 2025 to 2035
      • By Country
        • Russia
        • Poland
        • Hungary
        • Balkan & Baltic
        • Rest of Eastern Europe
      • By Active Compounds
      • By Product Type
      • By Form
      • By Sales Channel
    • Market Attractiveness Analysis
      • By Country
      • By Active Compounds
      • By Product Type
      • By Form
      • By Sales Channel
    • Key Takeaways
  15. East Asia Market Analysis 2020 to 2024 and Forecast 2025 to 2035, By Country
    • Historical Market Size Value (USD Million) Trend Analysis By Market Taxonomy, 2020 to 2024
    • Market Size Value (USD Million) Forecast By Market Taxonomy, 2025 to 2035
      • By Country
        • China
        • Japan
        • South Korea
      • By Active Compounds
      • By Product Type
      • By Form
      • By Sales Channel
    • Market Attractiveness Analysis
      • By Country
      • By Active Compounds
      • By Product Type
      • By Form
      • By Sales Channel
    • Key Takeaways
  16. South Asia and Pacific Market Analysis 2020 to 2024 and Forecast 2025 to 2035, By Country
    • Historical Market Size Value (USD Million) Trend Analysis By Market Taxonomy, 2020 to 2024
    • Market Size Value (USD Million) Forecast By Market Taxonomy, 2025 to 2035
      • By Country
        • India
        • ASEAN
        • Australia & New Zealand
        • Rest of South Asia and Pacific
      • By Active Compounds
      • By Product Type
      • By Form
      • By Sales Channel
    • Market Attractiveness Analysis
      • By Country
      • By Active Compounds
      • By Product Type
      • By Form
      • By Sales Channel
    • Key Takeaways
  17. Middle East & Africa Market Analysis 2020 to 2024 and Forecast 2025 to 2035, By Country
    • Historical Market Size Value (USD Million) Trend Analysis By Market Taxonomy, 2020 to 2024
    • Market Size Value (USD Million) Forecast By Market Taxonomy, 2025 to 2035
      • By Country
        • Kingdom of Saudi Arabia
        • Other GCC Countries
        • Turkiye
        • South Africa
        • Other African Union
        • Rest of Middle East & Africa
      • By Active Compounds
      • By Product Type
      • By Form
      • By Sales Channel
    • Market Attractiveness Analysis
      • By Country
      • By Active Compounds
      • By Product Type
      • By Form
      • By Sales Channel
    • Key Takeaways
  18. Key Countries Market Analysis
    • USA
      • Pricing Analysis
      • Market Share Analysis, 2024
        • By Active Compounds
        • By Product Type
        • By Form
        • By Sales Channel
    • Canada
      • Pricing Analysis
      • Market Share Analysis, 2024
        • By Active Compounds
        • By Product Type
        • By Form
        • By Sales Channel
    • Mexico
      • Pricing Analysis
      • Market Share Analysis, 2024
        • By Active Compounds
        • By Product Type
        • By Form
        • By Sales Channel
    • Brazil
      • Pricing Analysis
      • Market Share Analysis, 2024
        • By Active Compounds
        • By Product Type
        • By Form
        • By Sales Channel
    • Chile
      • Pricing Analysis
      • Market Share Analysis, 2024
        • By Active Compounds
        • By Product Type
        • By Form
        • By Sales Channel
    • Germany
      • Pricing Analysis
      • Market Share Analysis, 2024
        • By Active Compounds
        • By Product Type
        • By Form
        • By Sales Channel
    • UK
      • Pricing Analysis
      • Market Share Analysis, 2024
        • By Active Compounds
        • By Product Type
        • By Form
        • By Sales Channel
    • Italy
      • Pricing Analysis
      • Market Share Analysis, 2024
        • By Active Compounds
        • By Product Type
        • By Form
        • By Sales Channel
    • Spain
      • Pricing Analysis
      • Market Share Analysis, 2024
        • By Active Compounds
        • By Product Type
        • By Form
        • By Sales Channel
    • France
      • Pricing Analysis
      • Market Share Analysis, 2024
        • By Active Compounds
        • By Product Type
        • By Form
        • By Sales Channel
    • India
      • Pricing Analysis
      • Market Share Analysis, 2024
        • By Active Compounds
        • By Product Type
        • By Form
        • By Sales Channel
    • ASEAN
      • Pricing Analysis
      • Market Share Analysis, 2024
        • By Active Compounds
        • By Product Type
        • By Form
        • By Sales Channel
    • Australia & New Zealand
      • Pricing Analysis
      • Market Share Analysis, 2024
        • By Active Compounds
        • By Product Type
        • By Form
        • By Sales Channel
    • China
      • Pricing Analysis
      • Market Share Analysis, 2024
        • By Active Compounds
        • By Product Type
        • By Form
        • By Sales Channel
    • Japan
      • Pricing Analysis
      • Market Share Analysis, 2024
        • By Active Compounds
        • By Product Type
        • By Form
        • By Sales Channel
    • South Korea
      • Pricing Analysis
      • Market Share Analysis, 2024
        • By Active Compounds
        • By Product Type
        • By Form
        • By Sales Channel
    • Russia
      • Pricing Analysis
      • Market Share Analysis, 2024
        • By Active Compounds
        • By Product Type
        • By Form
        • By Sales Channel
    • Poland
      • Pricing Analysis
      • Market Share Analysis, 2024
        • By Active Compounds
        • By Product Type
        • By Form
        • By Sales Channel
    • Hungary
      • Pricing Analysis
      • Market Share Analysis, 2024
        • By Active Compounds
        • By Product Type
        • By Form
        • By Sales Channel
    • Kingdom of Saudi Arabia
      • Pricing Analysis
      • Market Share Analysis, 2024
        • By Active Compounds
        • By Product Type
        • By Form
        • By Sales Channel
    • Turkiye
      • Pricing Analysis
      • Market Share Analysis, 2024
        • By Active Compounds
        • By Product Type
        • By Form
        • By Sales Channel
    • South Africa
      • Pricing Analysis
      • Market Share Analysis, 2024
        • By Active Compounds
        • By Product Type
        • By Form
        • By Sales Channel
  19. Market Structure Analysis
    • Competition Dashboard
    • Competition Benchmarking
    • Market Share Analysis of Top Players
      • By Regional
      • By Active Compounds
      • By Product Type
      • By Form
      • By Sales Channel
  20. Competition Analysis
    • Competition Deep Dive
      • Amway Corp.
        • Overview
        • Product Portfolio
        • Profitability by Market Segments (Product/Age /Sales Channel/Region)
        • Sales Footprint
        • Strategy Overview
          • Marketing Strategy
          • Product Strategy
          • Channel Strategy
      • Rousselot
      • Aditivos Group (KEMTIA)
      • GFR Pharma
      • General Mills Inc.
      • Standard Functional Foods Group Inc.
      • Abbott Laboratories
      • Roquette Kloetze
      • AlgaNovo International Co., Ltd
      • Yigeda Bio-Technology Co., Ltd
      • EID Parry
      • BASF
      • Natural Beta Technologies
      • Cyanotech
      • Mera Pharma
      • BioReal
  21. Assumptions & Acronyms Used
  22. Research Methodology

List of Tables

  • Table 1: Global Market Value (USD Million) Forecast by Region, 2020 to 2035
  • Table 2: Global Market Value (USD Million) Forecast by Active Compounds , 2020 to 2035
  • Table 3: Global Market Value (USD Million) Forecast by Product Type, 2020 to 2035
  • Table 4: Global Market Value (USD Million) Forecast by Form, 2020 to 2035
  • Table 5: Global Market Value (USD Million) Forecast by Sales Channel, 2020 to 2035
  • Table 6: North America Market Value (USD Million) Forecast by Country, 2020 to 2035
  • Table 7: North America Market Value (USD Million) Forecast by Active Compounds , 2020 to 2035
  • Table 8: North America Market Value (USD Million) Forecast by Product Type, 2020 to 2035
  • Table 9: North America Market Value (USD Million) Forecast by Form, 2020 to 2035
  • Table 10: North America Market Value (USD Million) Forecast by Sales Channel, 2020 to 2035
  • Table 11: Latin America Market Value (USD Million) Forecast by Country, 2020 to 2035
  • Table 12: Latin America Market Value (USD Million) Forecast by Active Compounds , 2020 to 2035
  • Table 13: Latin America Market Value (USD Million) Forecast by Product Type, 2020 to 2035
  • Table 14: Latin America Market Value (USD Million) Forecast by Form, 2020 to 2035
  • Table 15: Latin America Market Value (USD Million) Forecast by Sales Channel, 2020 to 2035
  • Table 16: Western Europe Market Value (USD Million) Forecast by Country, 2020 to 2035
  • Table 17: Western Europe Market Value (USD Million) Forecast by Active Compounds , 2020 to 2035
  • Table 18: Western Europe Market Value (USD Million) Forecast by Product Type, 2020 to 2035
  • Table 19: Western Europe Market Value (USD Million) Forecast by Form, 2020 to 2035
  • Table 20: Western Europe Market Value (USD Million) Forecast by Sales Channel, 2020 to 2035
  • Table 21: Eastern Europe Market Value (USD Million) Forecast by Country, 2020 to 2035
  • Table 22: Eastern Europe Market Value (USD Million) Forecast by Active Compounds , 2020 to 2035
  • Table 23: Eastern Europe Market Value (USD Million) Forecast by Product Type, 2020 to 2035
  • Table 24: Eastern Europe Market Value (USD Million) Forecast by Form, 2020 to 2035
  • Table 25: Eastern Europe Market Value (USD Million) Forecast by Sales Channel, 2020 to 2035
  • Table 26: East Asia Market Value (USD Million) Forecast by Country, 2020 to 2035
  • Table 27: East Asia Market Value (USD Million) Forecast by Active Compounds , 2020 to 2035
  • Table 28: East Asia Market Value (USD Million) Forecast by Product Type, 2020 to 2035
  • Table 29: East Asia Market Value (USD Million) Forecast by Form, 2020 to 2035
  • Table 30: East Asia Market Value (USD Million) Forecast by Sales Channel, 2020 to 2035
  • Table 31: South Asia and Pacific Market Value (USD Million) Forecast by Country, 2020 to 2035
  • Table 32: South Asia and Pacific Market Value (USD Million) Forecast by Active Compounds , 2020 to 2035
  • Table 33: South Asia and Pacific Market Value (USD Million) Forecast by Product Type, 2020 to 2035
  • Table 34: South Asia and Pacific Market Value (USD Million) Forecast by Form, 2020 to 2035
  • Table 35: South Asia and Pacific Market Value (USD Million) Forecast by Sales Channel, 2020 to 2035
  • Table 36: Middle East & Africa Market Value (USD Million) Forecast by Country, 2020 to 2035
  • Table 37: Middle East & Africa Market Value (USD Million) Forecast by Active Compounds , 2020 to 2035
  • Table 38: Middle East & Africa Market Value (USD Million) Forecast by Product Type, 2020 to 2035
  • Table 39: Middle East & Africa Market Value (USD Million) Forecast by Form, 2020 to 2035
  • Table 40: Middle East & Africa Market Value (USD Million) Forecast by Sales Channel, 2020 to 2035

List of Figures

  • Figure 1: Global Market Pricing Analysis
  • Figure 2: Global Market Value (USD Million) Forecast 2020-2035
  • Figure 3: Global Market Value Share and BPS Analysis by Active Compounds , 2025 and 2035
  • Figure 4: Global Market Y to o to Y Growth Comparison by Active Compounds , 2025-2035
  • Figure 5: Global Market Attractiveness Analysis by Active Compounds
  • Figure 6: Global Market Value Share and BPS Analysis by Product Type, 2025 and 2035
  • Figure 7: Global Market Y to o to Y Growth Comparison by Product Type, 2025-2035
  • Figure 8: Global Market Attractiveness Analysis by Product Type
  • Figure 9: Global Market Value Share and BPS Analysis by Form, 2025 and 2035
  • Figure 10: Global Market Y to o to Y Growth Comparison by Form, 2025-2035
  • Figure 11: Global Market Attractiveness Analysis by Form
  • Figure 12: Global Market Value Share and BPS Analysis by Sales Channel, 2025 and 2035
  • Figure 13: Global Market Y to o to Y Growth Comparison by Sales Channel, 2025-2035
  • Figure 14: Global Market Attractiveness Analysis by Sales Channel
  • Figure 15: Global Market Value (USD Million) Share and BPS Analysis by Region, 2025 and 2035
  • Figure 16: Global Market Y to o to Y Growth Comparison by Region, 2025-2035
  • Figure 17: Global Market Attractiveness Analysis by Region
  • Figure 18: North America Market Incremental Dollar Opportunity, 2025-2035
  • Figure 19: Latin America Market Incremental Dollar Opportunity, 2025-2035
  • Figure 20: Western Europe Market Incremental Dollar Opportunity, 2025-2035
  • Figure 21: Eastern Europe Market Incremental Dollar Opportunity, 2025-2035
  • Figure 22: East Asia Market Incremental Dollar Opportunity, 2025-2035
  • Figure 23: South Asia and Pacific Market Incremental Dollar Opportunity, 2025-2035
  • Figure 24: Middle East & Africa Market Incremental Dollar Opportunity, 2025-2035
  • Figure 25: North America Market Value Share and BPS Analysis by Country, 2025 and 2035
  • Figure 26: North America Market Value Share and BPS Analysis by Active Compounds , 2025 and 2035
  • Figure 27: North America Market Y to o to Y Growth Comparison by Active Compounds , 2025-2035
  • Figure 28: North America Market Attractiveness Analysis by Active Compounds
  • Figure 29: North America Market Value Share and BPS Analysis by Product Type, 2025 and 2035
  • Figure 30: North America Market Y to o to Y Growth Comparison by Product Type, 2025-2035
  • Figure 31: North America Market Attractiveness Analysis by Product Type
  • Figure 32: North America Market Value Share and BPS Analysis by Form, 2025 and 2035
  • Figure 33: North America Market Y to o to Y Growth Comparison by Form, 2025-2035
  • Figure 34: North America Market Attractiveness Analysis by Form
  • Figure 35: North America Market Value Share and BPS Analysis by Sales Channel, 2025 and 2035
  • Figure 36: North America Market Y to o to Y Growth Comparison by Sales Channel, 2025-2035
  • Figure 37: North America Market Attractiveness Analysis by Sales Channel
  • Figure 38: Latin America Market Value Share and BPS Analysis by Country, 2025 and 2035
  • Figure 39: Latin America Market Value Share and BPS Analysis by Active Compounds , 2025 and 2035
  • Figure 40: Latin America Market Y to o to Y Growth Comparison by Active Compounds , 2025-2035
  • Figure 41: Latin America Market Attractiveness Analysis by Active Compounds
  • Figure 42: Latin America Market Value Share and BPS Analysis by Product Type, 2025 and 2035
  • Figure 43: Latin America Market Y to o to Y Growth Comparison by Product Type, 2025-2035
  • Figure 44: Latin America Market Attractiveness Analysis by Product Type
  • Figure 45: Latin America Market Value Share and BPS Analysis by Form, 2025 and 2035
  • Figure 46: Latin America Market Y to o to Y Growth Comparison by Form, 2025-2035
  • Figure 47: Latin America Market Attractiveness Analysis by Form
  • Figure 48: Latin America Market Value Share and BPS Analysis by Sales Channel, 2025 and 2035
  • Figure 49: Latin America Market Y to o to Y Growth Comparison by Sales Channel, 2025-2035
  • Figure 50: Latin America Market Attractiveness Analysis by Sales Channel
  • Figure 51: Western Europe Market Value Share and BPS Analysis by Country, 2025 and 2035
  • Figure 52: Western Europe Market Value Share and BPS Analysis by Active Compounds , 2025 and 2035
  • Figure 53: Western Europe Market Y to o to Y Growth Comparison by Active Compounds , 2025-2035
  • Figure 54: Western Europe Market Attractiveness Analysis by Active Compounds
  • Figure 55: Western Europe Market Value Share and BPS Analysis by Product Type, 2025 and 2035
  • Figure 56: Western Europe Market Y to o to Y Growth Comparison by Product Type, 2025-2035
  • Figure 57: Western Europe Market Attractiveness Analysis by Product Type
  • Figure 58: Western Europe Market Value Share and BPS Analysis by Form, 2025 and 2035
  • Figure 59: Western Europe Market Y to o to Y Growth Comparison by Form, 2025-2035
  • Figure 60: Western Europe Market Attractiveness Analysis by Form
  • Figure 61: Western Europe Market Value Share and BPS Analysis by Sales Channel, 2025 and 2035
  • Figure 62: Western Europe Market Y to o to Y Growth Comparison by Sales Channel, 2025-2035
  • Figure 63: Western Europe Market Attractiveness Analysis by Sales Channel
  • Figure 64: Eastern Europe Market Value Share and BPS Analysis by Country, 2025 and 2035
  • Figure 65: Eastern Europe Market Value Share and BPS Analysis by Active Compounds , 2025 and 2035
  • Figure 66: Eastern Europe Market Y to o to Y Growth Comparison by Active Compounds , 2025-2035
  • Figure 67: Eastern Europe Market Attractiveness Analysis by Active Compounds
  • Figure 68: Eastern Europe Market Value Share and BPS Analysis by Product Type, 2025 and 2035
  • Figure 69: Eastern Europe Market Y to o to Y Growth Comparison by Product Type, 2025-2035
  • Figure 70: Eastern Europe Market Attractiveness Analysis by Product Type
  • Figure 71: Eastern Europe Market Value Share and BPS Analysis by Form, 2025 and 2035
  • Figure 72: Eastern Europe Market Y to o to Y Growth Comparison by Form, 2025-2035
  • Figure 73: Eastern Europe Market Attractiveness Analysis by Form
  • Figure 74: Eastern Europe Market Value Share and BPS Analysis by Sales Channel, 2025 and 2035
  • Figure 75: Eastern Europe Market Y to o to Y Growth Comparison by Sales Channel, 2025-2035
  • Figure 76: Eastern Europe Market Attractiveness Analysis by Sales Channel
  • Figure 77: East Asia Market Value Share and BPS Analysis by Country, 2025 and 2035
  • Figure 78: East Asia Market Value Share and BPS Analysis by Active Compounds , 2025 and 2035
  • Figure 79: East Asia Market Y to o to Y Growth Comparison by Active Compounds , 2025-2035
  • Figure 80: East Asia Market Attractiveness Analysis by Active Compounds
  • Figure 81: East Asia Market Value Share and BPS Analysis by Product Type, 2025 and 2035
  • Figure 82: East Asia Market Y to o to Y Growth Comparison by Product Type, 2025-2035
  • Figure 83: East Asia Market Attractiveness Analysis by Product Type
  • Figure 84: East Asia Market Value Share and BPS Analysis by Form, 2025 and 2035
  • Figure 85: East Asia Market Y to o to Y Growth Comparison by Form, 2025-2035
  • Figure 86: East Asia Market Attractiveness Analysis by Form
  • Figure 87: East Asia Market Value Share and BPS Analysis by Sales Channel, 2025 and 2035
  • Figure 88: East Asia Market Y to o to Y Growth Comparison by Sales Channel, 2025-2035
  • Figure 89: East Asia Market Attractiveness Analysis by Sales Channel
  • Figure 90: South Asia and Pacific Market Value Share and BPS Analysis by Country, 2025 and 2035
  • Figure 91: South Asia and Pacific Market Value Share and BPS Analysis by Active Compounds , 2025 and 2035
  • Figure 92: South Asia and Pacific Market Y to o to Y Growth Comparison by Active Compounds , 2025-2035
  • Figure 93: South Asia and Pacific Market Attractiveness Analysis by Active Compounds
  • Figure 94: South Asia and Pacific Market Value Share and BPS Analysis by Product Type, 2025 and 2035
  • Figure 95: South Asia and Pacific Market Y to o to Y Growth Comparison by Product Type, 2025-2035
  • Figure 96: South Asia and Pacific Market Attractiveness Analysis by Product Type
  • Figure 97: South Asia and Pacific Market Value Share and BPS Analysis by Form, 2025 and 2035
  • Figure 98: South Asia and Pacific Market Y to o to Y Growth Comparison by Form, 2025-2035
  • Figure 99: South Asia and Pacific Market Attractiveness Analysis by Form
  • Figure 100: South Asia and Pacific Market Value Share and BPS Analysis by Sales Channel, 2025 and 2035
  • Figure 101: South Asia and Pacific Market Y to o to Y Growth Comparison by Sales Channel, 2025-2035
  • Figure 102: South Asia and Pacific Market Attractiveness Analysis by Sales Channel
  • Figure 103: Middle East & Africa Market Value Share and BPS Analysis by Country, 2025 and 2035
  • Figure 104: Middle East & Africa Market Value Share and BPS Analysis by Active Compounds , 2025 and 2035
  • Figure 105: Middle East & Africa Market Y to o to Y Growth Comparison by Active Compounds , 2025-2035
  • Figure 106: Middle East & Africa Market Attractiveness Analysis by Active Compounds
  • Figure 107: Middle East & Africa Market Value Share and BPS Analysis by Product Type, 2025 and 2035
  • Figure 108: Middle East & Africa Market Y to o to Y Growth Comparison by Product Type, 2025-2035
  • Figure 109: Middle East & Africa Market Attractiveness Analysis by Product Type
  • Figure 110: Middle East & Africa Market Value Share and BPS Analysis by Form, 2025 and 2035
  • Figure 111: Middle East & Africa Market Y to o to Y Growth Comparison by Form, 2025-2035
  • Figure 112: Middle East & Africa Market Attractiveness Analysis by Form
  • Figure 113: Middle East & Africa Market Value Share and BPS Analysis by Sales Channel, 2025 and 2035
  • Figure 114: Middle East & Africa Market Y to o to Y Growth Comparison by Sales Channel, 2025-2035
  • Figure 115: Middle East & Africa Market Attractiveness Analysis by Sales Channel
  • Figure 116: Global Market - Tier Structure Analysis
  • Figure 117: Global Market - Company Share Analysis
Dashboard
Dashboard
Dashboard
Dashboard
Dashboard
Dashboard

Full Research Suite comprises of:

Market outlook & trends analysis

Market outlook & trends analysis

Interviews & case studies

Interviews & case studies

Strategic recommendations

Strategic recommendations

Vendor profiles & capabilities analysis

Vendor profiles & capabilities analysis

5-year forecasts

5-year forecasts

8 regions and 60+ country-level data splits

8 regions and 60+ country-level data splits

Market segment data splits

Market segment data splits

12 months of continuous data updates

12 months of continuous data updates

DELIVERED AS:

PDF EXCEL ONLINE

Full Research Suite


$3500

$5000

$6500

Buy Report Now
Similar Industry Reports

Similar Industry Reports

Marine Power Battery System Market

Marine Power Battery System Market Size and Share Forecast Outlook 2025 to 2035

Marine Life Raft Market

Marine Life Raft Market Size and Share Forecast Outlook 2025 to 2035

Marine Trenchers Market

Marine Trenchers Market Size and Share Forecast Outlook 2025 to 2035

Marine Electronics Tester Market

Marine Electronics Tester Market Size and Share Forecast Outlook 2025 to 2035

Marine Steering Systems Market

Marine Steering Systems Market Size and Share Forecast Outlook 2025 to 2035

Marine & Dock Gangways Market

Marine & Dock Gangways Market Size and Share Forecast Outlook 2025 to 2035

Marine HVAC System Market

Marine HVAC System Market Size and Share Forecast Outlook 2025 to 2035

Marine Outboard Engines Market

Marine Outboard Engines Market Size and Share Forecast Outlook 2025 to 2035

Marine Stabilizers Market

Marine Stabilizers Market Size and Share Forecast Outlook 2025 to 2035

Marine Fuel Injection System Market

Marine Fuel Injection System Market Size and Share Forecast Outlook 2025 to 2035

Marine Energy Market

Marine Energy Market Size and Share Forecast Outlook 2025 to 2035

Marine Propulsion Engine Market

Marine Propulsion Engine Market Size and Share Forecast Outlook 2025 to 2035

Marine Protein Hydrolysate Market

Marine Protein Hydrolysate Market Size and Share Forecast Outlook 2025 to 2035

Marine Fin Stabilizer Market

Marine Fin Stabilizer Market Size and Share Forecast Outlook 2025 to 2035

Marine Extract Market

Marine Extract Market Size and Share Forecast Outlook 2025 to 2035

Marine Squalene Alternatives Market

Marine Squalene Alternatives Market Size and Share Forecast Outlook 2025 to 2035

Marine Prebiotics Market

Marine Prebiotics Market Size and Share Forecast Outlook 2025 to 2035

Marine Collagen-Based Products Market

Marine Collagen-Based Products Market Analysis - Size, Share, and Forecast Outlook 2025 to 2035

Marine Communication Market

Marine Communication Market Size and Share Forecast Outlook 2025 to 2035

Marine Derived Proteins Market

Marine Derived Proteins Market Size and Share Forecast Outlook 2025 to 2035

Future Market Insights

Marine Nutraceutical Market

Chat With MaRIA

Chat With

MaRIA

Hi There, I am MaRIA, Your Market Research Intelligence Assistant. How may I help you?