Reports
- Global Locations -
Headquarters
Future Market Insights, Inc.
Christiana Corporate, 200
Continental Drive, Suite 401,
Newark, Delaware - 19713,
United States
Americas
Future Market Insights, Inc.
616 Corporate Way, Suite 2-9018,
Valley Cottage, NY 10989, United States
MEA
Future Market Insights
1602-6 Jumeirah Bay X2 Tower, Plot No: JLT-PH2-X2A,
Jumeirah Lakes Towers, Dubai,
United Arab Emirates
Europe
Future Market Insights
3rd Floor, 207 Regent Street,
W1B 3HH London
United Kingdom
Asia Pacific
Future Market Insights
Office No. 401-A, 4th Floor,
VANTAGE 9, S.No. 36/1/1,
Baner, Pune 411045, India
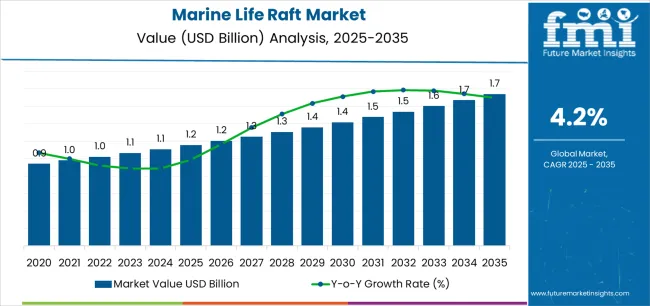
[240 Pages Report] The marine life raft market is projected to reach a valuation of US$ 1 Bn in 2022. With sales growing at a 4.4% CAGR, the market size is projected to surpass US$ 1.5 Bn by 2032. Demand for marine life rafts used for commercial purposes will account for approximately 51.6% of the total market share.
Marine Life Raft Market Base Year Size (2021A) | US$ 985.0 million |
---|---|
Projected Market Valuation (2032F) | US$ 1.5 billion |
Value-based CAGR (2022-2032) | 4.4 % |
Collective Value Share: Top 3 Countries (2021A) | 35.5% |
Don't pay for what you don't need
Customize your report by selecting specific countries or regions and save 30%!
Demand for marine life rafts is projected to grow at a 4.4% CAGR, in comparison with the 2.1% CAGR registered between 2017 and 2021. France, Italy, the U.S. Mexico, and India are expected to account for a significant share of the global marine life raft market.
Criminal activities on water bodies such as rivers and seas have prompted an increase in the deployment of police rafts for patrolling, with a primary focus on harbors. Rigid inflatable rafts' fast, robust, light, and durable nature makes them suitable for many operations in the maritime sector. The urgent need to reduce illegal activities, as well as their design and function, makes them appealing to consumers.
Over the forecast period, the marine life raft market is expected to grow at a healthy rate. Rising popularity of rafting and other water-related leisure activities among millennials and young adults will boost sales of inflatable rafts.
Manufacturers are expanding their footprints globally in order to reach a larger customer base and offer products to a broader market. In addition, ongoing efforts are being made to improve the cost and performance parameters for various applications. Special materials, such as Polyurethane or Hypalon, are used to create products that are more durable, stable, and of high quality.
Market players are focusing on their product portfolio and are providing application-based custom-made marine rafts to gain a competitive advantage. They are also launching marine rafts that reduce the operational and maintenance costs.
Marine life raft manufacturers are expanding their distribution and supply networks in order to reach a wider range of consumers. They are collaborating with distributors, allied industries, governing bodies, and service providers to expand their global footprint.
The total number of ships ordered across all modes of sea travel, particularly ocean cruise ships, will increase. As a result, the expansion of the cruise industry, strict regulations, and raft certifications will drive demand for marine life rafts during the forecast period.
Increasing number of maritime accidents due to bad weather conditions or negligence on part of skippers is expected to spur demand for protective equipment such as marine rafts. These rafts are used to quickly evacuate passengers and crew members, making them an indispensable part of any modern cruise ship.
Global rural population migration is expected to increase, prompting the construction of man-made lakes and ponds for water sports and other recreational activities. The marine life raft market is expected to benefit from this trend.
Marine life rafts comply with the relevant sections of the International Sailing Federation (ISAF) offshore special regulations. Key points that are considered in ISAF life raft specifications are construction materials, design features, and equipment provisioning. The manufacturers' main goal in developing the ISO standard life raft specification is to bring all of the EU's life raft regulations into line with a single standard and eliminate any confusion.
“Increasing Expenditure on Leisure Activities Will Boost Sales of Customized Personal Rafts”
Total sales in the U.S. marine life raft market are expected to reach a valuation of US$ 164.4 Mn in 2022. Factors such as the availability of customized rafts for a variety of activities (onshore and offshore) and the rafts' competitive pricing are fueling sales of recreational rafts.
Due to growing preference leisure rafting and water sports, the marine life raft market in the U.S. is expected to account for a dominant share in the global market. High demand for rafts with high-speed motors and other features, as well as increasing deployment of marine rafts for patrolling is expected to push sales in the market in the forthcoming years.
“Trend of Using Rivers and Inland Water Ways for Commercial Activities to Propel Marine Life Raft Sales”
China is considered to be one of the most profitable markets for marine life raft manufacturers and suppliers. As per FMI, the China marine life market is projected to create an absolute incremental opportunity of more than US$ 67.8 Mn during the forecast period. The ongoing trend of using rivers and other water channels for commercial and recreational purposes is expected to bolster sales.
The market for marine life rafts in the China is anticipated for a healthy growth in the forecast period due to growing marine industry and transportation owing to improvements in the maritime cargo industry.
Get the data you need at a Fraction of the cost
Personalize your report by choosing insights you need
and save 40%!
“Demand for Inflatable (Flexible) Marine Life Rafts Will Gain Momentum”
The inflatable (flexible) segment is expected to be valued at US$ 148.4 Mn between 2022 and 2032. These rafts are more stable, but are slower as well, especially with larger rafts. When removing the raft from the water, it is best to wait for the water to drain so that the raft is lighter to carry.
Other critical factors that are expected to bode well for the segment in the coming years include increasing reliance on their capability and the easy availability of inflatable marine life rafts with numerous advanced features.
“Sales of Marine Life Rafts for Commercial Purposes Will Remain High”
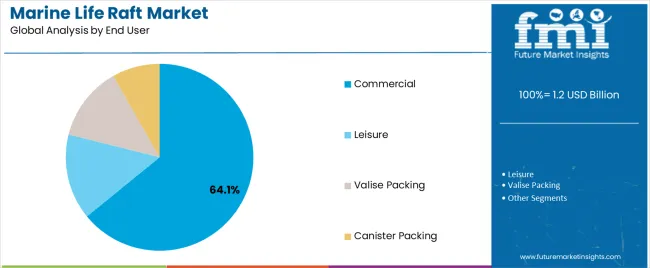
By end use, the commercial segment is expected to account for nearly 51.6% of the total marine life raft market share in 2022. Surging demand for security purpose, fishing and transportation is set to propel sales of these rafts over the evaluation period.
“Manufacturers are Developing New Solutions for increasing rafts stability”
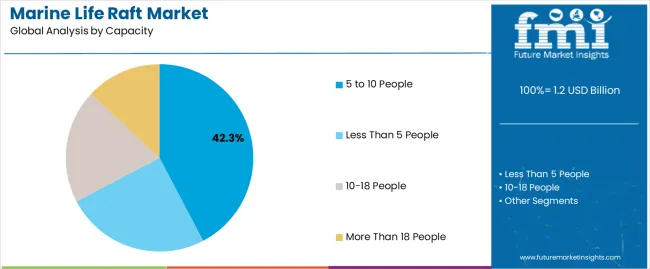
In terms of capacity type, rafts holding 10-18 people segment is expected to procure more than 27.1% of the marine life raft market share by the end of 2032. This growth is attributable to the growing commercial activities near water bodies.
The high number of visits to coastal regions create opportunities for manufacturers to expand their business. Maritime and coastal tourism, including recreational rafting, is anticipated to augment the growth in the marine life raft market.
The global marine life raft market is gaining momentum with the presence of several big, medium, and small-scale system developers, manufacturers, and service providers. Many automakers are increasingly integrating novel technologies in their vehicles to gain new opportunities in the global market.
Attribute | Details |
---|---|
Estimated Market Size (2022) | US$ 1 billion |
Projected Market Valuation (2032) | US$ 1.5 billion |
Value-based CAGR (2022-2032) | 4.4% |
Forecast Period | 2022-2032 |
Historical Data Available for | 2017-2021 |
Report Coverage | Market Forecast, brand share analysis, competition intelligence, DROT analysis, Market Dynamics and Challenges, Strategic Growth Initiatives |
Market Analysis | US$ Million for Value and Units for Volume |
Key Market Segments Covered | By Product Type Rigid
|
Key Regions Covered |
|
Key Companies Profiled |
|
1. Executive Summary 1.1. Global Market Outlook 1.2. Demand Side Trends 1.3. Supply Side Trends 1.4. Analysis and Recommendations 2. Market Overview 2.1. Market Coverage / Taxonomy 2.2. Market Definition / Scope / Limitations 3. Key Market Trends 3.1. Key Trends Impacting the Market 3.2. Innovation / Development Trends 4. Key Success Factors 4.1. Product Adoption / Usage Analysis 4.2. Product USPs / Features 4.3. Strategic Promotional Strategies 5. Global Marine Life Raf Market Demand Analysis 2017-2021 and Forecast, 2022-2032 5.1. Historical Market Volume (‘000 Units) Analysis, 2017-2021 5.2. Current and Future Market Volume (‘000 Units) Projections, 2022-2032 5.3. Y-o-Y Growth Trend Analysis 6. Global Marine Life Raf Market - Pricing Analysis 6.1. Regional Pricing Analysis 6.2. Global Average Pricing Analysis Benchmark 7. Global Marine Life Raf Market Demand (in Value or Size in US$ Mn) Analysis 2017-2021 and Forecast, 2022-2032 7.1. Historical Market Value (US$ Mn) Analysis, 2017-2021 7.2. Current and Future Market Value (US$ Mn) Projections, 2022-2032 7.2.1. Y-o-Y Growth Trend Analysis 7.2.2. Absolute $ Opportunity Analysis 8. Market Background 8.1. Macro-Economic Factors 8.1.1. Global GDP Growth Outlook 8.1.2. Global Coastal Tourism Overview 8.1.3. Global Port Infrastructure Outlook 8.2. Forecast Factors - Relevance & Impact 8.3. Value Chain 8.4. Impact of COVID – 19 Crisis 8.4.1. Current Statistics 8.4.2. Short-Mid-Long Term Outlook 8.4.3. Likely Rebound 8.5. Market Dynamics 8.5.1. Drivers 8.5.2. Restraints 8.5.3. Opportunity Analysis 9. Global Marine Life Raf Market Analysis 2017-2021 and Forecast 2022-2032, by Product Type 9.1. Introduction / Key Findings 9.2. Historical Market Size (US$ Mn) and Volume Analysis By Product Type, 2017 - 2021 9.3. Current and Future Market Size (US$ Mn) and Volume Analysis and Forecast By Product Type, 2022 - 2032 9.3.1. Rigid 9.3.2. Inflatable (Flexible) 9.3.2.1. Single Tube Life Raft 9.3.2.2. Multi tube Life Raft 9.4. Market Attractiveness Analyses, By Product Type 10. Global Marine Life Raf Market Analysis 2017-2021 and Forecast 2022-2032, By End Use 10.1. Introduction / Key Findings 10.2. Historical Market Size (US$ Mn) and Volume Analysis By End use, 2017 - 2021 10.3. Current and Future Market Size (US$ Mn) and Volume Analysis and Forecast By End Use, 2022 - 2032 10.3.1. Leisure 10.3.1.1. Valise Packing 10.3.1.2. Canister Packing 10.3.2. Commercial 10.3.2.1. Valise Packing 10.3.2.2. Canister Packing 10.4. Market Attractiveness Analysis By End Use 11. Global Marine Life Raf Market Analysis 2017-2021 and Forecast 2022-2032, By Capacity 11.1. Introduction / Key Findings 11.2. Historical Market Size (US$ Mn) and Volume Analysis By Capacity, 2017 - 2021 11.3. Current and Future Market Size (US$ Mn) and Volume Analysis and Forecast By Capacity, 2022 - 2032 11.3.1. Less than 5 persons 11.3.2. 5 to 10 persons 11.3.3. 10 to 18 persons 11.3.4. More than 18 persons 11.4. Market Attractiveness Analysis By Capacity 12. Global Marine Life Raf Market Analysis 2017-2021 and Forecast 2022-2032, by Region 12.1. Introduction 12.2. Historical Market Size (US$ Mn) and Volume Analysis By Region, 2017 - 2021 12.3. Current Market Size (US$ Mn) and Volume Analysis and Forecast By Region, 2022 - 2032 12.3.1. North America 12.3.2. Latin America 12.3.3. Europe 12.3.4. East Asia 12.3.5. South Asia & Pacific 12.3.6. Middle East & Africa 12.4. Market Attractiveness Analysis By Region 13. North America Global Marine Life Raf Market Analysis 2017-2021 and Forecast 2022-2032 13.1. Introduction 13.2. Pricing Analysis 13.3. Historical Market Size (US$ Mn) and Volume Trend Analysis By Market Taxonomy, 2017 - 2021 13.4. Market Size (US$ Mn) and Volume Forecast By Market Taxonomy, 2022 - 2032 13.4.1. By Product Type 13.4.2. By End Use 13.4.3. By Capacity 13.4.4. By Country 13.4.4.1. U.S. 13.4.4.2. Canada 13.5. Market Attractiveness Analysis 13.5.1. By Product Type 13.5.2. By End Use 13.5.3. By Capacity 13.5.4. By Country 13.6. Market Trends 13.7. Drivers and Restraints Impact Analysis 14. Latin America Global Marine Life Raf Market Analysis 2017-2021 and Forecast 2022-2032 14.1. Introduction 14.2. Pricing Analysis 14.3. Historical Market Size (US$ Mn) and Volume Trend Analysis By Market Taxonomy, 2017 - 2021 14.4. Market Size (US$ Mn) and Volume Forecast By Market Taxonomy, 2022 - 2032 14.4.1. By Product Type 14.4.2. By End Use 14.4.3. By Capacity 14.4.4. By Country 14.4.4.1. Brazil 14.4.4.2. Mexico 14.4.4.3. Rest of Latin America 14.5. Market Attractiveness Analysis 14.5.1. By Product Type 14.5.2. By End Use 14.5.3. By Capacity 14.5.4. By Country 14.6. Market Trends 14.7. Drivers and Restraints Impact Analysis 15. Europe Global Marine Life Raf Market Analysis 2017-2021 and Forecast 2022-2032 15.1. Introduction 15.2. Pricing Analysis 15.3. Historical Market Size (US$ Mn) and Volume Trend Analysis By Market Taxonomy, 2017 - 2021 15.4. Market Size (US$ Mn) and Volume Forecast By Market Taxonomy, 2022 - 2032 15.4.1. By Product Type 15.4.2. By End Use 15.4.3. By Capacity 15.4.4. By Country 15.4.4.1. Germany 15.4.4.2. Italy 15.4.4.3. France 15.4.4.4. U.K. 15.4.4.5. Spain 15.4.4.6. BENELUX 15.4.4.7. Russia 15.4.4.8. Rest of Europe 15.5. Market Attractiveness Analysis 15.5.1. By Product Type 15.5.2. By End Use 15.5.3. By Capacity 15.5.4. By Country 15.6. Market Trends 15.7. Drivers and Restraints Impact Analysis 16. East Asia Global Marine Life Raf Market Analysis 2017-2021 and Forecast 2022-2032 16.1. Introduction 16.2. Pricing Analysis 16.3. Historical Market Size (US$ Mn) and Volume Trend Analysis By Market Taxonomy, 2017 - 2021 16.4. Market Size (US$ Mn) and Volume Forecast By Market Taxonomy, 2022 - 2032 16.4.1. By Product Type 16.4.2. By End Use 16.4.3. By Capacity 16.4.4. By Country 16.4.4.1. China 16.4.4.2. Japan 16.4.4.3. South Korea 16.5. Market Attractiveness Analysis 16.5.1. By Product Type 16.5.2. By End Use 16.5.3. By Capacity 16.5.4. By Country 16.6. Market Trends 16.7. Drivers and Restraints Impact Analysis 17. South Asia & Pacific Global Marine Life Raf Market Analysis 2017-2021 and Forecast 2022-2032 17.1. Introduction 17.2. Pricing Analysis 17.3. Historical Market Size (US$ Mn) and Volume Trend Analysis By Market Taxonomy, 2017 - 2021 17.4. Market Size (US$ Mn) and Volume Forecast By Market Taxonomy, 2022 - 2032 17.4.1. By Product Type 17.4.2. By End Use 17.4.3. By Capacity 17.4.4. By Country 17.4.4.1. India 17.4.4.2. ASEAN 17.4.4.3. ANZ 17.4.4.4. Rest of South Asia & Pacific 17.5. Market Attractiveness Analysis 17.5.1. By Product Type 17.5.2. By End Use 17.5.3. By Capacity 17.5.4. By Country 17.6. Market Trends 17.7. Drivers and Restraints Impact Analysis 18. Middle East and Africa Global Marine Life Raf Market Analysis 2017-2021 and Forecast 2022-2032 18.1. Introduction 18.2. Pricing Analysis 18.3. Historical Market Size (US$ Mn) and Volume Trend Analysis By Market Taxonomy, 2017 - 2021 18.4. Market Size (US$ Mn) and Volume Forecast By Market Taxonomy, 2022 - 2032 18.4.1. By Product Type 18.4.2. By End Use 18.4.3. By Capacity 18.4.4. By Country 18.4.4.1. GCC Countries 18.4.4.2. Turkey 18.4.4.3. Northern Africa 18.4.4.4. South Africa 18.4.4.5. Rest of Middle East and Africa 18.5. Market Attractiveness Analysis 18.5.1. By Product Type 18.5.2. By End Use 18.5.3. By Capacity 18.5.4. By Country By Country 18.6. Market Trends 18.7. Drivers and Restraints Impact Analysis 19. Key and Emerging Countries Global Marine Life Raf Market Analysis 19.1. U.S. Global Marine Life Raf Market Analysis 19.1.1. By Product Type 19.1.2. By End Use 19.1.3. By Capacity 19.1.4. By Country 19.2. Canada Global Marine Life Raf Market Analysis 19.2.1. By Product Type 19.2.2. By End Use 19.2.3. By Capacity 19.2.4. By Country 19.3. Mexico Global Marine Life Raf Market Analysis 19.3.1. By Product Type 19.3.2. By End Use 19.3.3. By Capacity 19.3.4. By Country 19.4. Brazil Global Marine Life Raf Market Analysis 19.4.1. By Product Type 19.4.2. By End Use 19.4.3. By Capacity 19.4.4. By Country 19.5. Germany Global Marine Life Raf Market Analysis 19.5.1. By Product Type 19.5.2. By End Use 19.5.3. By Capacity 19.5.4. By Country 19.6. Italy Global Marine Life Raf Market Analysis 19.6.1. By Product Type 19.6.2. By End Use 19.6.3. By Capacity 19.6.4. By Country 19.7. France Global Marine Life Raf Market Analysis 19.7.1. By Product Type 19.7.2. By End Use 19.7.3. By Capacity 19.7.4. By Country 19.8. U.K. Global Marine Life Raf Market Analysis 19.8.1. By Product Type 19.8.2. By End Use 19.8.3. By Capacity 19.8.4. By Country 19.9. Spain Global Marine Life Raf Market Analysis 19.9.1. By Product Type 19.9.2. By End Use 19.9.3. By Capacity 19.9.4. By Country 19.10. Russia Global Marine Life Raf Market Analysis 19.10.1. By Product Type 19.10.2. By End Use 19.10.3. By Capacity 19.10.4. By Country 19.11. China Global Marine Life Raf Market Analysis 19.11.1. By Product Type 19.11.2. By End Use 19.11.3. By Capacity 19.11.4. By Country 19.12. Japan Global Marine Life Raf Market Analysis 19.12.1. By Product Type 19.12.2. By End Use 19.12.3. By Capacity 19.12.4. By Country 19.13. South Korea Global Marine Life Raf Market Analysis 19.13.1. By Product Type 19.13.2. By End Use 19.13.3. By Capacity 19.13.4. By Country 19.14. India Global Marine Life Raf Market Analysis 19.14.1. By Product Type 19.14.2. By End Use 19.14.3. By Capacity 19.14.4. By Country 19.15. Turkey Global Marine Life Raf Market Analysis 19.15.1. By Product Type 19.15.2. By End Use 19.15.3. By Capacity 19.15.4. By Country 19.16. South Africa Global Marine Life Raf Market Analysis 19.16.1. By Product Type 19.16.2. By End Use 19.16.3. By Capacity 19.16.4. By Country 20. Market Structure Analysis 20.1. Market Analysis by Tier of Companies [Global Marine Life Raf] 20.2. Market Concentration 20.3. Market Share Analysis of Top Players 21. Competition Analysis 21.1. Competition Dashboard 21.2. Primary Survey Analysis 21.3. Competition Deep Dive 21.3.1. Fujikura Composites 21.3.1.1. Overview 21.3.1.2. Product Portfolio 21.3.1.3. Key Financials 21.3.1.4. Sales Footprint 21.3.1.5. Strategy Overview 21.3.2. VIKING LIFE 21.3.2.1. Overview 21.3.2.2. Product Portfolio 21.3.2.3. Key Financials 21.3.2.4. Sales Footprint 21.3.2.5. Strategy Overview 21.3.3. Survitec Group Limited 21.3.3.1. Overview 21.3.3.2. Product Portfolio 21.3.3.3. Key Financials 21.3.3.4. Sales Footprint 21.3.3.5. Strategy Overview 21.3.4. Zodiac 21.3.4.1. Overview 21.3.4.2. Product Portfolio 21.3.4.3. Key Financials 21.3.4.4. Sales Footprint 21.3.4.5. Strategy Overview 21.3.5. Brastech 21.3.5.1. Overview 21.3.5.2. Product Portfolio 21.3.5.3. Key Financials 21.3.5.4. Sales Footprint 21.3.5.5. Strategy Overview 21.3.6. LALIZAS 21.3.6.1. Overview 21.3.6.2. Product Portfolio 21.3.6.3. Key Financials 21.3.6.4. Sales Footprint 21.3.6.5. Strategy Overview 21.3.7. Liferaft Systems Australia 21.3.7.1. Overview 21.3.7.2. Product Portfolio 21.3.7.3. Key Financials 21.3.7.4. Sales Footprint 21.3.7.5. Strategy Overview 21.3.8. MIZUNO MARINE Co.,Ltd. 21.3.8.1. Overview 21.3.8.2. Product Portfolio 21.3.8.3. Key Financials 21.3.8.4. Sales Footprint 21.3.8.5. Strategy Overview 21.3.9. Plastimo 21.3.9.1. Overview 21.3.9.2. Product Portfolio 21.3.9.3. Key Financials 21.3.9.4. Sales Footprint 21.3.9.5. Strategy Overview 21.3.10. COLLINS AEROSPACE 21.3.10.1. Overview 21.3.10.2. Product Portfolio 21.3.10.3. Key Financials 21.3.10.4. Sales Footprint 21.3.10.5. Strategy Overview 21.3.11. Ovatek Inc. 21.3.11.1. Overview 21.3.11.2. Product Portfolio 21.3.11.3. Key Financials 21.3.11.4. Sales Footprint 21.3.11.5. Strategy Overview 22. Assumptions and Acronyms Used 23. Research Methodology
Don't pay for what you don't need
Customize your report by selecting specific countries or regions and save 30%!
Table 01: Global Marine Life Raft Market Size Volume (Units) and Value (US$ Mn) Forecast By Product Type, 2017-2032 Table 02: Global Marine Life Raft Market Size Volume (Units) and Value (US$ Mn) Forecast By Capacity, 2017-2032 Table 03: Global Marine Life Raft Market Size Volume (Units) and Value (US$ Mn) Forecast By End Use, 2017-2032 Table 04: North America Marine Life Raft Market Size Volume (Units) and Value (US$ Mn) Forecast By Country, 2017-2032 Table 05: North America Marine Life Raft Market Size Volume (Units) and Value (US$ Mn) Forecast By Product Type, 2017-2032 Table 06: North America Marine Life Raft Market Size Volume (Units) and Value (US$ Mn) Forecast By Capacity, 2017-2032 Table 07: North America Marine Life Raft Market Size Volume (Units) and Value (US$ Mn) Forecast By End Use, 2017-2032 Table 08: North America Marine Life Raft Market Size Volume (Units) and Value (US$ Mn) Forecast By System Type, 2017-2032 Table 09: Latin America Marine Life Raft Market Size Volume (Units) and Value (US$ Mn) Forecast By Country, 2017-2032 Table 10: Latin America Marine Life Raft Market Size Volume (Units) and Value (US$ Mn) Forecast By Product Type, 2017-2032 Table 11: Latin America Marine Life Raft Market Size Volume (Units) and Value (US$ Mn) Forecast By Capacity, 2017-2032 Table 12: Latin America Marine Life Raft Market Size Volume (Units) and Value (US$ Mn) Forecast By End Use, 2017-2032 Table 13: Latin America Marine Life Raft Market Size Volume (Units) and Value (US$ Mn) Forecast By System Type, 2017-2032 Table 14: Europe Marine Life Raft Market Size Volume (Units) and Value (US$ Mn) Forecast By Country, 2017-2032 Table 15: Europe Marine Life Raft Market Size Volume (Units) and Value (US$ Mn) Forecast By Product Type, 2017-2032 Table 16: Europe Marine Life Raft Market Size Volume (Units) and Value (US$ Mn) Forecast By Capacity, 2017-2032 Table 17: Europe Marine Life Raft Market Size Volume (Units) and Value (US$ Mn) Forecast By End Use, 2017-2032 Table 18: East Asia Marine Life Raft Market Size Volume (Units) and Value (US$ Mn) Forecast By Country, 2017-2032 Table 19: East Asia Marine Life Raft Market Size Volume (Units) and Value (US$ Mn) Forecast By Product Type, 2017-2032 Table 20: East Asia Marine Life Raft Market Size Volume (Units) and Value (US$ Mn) Forecast By Capacity, 2017-2032 Table 21: East Asia Marine Life Raft Market Size Volume (Units) and Value (US$ Mn) Forecast By End Use, 2017-2032 Table 22: South Asia Pacific Marine Life Raft Market Size Volume (Units) and Value (US$ Mn) Forecast By Country, 2017-2032 Table 23: South Asia Pacific Marine Life Raft Market Size Volume (Units) and Value (US$ Mn) Forecast By Product Type, 2017-2032 Table 24: South Asia Pacific Marine Life Raft Market Size Volume (Units) and Value (US$ Mn) Forecast By Capacity, 2017-2032 Table 25: South Asia Pacific Marine Life Raft Market Size Volume (Units) and Value (US$ Mn) Forecast By End Use, 2017-2032 Table 26: Middle East Africa Marine Life Raft Market Size Volume (Units) and Value (US$ Mn) Forecast By Country, 2017-2032 Table 27: Middle East Africa Marine Life Raft Market Size Volume (Units) and Value (US$ Mn) Forecast By Product Type, 2017-2032 Table 28: Middle East Africa Marine Life Raft Market Size Volume (Units) and Value (US$ Mn) Forecast By Capacity, 2017-2032 Table 29: Middle East Africa Marine Life Raft Market Size Volume (Units) and Value (US$ Mn) Forecast By End Use, 2017-2032
Figure 01: Global Marine Life Raft Market Historical, Current and Forecast Volume (Units), 2022-2032 Figure 02: Global Marine Life Raft Market Historical, Current and Forecast Value (US$ Mn), 2022-2032 Figure 03: Global Marine Life Raft Market Incremental $ Opportunity (US$ Mn), 2022-2032 Figure 04: Global Marine Life Raft Market Share and BPS Analysis by Product Type– 2022 & 2032 Figure 05: Global Marine Life Raft Market Y-o-Y Growth Projections by Product Type, 2022-2032 Figure 06: Global Marine Life Raft Market Attractiveness Analysis by Product Type, 2022-2032 Figure 07: Global Marine Life Raft Market Absolute $ Opportunity by Rigid Segment, 2017-2032 Figure 08: Global Marine Life Raft Market Absolute $ Opportunity by Inflatable (Flexible) Segment, 2017-2032 Figure 09: Global Marine Life Raft Market Share and BPS Analysis by Capacity– 2022 & 2032 Figure 10: Global Marine Life Raft Market Y-o-Y Growth Projections by Capacity, 2022-2032 Figure 11: Global Marine Life Raft Market Attractiveness Analysis by Capacity, 2022-2032 Figure 12: Global Marine Life Raft Market Absolute $ Opportunity by less than 5 people, 2017-2032 Figure 13: Global Marine Life Raft Market Absolute $ Opportunity by 5-10 people, 2017-2032 Figure 14: Global Marine Life Raft Market Absolute $ Opportunity by 10-18 people, 2017-2032 Figure 15: Global Marine Life Raft Market Absolute $ Opportunity by more than 18 people, 2017-2032 Figure 16: Global Marine Life Raft Market Share and BPS Analysis by End Use– 2022 & 2032 Figure 17: Global Marine Life Raft Market Y-o-Y Growth Projections by End Use, 2022-2032 Figure 18: Global Marine Life Raft Market Attractiveness Analysis by End Use, 2022-2032 Figure 19: Global Marine Life Raft Market Absolute $ Opportunity by Leisure Segment, 2017-2032 Figure 20: Global Marine Life Raft Market Absolute $ Opportunity by Commercial Segment, 2017-2032 Figure 21: Global Marine Life Raft Market Share and BPS Analysis by Region– 2022 & 2032 Figure 22: Global Marine Life Raft Market Y-o-Y Growth Projections by Region, 2022-2032 Figure 23: Global Marine Life Raft Market Attractiveness Analysis by Region, 2022-2032 Figure 24: Global Marine Life Raft Market Absolute $ Opportunity by North America Segment, 2017-2032 Figure 25: Global Marine Life Raft Market Absolute $ Opportunity by Latin America Segment, 2017-2032 Figure 26: Global Marine Life Raft Market Absolute $ Opportunity by Europe Segment, 2017-2032 Figure 27: Global Marine Life Raft Market Absolute $ Opportunity by East Asia Segment, 2017-2032 Figure 28: Global Marine Life Raft Market Absolute $ Opportunity by South Asia Pacific Segment, 2017-2032 Figure 29: Global Marine Life Raft Market Absolute $ Opportunity by MEA Segment, 2017-2032 Figure 30: North America Marine Life Raft Market Share and BPS Analysis by Country– 2022 & 2032 Figure 31: North America Marine Life Raft Market Y-o-Y Growth Projections by Country, 2022-2032 Figure 32: North America Marine Life Raft Market Attractiveness Projections by Country, 2022-2032 Figure 33: North America Marine Life Raft Market Share and BPS Analysis by Product Type– 2022 & 2032 Figure 34: North America Marine Life Raft Market Y-o-Y Growth Projections by Product Type, 2022-2032 Figure 35: North America Marine Life Raft Market Attractiveness projections by Product Type, 2022-2032 Figure 36: North America Marine Life Raft Market Share and BPS Analysis by Capacity– 2022 & 2032 Figure 37: North America Marine Life Raft Market Y-o-Y Growth Projections by Capacity, 2022-2032 Figure 38: North America Marine Life Raft Market Attractiveness Projections by Capacity, 2022-2032 Figure 39: North America Marine Life Raft Market Share and BPS Analysis by End Use– 2022 & 2032 Figure 40: North America Marine Life Raft Market Y-o-Y Growth Projections by End Use, 2022-20326 Figure 41: North America Marine Life Raft Market Attractiveness Projections by End Use, 2022-2032 Figure 42: Latin America Marine Life Raft Market Share and BPS Analysis by Country– 2022 & 2032 Figure 43: Latin America Marine Life Raft Market Y-o-Y Growth Projections by Country, 2022-2032 Figure 44: Latin America Marine Life Raft Market Attractiveness Projections by Country, 2022-2032 Figure 45: Latin America Marine Life Raft Market Share and BPS Analysis by Product Type– 2022 & 2032 Figure 46: Latin America Marine Life Raft Market Y-o-Y Growth Projections by Product Type, 2022-2032 Figure 47: Latin America Marine Life Raft Market Attractiveness projections by Product Type, 2022-2032 Figure 48: Latin America Marine Life Raft Market Share and BPS Analysis by Capacity– 2022 & 2032 Figure 49: Latin America Marine Life Raft Market Y-o-Y Growth Projections by Capacity, 2022-2032 Figure 50: Latin America Marine Life Raft Market Attractiveness Projections by Capacity, 2022-2032 Figure 51: Latin America Marine Life Raft Market Share and BPS Analysis by End Use– 2022 & 2032 Figure 52: Latin America Marine Life Raft Market Y-o-Y Growth Projections by End Use, 2022-20326 Figure 53: Latin America Marine Life Raft Market Attractiveness Projections by End Use, 2022-2032 Figure 54: Europe Marine Life Raft Market Share and BPS Analysis by Country– 2022 & 2032 Figure 55: Europe Marine Life Raft Market Y-o-Y Growth Projections by Country, 2022-2032 Figure 56: Europe Marine Life Raft Market Attractiveness Projections by Country, 2022-2032 Figure 57: Europe Marine Life Raft Market Share and BPS Analysis by Product Type– 2022 & 2032 Figure 58: Europe Marine Life Raft Market Y-o-Y Growth Projections by Product Type, 2022-2032 Figure 59: Europe Marine Life Raft Market Attractiveness projections by Product Type, 2022-2032 Figure 60: Europe Marine Life Raft Market Share and BPS Analysis by Capacity– 2022 & 2032 Figure 61: Europe Marine Life Raft Market Y-o-Y Growth Projections by Capacity, 2022-2032 Figure 62: Europe Marine Life Raft Market Attractiveness Projections by Capacity, 2022-2032 Figure 63: Europe Marine Life Raft Market Share and BPS Analysis by End Use– 2022 & 2032 Figure 64: Europe Marine Life Raft Market Y-o-Y Growth Projections by End Use, 2022-20326 Figure 65: Europe Marine Life Raft Market Attractiveness Projections by End Use, 2022-2032 Figure 66: East Asia Marine Life Raft Market Share and BPS Analysis by Country– 2022 & 2032 Figure 67: East Asia Marine Life Raft Market Y-o-Y Growth Projections by Country, 2022-2032 Figure 68: East Asia Marine Life Raft Market Attractiveness Projections by Country, 2022-2032 Figure 69: East Asia Marine Life Raft Market Share and BPS Analysis by Product Type– 2022 & 2032 Figure 70: East Asia Marine Life Raft Market Y-o-Y Growth Projections by Product Type, 2022-2032 Figure 71: East Asia Marine Life Raft Market Attractiveness projections by Product Type, 2022-2032 Figure 72: East Asia Marine Life Raft Market Share and BPS Analysis by Capacity– 2022 & 2032 Figure 73: East Asia Marine Life Raft Market Y-o-Y Growth Projections by Capacity, 2022-2032 Figure 74: East Asia Marine Life Raft Market Attractiveness Projections by Capacity, 2022-2032 Figure 75: East Asia Marine Life Raft Market Share and BPS Analysis by End Use– 2022 & 2032 Figure 76: East Asia Marine Life Raft Market Y-o-Y Growth Projections by End Use, 2022-20326 Figure 77: East Asia Marine Life Raft Market Attractiveness Projections by End Use, 2022-2032 Figure 78: South Asia Pacific Marine Life Raft Market Share and BPS Analysis by Country– 2022 & 2032 Figure 79: South Asia Pacific Marine Life Raft Market Y-o-Y Growth Projections by Country, 2022-2032 Figure 80: South Asia Pacific Marine Life Raft Market Attractiveness Projections by Country, 2022-2032 Figure 81: South Asia Pacific Marine Life Raft Market Share and BPS Analysis by Product Type– 2022 & 2032 Figure 82: South Asia Pacific Marine Life Raft Market Y-o-Y Growth Projections by Product Type, 2022-2032 Figure 83: South Asia Pacific Marine Life Raft Market Attractiveness projections by Product Type, 2022-2032 Figure 84: South Asia Pacific Marine Life Raft Market Share and BPS Analysis by Capacity– 2022 & 2032 Figure 85: South Asia Pacific Marine Life Raft Market Y-o-Y Growth Projections by Capacity, 2022-2032 Figure 86: South Asia Pacific Marine Life Raft Market Attractiveness Projections by Capacity, 2022-2032 Figure 87: South Asia Pacific Marine Life Raft Market Share and BPS Analysis by End Use– 2022 & 2032 Figure 88: South Asia Pacific Marine Life Raft Market Y-o-Y Growth Projections by End Use, 2022-20326 Figure 89: South Asia Pacific Marine Life Raft Market Attractiveness Projections by End Use, 2022-2032 Figure 80: Middle East Africa Marine Life Raft Market Share and BPS Analysis by Country– 2022 & 2032 Figure 81: Middle East Africa Marine Life Raft Market Y-o-Y Growth Projections by Country, 2022-2032 Figure 82: Middle East Africa Marine Life Raft Market Attractiveness Projections by Country, 2022-2032 Figure 83: Middle East Africa Marine Life Raft Market Share and BPS Analysis by Product Type– 2022 & 2032 Figure 84: Middle East Africa Marine Life Raft Market Y-o-Y Growth Projections by Product Type, 2022-2032 Figure 85: Middle East Africa Marine Life Raft Market Attractiveness projections by Product Type, 2022-2032 Figure 86: Middle East Africa Marine Life Raft Market Share and BPS Analysis by Capacity– 2022 & 2032 Figure 87: Middle East Africa Marine Life Raft Market Y-o-Y Growth Projections by Capacity, 2022-2032 Figure 88: Middle East Africa Marine Life Raft Market Attractiveness Projections by Capacity, 2022-2032 Figure 89: Middle East Africa Marine Life Raft Market Share and BPS Analysis by End Use– 2022 & 2032 Figure 90: Middle East Africa Marine Life Raft Market Y-o-Y Growth Projections by End Use, 2022-20326 Figure 91: Middle East Africa Marine Life Raft Market Attractiveness Projections by End Use, 2022-2032
Recommendations
Explore Automotive Insights
View Reports