Marine Feed Market - Size, Share and Forecast Outlook 2025 to 2035

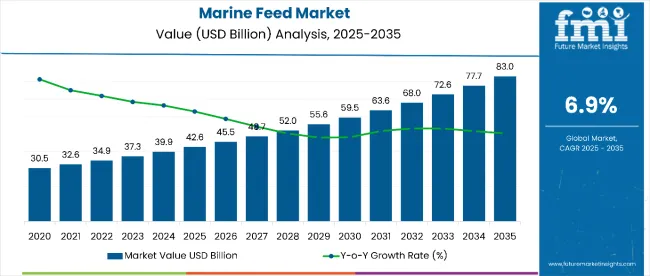
The marine feed market is estimated to be valued at USD 42.6 billion in 2025 and is projected to reach USD 83.0 billion by 2035, registering a compound annual growth rate (CAGR) of 6.9% over the forecast period. The market is projected to add an absolute dollar opportunity of USD 40.4 billion during 2025 to 2035.
Quick Stats for Marine Feed Market

  • Marine Feed Market Value (2025): USD 42.6 billion
  • Marine Feed Market Forecast Value (2035): USD 83.0 billion
  • Marine Feed Market Forecast CAGR (2025 to 2035): 6.9%
  • Leading Segment in Marine Feed Market (2025): Fish (69%)
  • Key Growth Regions in Marine Feed Market: East Asia, Europe, and South Asia
  • Key Players in Marine Feed Market: Skretting, BioMar Group, Cargill Inc., Aller Aqua, Zeigler Bros., Inc.

Marine Feed Market

Metric Value
Market Estimated Value in (2025E) USD 42.6 billion
Market Forecast Value in (2035F) USD 83.0 billion
Forecast CAGR (2025 to 2035) 6.9%

This reflects a growth at a healthy compound annual growth rate of 6.9%. Market evolution is expected to be shaped by rising seafood consumption, aquaculture intensification, and demand for nutritionally efficient feed formulations.

By 2030, the market is likely to reach approximately USD 59.5 billion, representing an incremental value of USD 18.4 billion in the first half of the decade. The remaining USD 22.0 billion is expected to be generated during the second half, suggesting a balanced but slightly back-loaded growth pattern. Overall, the market is projected to add an absolute dollar opportunity of USD 40.4 billion between 2025 and 2035. Product adoption is gaining traction due to the efficiency of formulated feeds in improving fish and crustacean yields, alongside rising attention toward sustainable aquaculture practices.

Companies such as Skretting, BioMar Group, Cargill Inc., Aller Aqua, and Zeigler Bros., Inc. are advancing their competitive positions through investment in feed innovation, sustainable raw material sourcing, and scalable aquaculture solutions. Innovation-led production and distribution models are driving expansion into functional fish diets, specialty formulations for crustaceans and mollusks, and eco-responsible aquafeed systems. Market performance will remain anchored in nutritional efficiency, regulatory compliance, species-specific customization, and sustainable sourcing benchmarks.

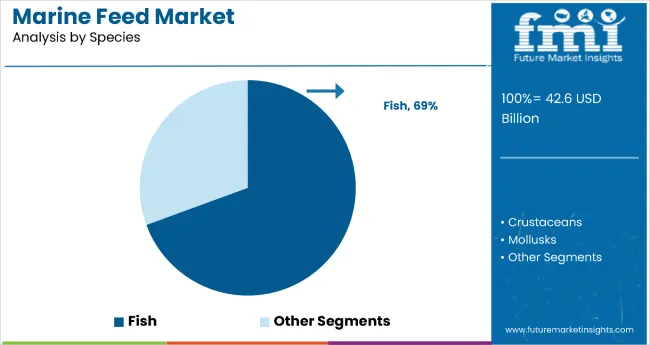
The market holds a significant share of the global aquafeed industry, supported by its role in enhancing aquaculture productivity and meeting rising seafood demand. Fish accounts for nearly 69% of the marine feed segment, reflecting its dominance in providing balanced nutrition for aquaculture production.

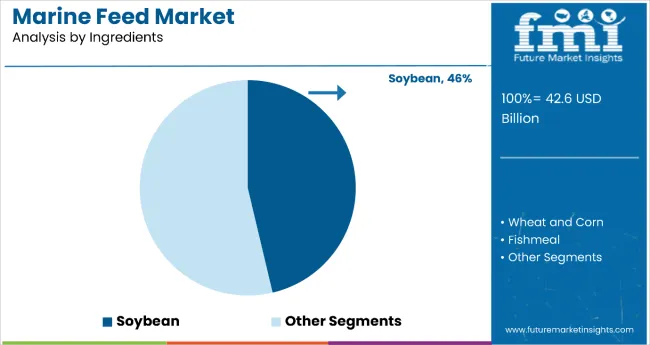
The market contributes around 46% of total feed formulations through soybean inclusion, highlighting its reliance on plant-based proteins. In terms of feed form, pellets capture 62.7% share, driven by their efficiency in feed conversion and ease of handling. The distribution landscape is led by business-to-business channels with a 52.8% share, indicating bulk sales to aquaculture producers and feed distributors.

The market is undergoing structural transformation driven by sustainability concerns, species-specific feed innovations, and increasing adoption of alternative protein sources such as algae, krill meal, and microalgae. Advanced formulation technologies have improved nutrient digestibility, reduced environmental impact, and optimized growth performance in fish, crustaceans, and mollusks. Manufacturers are introducing eco-friendly feed solutions, precision nutrition, and species-tailored formulations that support the expansion of global aquaculture production.

Why is the Marine Feed Market Growing?

Rising global demand for seafood, coupled with the rapid expansion of aquaculture, is driving growth in the marine feed market. Fish and other marine species require nutritionally balanced feed to enhance growth rates, improve disease resistance, and optimize yields, making high-quality feed essential for sustainable aquaculture practices.

Increasing focus on food security, protein demand, and sustainable fisheries management is further propelling market adoption. Regulatory support for responsible aquaculture, along with innovations in feed formulations using alternative proteins such as algae, krill meal, and microalgae, are enhancing both nutritional value and environmental sustainability.

As seafood consumption rises in emerging economies and advanced farming practices expand in mature markets, the outlook for marine feed remains highly favorable. With producers and governments prioritizing efficiency, eco-friendly solutions, and species-specific nutrition, the marine feed market is well-positioned to expand across global aquaculture systems.

Marine Feed Market Analysis by Top Investment Segments

The market is segmented by species, ingredients, form, distribution channel, and region. By species, the market is segmented into fish, crustaceans, mollusks, and others (squid). Based on ingredients, the market is divided into soybean, wheat and corn, fishmeal, fish oil, krill meal, shrimp meal, squid meal, algae and microalgae, seaweed and seagrass, and others (spirulina, yeast).

In terms of form, the market is categorized into pellets, powder, granules, and flakes. By distribution channel, the market is bifurcated into business-to-business and business-to-consumer. Regionally, the market is classified into North America, Latin America, Europe, East Asia, South Asia, Oceania, and the Middle East & Africa.
By Species, Fish Segment Accounts for 69% of the Market Share

Marine Feed Market By Species

The fish segment is the most dominant and lucrative category in the global marine feed market, commanding a significant 69% market share in 2025. This overwhelming share reflects the central role of fish in global aquaculture production, which has become the fastest-growing food production sector in the world.

With aquaculture surpassing capture fisheries in meeting global seafood demand, feed designed specifically for farmed fish has emerged as the backbone of the marine feed industry. The segment’s dominance stems from its economic scale, diverse species demand, and the continuous innovation in feed formulations aimed at maximizing efficiency, sustainability, and profitability.

Fish represents the single largest contributor to global animal protein consumed from aquatic systems. Popular farmed species include salmon, carp, tilapia, catfish, and trout, each requiring tailored feed blends to ensure rapid growth and high feed conversion ratios (FCR). Unlike crustaceans and mollusks, which are niche or regionally concentrated, fish farming is globally distributed and serves both high-value and mass-market protein needs.
By Ingredients, Soybean Segment Accounts for 46% of the Market Share

Marine Feed Market By Ingredienst

Soybean, accounting for 46% market share, is the most dominant ingredient in the marine feed industry. Its popularity stems from high protein content, affordability, and wide availability compared to traditional fishmeal. As aquaculture grows, soybean meal has become the preferred plant-based protein substitute, particularly in fish feed, where balanced amino acids support rapid growth and strong feed conversion ratios. Soy proteins are also used in crustacean diets, reducing dependency on costly marine ingredients.

The shift toward sustainability is further boosting soybean’s demand, as producers seek to lower reliance on wild-caught fishmeal and fish oil. Advances in processing technologies, such as enzyme treatments and fermentation, have enhanced digestibility and reduced anti-nutritional factors in soybean meal, making it more efficient for aquafeeds. Supported by stable global production and lower price volatility, soybean will continue driving profitability in marine feed, positioning itself as the cornerstone ingredient for future sustainable aquaculture expansion.

What are the Drivers, Restraints, and Key Trends of the Marine Feed Market?

From 2025 to 2035, the market is shaped by the rising demand for sustainable aquaculture solutions. Health-conscious consumers seeking responsibly farmed seafood are pushing producers to adopt feeds made with alternative proteins, traceable ingredients, and eco-friendly formulations. This trend benefits feed manufacturers offering innovative, high-performance solutions that reduce dependency on traditional fishmeal and fish oil while maintaining growth and nutritional quality.

Sustainable Protein Shift Drives Marine Feed Market Growth

The growing shift toward sustainable and plant-based proteins has emerged as the primary catalyst for growth in the marine feed market, with soybean and other alternative sources steadily replacing conventional fishmeal and fish oil. By 2024, regulatory pressure and retailer-driven sustainability standards accelerated the move toward eco-friendly feed inputs. By 2025, aquaculture developers were expected to expand the use of plant-based and novel proteins across fish, crustaceans, and mollusks, where feed conversion and animal health remain decisive factors in profitability.

These developments show that scientifically proven outcomessuch as faster growth, improved immunity, and reduced wasterather than marketing trends, are fueling market expansion. Suppliers offering standardized, traceable, and eco-certified feed formulations are positioned to capture growing demand from both global aquaculture leaders and regional producers.

Value-Added Feed Innovation Creates Market Opportunities

Manufacturers began focusing on advanced feed technologies to create multifunctional formulations that enhance digestibility, nutrient absorption, and water quality management while meeting sustainability requirements. By 2025, innovative formats such as specialized hatchery powders, functional grower pellets, and fortified blends were being introduced, improving performance across diverse farming systems.

These developments show that when processing innovation is combined with sustainable ingredient adoption, acceptance and applications expand across aquaculture. Companies investing in novel proteins, functional additives, and precision-engineered feed formats are well-positioned to capture expanding opportunities as the market moves toward long-term growth.
Analysis of Marine Feed Market by Key Countries

Country Wise Analysis Marine Feed Market

Countries CAGR(%)
UK 10.3%
India 8.5%
China 7.9%
Japan 7.3%
USA 6.2%

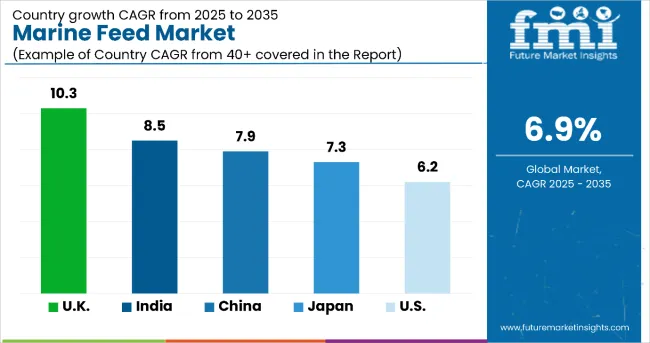
The market demonstrates varied growth across key countries, reflecting distinct aquaculture strengths and priorities. The UK leads with the highest CAGR of 10.3%, supported by modern aquaculture systems, salmon farming, and strong sustainability adoption. India follows at 8.5%, benefiting from its leadership in shrimp farming, rising exports, and government-led feed modernization initiatives.

China, the largest aquaculture producer, is projected at 7.9% CAGR, driven by its scale in carp, tilapia, and shrimp, alongside shifts toward soy- and algae-based feeds. Japan, expanding at 7.3%, emphasizes premium fish species, advanced R&D, and technological integration to sustain high-value aquaculture growth. The USA, at 6.2% CAGR, is propelled by sustainable aquafeed demand, growing adoption of alternative proteins, and regulatory support for marine resource efficiency.

The report covers an in-depth analysis of 40+ countries; five top-performing OECD countries are highlighted below.

Production Capacity Trends in Marine Feed Market in UK

The UK marine feed market is projected to grow at a CAGR of 10.3% during the forecast period. Strong aquaculture expansion, driven by salmon and trout farming, continues to increase demand for specialized marine feed formulations.

The UK is also focusing on sustainable fishmeal substitutes, including algae-based proteins and plant-derived alternatives. Advanced feed technologies and government-supported sustainability regulations are shaping industry dynamics. Export opportunities across Europe strengthen its position as a leading producer. Furthermore, growing R&D in alternative marine proteins is ensuring reduced dependence on traditional fishmeal. The country’s modern aquaculture infrastructure further supports adoption of high-performance marine feed blends.

  • Expanding salmon aquaculture driving higher marine feed usage.
  • Increasing focus on algae and plant-based feed substitutes.
  • Strong government backing for sustainable aquaculture practices.

Output Expansion in Marine Feed Market in India

Revenue from marine feed in India is projected to grow at a CAGR of 8.5% during the forecast period. India’s aquaculture sector, especially shrimp and carp farming, forms the backbone of feed demand. With its position as a leading shrimp exporter, India requires consistent marine feed supply chains.

Local feed mills are expanding capacity, while international companies are entering the market through joint ventures. Government schemes supporting aquaculture modernization further encourage feed innovation. Rising domestic seafood consumption also fuels demand for nutrient-rich feed formulations. India’s diverse climatic zones support varied aquaculture species, strengthening the need for customized marine feed.

  • Shrimp farming dominates feed demand in India’s aquaculture.
  • Export-driven shrimp industry boosting feed supply chain growth.
  • Government aquaculture programs improving feed accessibility.

Structural Adoption in Marine Feed Market in China

Demand for marine feed in China is projected to grow at a CAGR of 7.9% during the forecast period. As the world’s largest aquaculture producer, China represents a massive market for marine feed. Demand is driven by carp, tilapia, shrimp, and shellfish farming, along with growing focus on high-value species.

China is transitioning towards sustainable feed practices, with greater use of microalgae, seaweed, and soy protein concentrates. Government policies emphasizing food security and reduced overfishing further stimulate feed innovation. Rapid urbanization and rising incomes are fueling seafood consumption domestically. The presence of leading feed producers enhances scalability of sustainable marine feed formulations.
  • Dominant global leader in aquaculture feed demand.
  • Expansion in shrimp and tilapia farming boosting consumption.
  • Microalgae and soy protein gaining traction as feed inputs.

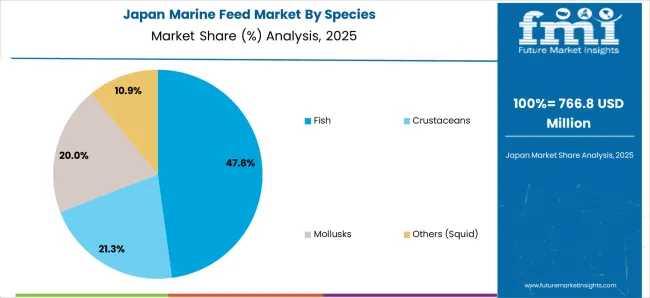
Technological Penetration in Marine Feed Market in Japan

Sales of marine feed in Japanare projected to grow at a CAGR of 7.3% during the forecast period. Japan’s aquaculture sector emphasizes premium fish species such as tuna, yellowtail, and sea bream, requiring highly specialized marine feed. The country invests heavily in advanced aquafeed R&D, with strong focus on reducing environmental impacts.

Technology adoption, including precision feeding systems and alternative protein integration, plays a key role. Japan’s seafood consumption culture remains strong, sustaining steady demand for feed. The government supports marine sustainability initiatives, encouraging reduced fishmeal dependency. High consumer expectations for quality further shape feed innovations in the Japanese market.
  • Premium fish species driving specialized marine feed demand.
  • Heavy investments in aquafeed research and innovation.
  • Adoption of precision feeding systems improving efficiency.

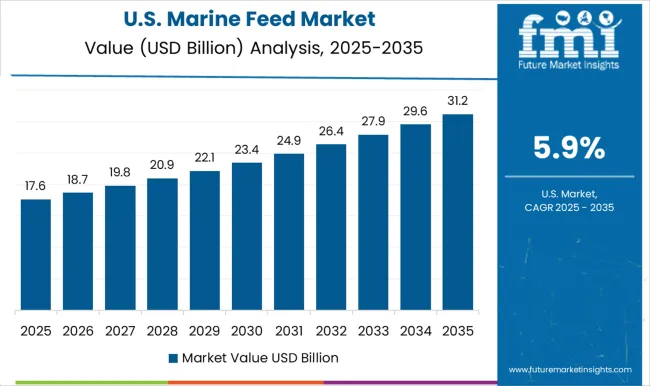
Competitive Dynamics in Marine Feed Market in USA

Sales of marine feed in the USA are projected to grow at a CAGR of 6.2% during the forecast period. Growth is fueled by rising aquaculture activities, particularly in salmon, catfish, and shellfish farming. The USA is focusing on sustainable feed practices, incorporating alternative protein sources like algae, insect meal, and plant-based proteins.

Technological innovations in feed conversion efficiency strengthen competitiveness. Domestic seafood demand and rising imports also support market growth. USA companies are actively investing in eco-friendly feed technologies, aligning with strict environmental regulations. Strategic partnerships between global feed producers and local aquaculture farms further enhance industry development.
  • Rising aquaculture activities boosting feed adoption.
  • Algae and insect meal gaining traction as alternatives.
  • Technological innovation improving feed conversion ratios.

Competitive Landscape of the Marine Feed Market

Marine Feed Market By Company

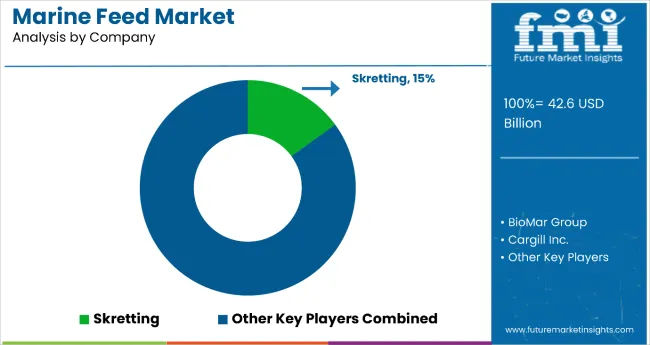
The market is moderately consolidated, with leading suppliers competing through innovation, sustainable sourcing, and application-specific expertise. Companies such as Cargill, Skretting (Nutreco), and BioMar Group dominate the premium aquafeed segment, leveraging advanced R&D and digital platforms to design high-performance marine feed formulations that enhance growth rates, feed conversion ratios, and fish health while aligning with sustainability and traceability requirements. Their strength lies in developing patented feed technologies and omega-rich formulations tailored for salmon, shrimp, and marine fish farming.

ADM and Aller Aqua focus on scalable feed solutions across diverse aquaculture species, addressing rising demand for protein-rich, functional, and environmentally responsible marine feed. Their competitive advantage comes from extensive formulation expertise and wide distribution networks catering to multinational aquaculture producers and regional feed distributors.

Regional innovators such as Avanti Feeds (India) and Tongwei Co., Ltd. (China) emphasize localized sourcing and cost-efficient production, delivering high-quality feed solutions for rapidly expanding aquaculture industries in Asia. These players leverage regional expertise, government partnerships, and sustainability certifications to strengthen their market position while meeting evolving regulatory and consumer-driven demands for safe and eco-friendly marine feed.

Key Developments in the Marine Feed Market

  • In June 2025, Alltech has acquired Finnforel’s share of AlltechFennoaqua Oy, becoming the majority owner of Finland’s only fish feed production facility. This strengthens Alltech’s focus on sustainable aquaculture, expanding RAS-focused feed production and driving innovation in cold-water aquaculture across Finland and northern Europe.
  • In May 2025, BioMar’sMyre and Karmøy facilities in Norway have achieved ASC Feed certification, enabling the production of locally sourced, ASC-compliant feed. This supports Norwegian salmon farmers ahead of the October 2025 certification deadline and reinforces BioMar’s commitment to sustainable, responsible aquaculture practices globally.

Report Scope - Marine Feed Market

Item Value
Quantitative Units (2025) USD 42.6 billion
Species Fish, Crustaceans, Mollusks, Others (Squid)
Ingredients Soybean, Wheat and Corn, Fishmeal, Fish Oil, Krill Meal, Shrimp Meal, Squid Meal, Algae and Microalgae, Seaweed and Seagrass, Others (Spirulina, Yeast)
Form Pellets, Powders, Granules, And Flakes
Distribution Channel Business-to-Business and Business-to-Consumer
Regions Covered North America, Latin America, Europe, East Asia, South Asia, Oceania, Middle East & Africa
Countries Covered United States, Canada, United Kingdom, Germany, France, China, Japan, South Korea, Brazil, Australia and 40+ countries
Key Companies Profiled Cargill, Inc., Zeigler Bros., Inc., Archer Daniels Midland, Alltech Inc., Sonac B.V., BioMar Group, Nutreco N.V., Biomin Holding GmbH, Ridley Corp. Ltd, Others (On Additional Request), Skretting AS, Aller Aqua A/S
Additional Attributes Dollar sales by feed type and application sector, rising adoption of sustainable and functional aquafeed, increasing demand for high-protein formulations, advancements in bio-based and algae-derived feed ingredients, strong growth in Asia-Pacific aquaculture, evolving regulations around marine feed sustainability

Key Segments

By Species:

  • Fish
  • Crustaceans
  • Mollusks
  • Others (Squid)

By Ingredients:

  • Soybean Meal
  • Wheat and Corn
  • Fish Meal
  • Fish Oil
  • Krill Meal
  • Shrimp Meal
  • Squid Meal
  • Algae and Microalgae
  • Seaweed and Seagrass
  • Others (Spirulina, Yeast)

By Form:

  • Pellets
  • Powder
  • Granules
  • Flakes

By Distribution Channel:

  • Business-to-Business
  • Business-to-Consumer
    • Hypermarkets/Supermarkets
    • Specialty Stores
    • Agricultural and Aquatic Supply Stores
    • Online Retailers

By Region:

  • North America
  • Latin America
  • Europe
  • East Asia
  • South Asia
  • Middle East & Africa

Table of Content

  1. Executive Summary
    • Global Market Outlook
    • Demand-side Trends
    • Supply-side Trends
    • Technology Roadmap Analysis
    • Analysis and Recommendations
  2. Market Overview
    • Market Coverage / Taxonomy
    • Market Definition / Scope / Limitations
  3. Market Background
    • Market Dynamics
      • Drivers
      • Restraints
      • Opportunity
      • Trends
    • Scenario Forecast
      • Demand in Optimistic Scenario
      • Demand in Likely Scenario
      • Demand in Conservative Scenario
    • Opportunity Map Analysis
    • Product Life Cycle Analysis
    • Supply Chain Analysis
      • Supply Side Participants and their Roles
        • Producers
        • Mid-Level Participants (Traders/ Agents/ Brokers)
        • Wholesalers and Distributors
      • Value Added and Value Created at Node in the Supply Chain
      • List of Raw Material Suppliers
      • List of Existing and Potential Buyer’s
    • Investment Feasibility Matrix
    • Value Chain Analysis
      • Profit Margin Analysis
      • Wholesalers and Distributors
      • Retailers
    • PESTLE and Porter’s Analysis
    • Regulatory Landscape
      • By Key Regions
      • By Key Countries
    • Regional Parent Market Outlook
    • Production and Consumption Statistics
    • Import and Export Statistics
  4. Global Market Analysis 2020-2024 and Forecast, 2025-2035
    • Historical Market Size Value (USD Billion) & Volume (Metric Tons) Analysis, 2020-2024
    • Current and Future Market Size Value (USD Billion) & Volume (Metric Tons) Projections, 2025-2035
      • Y-o-Y Growth Trend Analysis
      • Absolute $ Opportunity Analysis
  5. Global Market Pricing Analysis 2020-2024 and Forecast 2025-2035
  6. Global Market Analysis 2020-2024 and Forecast 2025-2035, By Species
    • Introduction / Key Findings
    • Historical Market Size Value (USD Billion) & Volume (Metric Tons) Analysis By Species, 2020-2024
    • Current and Future Market Size Value (USD Billion) & Volume (Metric Tons) Analysis and Forecast By Species, 2025-2035
      • Fish
      • Crustaceans
      • Mollusks
      • Others (Squid)
    • Y-o-Y Growth Trend Analysis By Species, 2020-2024
    • Absolute $ Opportunity Analysis By Species, 2025-2035
  7. Global Market Analysis 2020-2024 and Forecast 2025-2035, By Ingredients
    • Introduction / Key Findings
    • Historical Market Size Value (USD Billion) & Volume (Metric Tons) Analysis By Ingredients, 2020-2024
    • Current and Future Market Size Value (USD Billion) & Volume (Metric Tons) Analysis and Forecast By Ingredients, 2025-2035
      • Soybean
      • Wheat and Corn
      • Fishmeal
      • Fish Oil
      • Krill Meal
      • Shrimp Meal
      • Squid Meal
      • Algae and Microalgae
      • Seaweed and Seagrass
      • Others (Spirulina, Yeast)
    • Y-o-Y Growth Trend Analysis By Ingredients, 2020-2024
    • Absolute $ Opportunity Analysis By Ingredients, 2025-2035
  8. Global Market Analysis 2020-2024 and Forecast 2025-2035, By Form
    • Introduction / Key Findings
    • Historical Market Size Value (USD Billion) & Volume (Metric Tons) Analysis By Form, 2020-2024
    • Current and Future Market Size Value (USD Billion) & Volume (Metric Tons) Analysis and Forecast By Form, 2025-2035
      • Pellets
      • Powder
      • Granules
      • Flakes
    • Y-o-Y Growth Trend Analysis By Form, 2020-2024
    • Absolute $ Opportunity Analysis By Form, 2025-2035
  9. Global Market Analysis 2020-2024 and Forecast 2025-2035, By Distribution Channel
    • Introduction / Key Findings
    • Historical Market Size Value (USD Billion) & Volume (Metric Tons) Analysis By Distribution Channel, 2020-2024
    • Current and Future Market Size Value (USD Billion) & Volume (Metric Tons) Analysis and Forecast By Distribution Channel, 2025-2035
      • Business-to-Business
      • Business-to-Consumer
    • Y-o-Y Growth Trend Analysis By Distribution Channel, 2020-2024
    • Absolute $ Opportunity Analysis By Distribution Channel, 2025-2035
  10. Global Market Analysis 2020-2024 and Forecast 2025-2035, By Region
    • Introduction
    • Historical Market Size Value (USD Billion) & Volume (Metric Tons) Analysis By Region, 2020-2024
    • Current Market Size Value (USD Billion) & Volume (Metric Tons) Analysis and Forecast By Region, 2025-2035
      • North America
      • Latin America
      • Western Europe
      • Eastern Europe
      • East Asia
      • South Asia & Pacific
      • Middle East and Africa
    • Market Attractiveness Analysis By Region
  11. North America Market Analysis 2020-2024 and Forecast 2025-2035, By Country
    • Historical Market Size Value (USD Billion) & Volume (Metric Tons) Trend Analysis By Market Taxonomy, 2020-2024
    • Market Size Value (USD Billion) & Volume (Metric Tons) Forecast By Market Taxonomy, 2025-2035
      • By Country
        • U.S.
        • Canada
        • Mexico
      • By Species
      • By Ingredients
      • By Form
      • By Distribution Channel
    • Market Attractiveness Analysis
      • By Country
      • By Species
      • By Ingredients
      • By Form
      • By Distribution Channel
    • Key Takeaways
  12. Latin America Market Analysis 2020-2024 and Forecast 2025-2035, By Country
    • Historical Market Size Value (USD Billion) & Volume (Metric Tons) Trend Analysis By Market Taxonomy, 2020-2024
    • Market Size Value (USD Billion) & Volume (Metric Tons) Forecast By Market Taxonomy, 2025-2035
      • By Country
        • Brazil
        • Argentina
        • Rest of LATAM
      • By Species
      • By Ingredients
      • By Form
      • By Distribution Channel
    • Market Attractiveness Analysis
      • By Country
      • By Species
      • By Ingredients
      • By Form
      • By Distribution Channel
    • Key Takeaways
  13. Western Europe Market Analysis 2020-2024 and Forecast 2025-2035, By Country
    • Historical Market Size Value (USD Billion) & Volume (Metric Tons) Trend Analysis By Market Taxonomy, 2020-2024
    • Market Size Value (USD Billion) & Volume (Metric Tons) Forecast By Market Taxonomy, 2025-2035
      • By Country
        • Germany
        • Italy
        • France
        • UK
        • Spain
        • BENELUX
        • Nordic
        • Rest of W.Europe
      • By Species
      • By Ingredients
      • By Form
      • By Distribution Channel
    • Market Attractiveness Analysis
      • By Country
      • By Species
      • By Ingredients
      • By Form
      • By Distribution Channel
    • Key Takeaways
  14. Eastern Europe Market Analysis 2020-2024 and Forecast 2025-2035, By Country
    • Historical Market Size Value (USD Billion) & Volume (Metric Tons) Trend Analysis By Market Taxonomy, 2020-2024
    • Market Size Value (USD Billion) & Volume (Metric Tons) Forecast By Market Taxonomy, 2025-2035
      • By Country
        • Russia
        • Hungary
        • Poland
        • Balkan & Baltics
        • Rest of E. Europe
      • By Species
      • By Ingredients
      • By Form
      • By Distribution Channel
    • Market Attractiveness Analysis
      • By Country
      • By Species
      • By Ingredients
      • By Form
      • By Distribution Channel
    • Key Takeaways
  15. East Asia Market Analysis 2020-2024 and Forecast 2025-2035, By Country
    • Historical Market Size Value (USD Billion) & Volume (Metric Tons) Trend Analysis By Market Taxonomy, 2020-2024
    • Market Size Value (USD Billion) & Volume (Metric Tons) Forecast By Market Taxonomy, 2025-2035
      • By Country
        • China
        • Japan
        • South Korea
      • By Species
      • By Ingredients
      • By Form
      • By Distribution Channel
    • Market Attractiveness Analysis
      • By Country
      • By Species
      • By Ingredients
      • By Form
      • By Distribution Channel
    • Key Takeaways
  16. South Asia & Pacific Market Analysis 2020-2024 and Forecast 2025-2035, By Country
    • Historical Market Size Value (USD Billion) & Volume (Metric Tons) Trend Analysis By Market Taxonomy, 2020-2024
    • Market Size Value (USD Billion) & Volume (Metric Tons) Forecast By Market Taxonomy, 2025-2035
      • By Country
        • India
        • Australia & New Zealand
        • ASEAN
        • Rest of SAP
      • By Species
      • By Ingredients
      • By Form
      • By Distribution Channel
    • Market Attractiveness Analysis
      • By Country
      • By Species
      • By Ingredients
      • By Form
      • By Distribution Channel
    • Key Takeaways
  17. Middle East and Africa Market Analysis 2020-2024 and Forecast 2025-2035, By Country
    • Historical Market Size Value (USD Billion) & Volume (Metric Tons) Trend Analysis By Market Taxonomy, 2020-2024
    • Market Size Value (USD Billion) & Volume (Metric Tons) Forecast By Market Taxonomy, 2025-2035
      • By Country
        • GCC Countries
        • Northern Africa
        • South Africa
        • Turkiye
        • Rest of MEA
      • By Species
      • By Ingredients
      • By Form
      • By Distribution Channel
    • Market Attractiveness Analysis
      • By Country
      • By Species
      • By Ingredients
      • By Form
      • By Distribution Channel
    • Key Takeaways
  18. Key Countries Market Analysis
    • U.S.
      • Pricing Analysis
      • Market Share Analysis, 2024
        • By Species
        • By Ingredients
        • By Form
        • By Distribution Channel
    • Canada
      • Pricing Analysis
      • Market Share Analysis, 2024
        • By Species
        • By Ingredients
        • By Form
        • By Distribution Channel
    • Brazil
      • Pricing Analysis
      • Market Share Analysis, 2024
        • By Species
        • By Ingredients
        • By Form
        • By Distribution Channel
    • Mexico
      • Pricing Analysis
      • Market Share Analysis, 2024
        • By Species
        • By Ingredients
        • By Form
        • By Distribution Channel
    • Argentina
      • Pricing Analysis
      • Market Share Analysis, 2024
        • By Species
        • By Ingredients
        • By Form
        • By Distribution Channel
  19. Market Structure Analysis
    • Competition Dashboard
    • Competition Benchmarking
    • Market Share Analysis of Top Players
      • By Regional
      • By Species
      • By Ingredients
      • By Form
      • By Distribution Channel
  20. Competition Analysis
    • Competition Deep Dive
      • Cargill, Inc.
        • Overview
        • Product Portfolio
        • Profitability by Market Segments (Product/Age /Sales Channel/Region)
        • Sales Footprint
        • Strategy Overview
          • Marketing Strategy
          • Product Strategy
          • Channel Strategy
      • Zeigler Bros., Inc.
        • Overview
        • Product Portfolio
        • Profitability by Market Segments (Product/Age /Sales Channel/Region)
        • Sales Footprint
        • Strategy Overview
          • Marketing Strategy
          • Product Strategy
          • Channel Strategy
      • Archer Daniels Midland
        • Overview
        • Product Portfolio
        • Profitability by Market Segments (Product/Age /Sales Channel/Region)
        • Sales Footprint
        • Strategy Overview
          • Marketing Strategy
          • Product Strategy
          • Channel Strategy
      • Alltech Inc.
        • Overview
        • Product Portfolio
        • Profitability by Market Segments (Product/Age /Sales Channel/Region)
        • Sales Footprint
        • Strategy Overview
          • Marketing Strategy
          • Product Strategy
          • Channel Strategy
      • Sonac B.V.
        • Overview
        • Product Portfolio
        • Profitability by Market Segments (Product/Age /Sales Channel/Region)
        • Sales Footprint
        • Strategy Overview
          • Marketing Strategy
          • Product Strategy
          • Channel Strategy
      • BioMar Group
        • Overview
        • Product Portfolio
        • Profitability by Market Segments (Product/Age /Sales Channel/Region)
        • Sales Footprint
        • Strategy Overview
          • Marketing Strategy
          • Product Strategy
          • Channel Strategy
      • Nutreco N.V.
        • Overview
        • Product Portfolio
        • Profitability by Market Segments (Product/Age /Sales Channel/Region)
        • Sales Footprint
        • Strategy Overview
          • Marketing Strategy
          • Product Strategy
          • Channel Strategy
      • Biomin Holding GmbH
        • Overview
        • Product Portfolio
        • Profitability by Market Segments (Product/Age /Sales Channel/Region)
        • Sales Footprint
        • Strategy Overview
          • Marketing Strategy
          • Product Strategy
          • Channel Strategy
      • Ridley Corp. Ltd
        • Overview
        • Product Portfolio
        • Profitability by Market Segments (Product/Age /Sales Channel/Region)
        • Sales Footprint
        • Strategy Overview
          • Marketing Strategy
          • Product Strategy
          • Channel Strategy
      • Others (On Additional Request)
        • Overview
        • Product Portfolio
        • Profitability by Market Segments (Product/Age /Sales Channel/Region)
        • Sales Footprint
        • Strategy Overview
          • Marketing Strategy
          • Product Strategy
          • Channel Strategy
      • Skretting AS
        • Overview
        • Product Portfolio
        • Profitability by Market Segments (Product/Age /Sales Channel/Region)
        • Sales Footprint
        • Strategy Overview
          • Marketing Strategy
          • Product Strategy
          • Channel Strategy
      • Aller Aqua A/S
        • Overview
        • Product Portfolio
        • Profitability by Market Segments (Product/Age /Sales Channel/Region)
        • Sales Footprint
        • Strategy Overview
          • Marketing Strategy
          • Product Strategy
          • Channel Strategy
  21. Assumptions & Acronyms Used
  22. Research Methodology

List of Tables

  • Table 1: Global Market Value (USD Billion) Forecast by Region, 2020-2035
  • Table 2: Global Market Volume (Metric Tons) Forecast by Region, 2020-2035
  • Table 3: Global Market Value (USD Billion) Forecast by Species, 2020-2035
  • Table 4: Global Market Volume (Metric Tons) Forecast by Species, 2020-2035
  • Table 5: Global Market Value (USD Billion) Forecast by Ingredients, 2020-2035
  • Table 6: Global Market Volume (Metric Tons) Forecast by Ingredients, 2020-2035
  • Table 7: Global Market Value (USD Billion) Forecast by Form, 2020-2035
  • Table 8: Global Market Volume (Metric Tons) Forecast by Form, 2020-2035
  • Table 9: Global Market Value (USD Billion) Forecast by Distribution Channel, 2020-2035
  • Table 10: Global Market Volume (Metric Tons) Forecast by Distribution Channel, 2020-2035
  • Table 11: North America Market Value (USD Billion) Forecast by Country, 2020-2035
  • Table 12: North America Market Volume (Metric Tons) Forecast by Country, 2020-2035
  • Table 13: North America Market Value (USD Billion) Forecast by Species, 2020-2035
  • Table 14: North America Market Volume (Metric Tons) Forecast by Species, 2020-2035
  • Table 15: North America Market Value (USD Billion) Forecast by Ingredients, 2020-2035
  • Table 16: North America Market Volume (Metric Tons) Forecast by Ingredients, 2020-2035
  • Table 17: North America Market Value (USD Billion) Forecast by Form, 2020-2035
  • Table 18: North America Market Volume (Metric Tons) Forecast by Form, 2020-2035
  • Table 19: North America Market Value (USD Billion) Forecast by Distribution Channel, 2020-2035
  • Table 20: North America Market Volume (Metric Tons) Forecast by Distribution Channel, 2020-2035
  • Table 21: Latin America Market Value (USD Billion) Forecast by Country, 2020-2035
  • Table 22: Latin America Market Volume (Metric Tons) Forecast by Country, 2020-2035
  • Table 23: Latin America Market Value (USD Billion) Forecast by Species, 2020-2035
  • Table 24: Latin America Market Volume (Metric Tons) Forecast by Species, 2020-2035
  • Table 25: Latin America Market Value (USD Billion) Forecast by Ingredients, 2020-2035
  • Table 26: Latin America Market Volume (Metric Tons) Forecast by Ingredients, 2020-2035
  • Table 27: Latin America Market Value (USD Billion) Forecast by Form, 2020-2035
  • Table 28: Latin America Market Volume (Metric Tons) Forecast by Form, 2020-2035
  • Table 29: Latin America Market Value (USD Billion) Forecast by Distribution Channel, 2020-2035
  • Table 30: Latin America Market Volume (Metric Tons) Forecast by Distribution Channel, 2020-2035
  • Table 31: Western Europe Market Value (USD Billion) Forecast by Country, 2020-2035
  • Table 32: Western Europe Market Volume (Metric Tons) Forecast by Country, 2020-2035
  • Table 33: Western Europe Market Value (USD Billion) Forecast by Species, 2020-2035
  • Table 34: Western Europe Market Volume (Metric Tons) Forecast by Species, 2020-2035
  • Table 35: Western Europe Market Value (USD Billion) Forecast by Ingredients, 2020-2035
  • Table 36: Western Europe Market Volume (Metric Tons) Forecast by Ingredients, 2020-2035
  • Table 37: Western Europe Market Value (USD Billion) Forecast by Form, 2020-2035
  • Table 38: Western Europe Market Volume (Metric Tons) Forecast by Form, 2020-2035
  • Table 39: Western Europe Market Value (USD Billion) Forecast by Distribution Channel, 2020-2035
  • Table 40: Western Europe Market Volume (Metric Tons) Forecast by Distribution Channel, 2020-2035
  • Table 41: Eastern Europe Market Value (USD Billion) Forecast by Country, 2020-2035
  • Table 42: Eastern Europe Market Volume (Metric Tons) Forecast by Country, 2020-2035
  • Table 43: Eastern Europe Market Value (USD Billion) Forecast by Species, 2020-2035
  • Table 44: Eastern Europe Market Volume (Metric Tons) Forecast by Species, 2020-2035
  • Table 45: Eastern Europe Market Value (USD Billion) Forecast by Ingredients, 2020-2035
  • Table 46: Eastern Europe Market Volume (Metric Tons) Forecast by Ingredients, 2020-2035
  • Table 47: Eastern Europe Market Value (USD Billion) Forecast by Form, 2020-2035
  • Table 48: Eastern Europe Market Volume (Metric Tons) Forecast by Form, 2020-2035
  • Table 49: Eastern Europe Market Value (USD Billion) Forecast by Distribution Channel, 2020-2035
  • Table 50: Eastern Europe Market Volume (Metric Tons) Forecast by Distribution Channel, 2020-2035
  • Table 51: East Asia Market Value (USD Billion) Forecast by Country, 2020-2035
  • Table 52: East Asia Market Volume (Metric Tons) Forecast by Country, 2020-2035
  • Table 53: East Asia Market Value (USD Billion) Forecast by Species, 2020-2035
  • Table 54: East Asia Market Volume (Metric Tons) Forecast by Species, 2020-2035
  • Table 55: East Asia Market Value (USD Billion) Forecast by Ingredients, 2020-2035
  • Table 56: East Asia Market Volume (Metric Tons) Forecast by Ingredients, 2020-2035
  • Table 57: East Asia Market Value (USD Billion) Forecast by Form, 2020-2035
  • Table 58: East Asia Market Volume (Metric Tons) Forecast by Form, 2020-2035
  • Table 59: East Asia Market Value (USD Billion) Forecast by Distribution Channel, 2020-2035
  • Table 60: East Asia Market Volume (Metric Tons) Forecast by Distribution Channel, 2020-2035
  • Table 61: South Asia & Pacific Market Value (USD Billion) Forecast by Country, 2020-2035
  • Table 62: South Asia & Pacific Market Volume (Metric Tons) Forecast by Country, 2020-2035
  • Table 63: South Asia & Pacific Market Value (USD Billion) Forecast by Species, 2020-2035
  • Table 64: South Asia & Pacific Market Volume (Metric Tons) Forecast by Species, 2020-2035
  • Table 65: South Asia & Pacific Market Value (USD Billion) Forecast by Ingredients, 2020-2035
  • Table 66: South Asia & Pacific Market Volume (Metric Tons) Forecast by Ingredients, 2020-2035
  • Table 67: South Asia & Pacific Market Value (USD Billion) Forecast by Form, 2020-2035
  • Table 68: South Asia & Pacific Market Volume (Metric Tons) Forecast by Form, 2020-2035
  • Table 69: South Asia & Pacific Market Value (USD Billion) Forecast by Distribution Channel, 2020-2035
  • Table 70: South Asia & Pacific Market Volume (Metric Tons) Forecast by Distribution Channel, 2020-2035
  • Table 71: Middle East and Africa Market Value (USD Billion) Forecast by Country, 2020-2035
  • Table 72: Middle East and Africa Market Volume (Metric Tons) Forecast by Country, 2020-2035
  • Table 73: Middle East and Africa Market Value (USD Billion) Forecast by Species, 2020-2035
  • Table 74: Middle East and Africa Market Volume (Metric Tons) Forecast by Species, 2020-2035
  • Table 75: Middle East and Africa Market Value (USD Billion) Forecast by Ingredients, 2020-2035
  • Table 76: Middle East and Africa Market Volume (Metric Tons) Forecast by Ingredients, 2020-2035
  • Table 77: Middle East and Africa Market Value (USD Billion) Forecast by Form, 2020-2035
  • Table 78: Middle East and Africa Market Volume (Metric Tons) Forecast by Form, 2020-2035
  • Table 79: Middle East and Africa Market Value (USD Billion) Forecast by Distribution Channel, 2020-2035
  • Table 80: Middle East and Africa Market Volume (Metric Tons) Forecast by Distribution Channel, 2020-2035

List of Figures

  • Figure 1: Global Market Volume (Metric Tons) Forecast 2020-2035
  • Figure 2: Global Market Pricing Analysis
  • Figure 3: Global Market Value (USD Billion) Forecast 2020-2035
  • Figure 4: Global Market Value Share and BPS Analysis by Species, 2025 and 2035
  • Figure 5: Global Market Y-o-Y Growth Comparison by Species, 2025-2035
  • Figure 6: Global Market Attractiveness Analysis by Species
  • Figure 7: Global Market Value Share and BPS Analysis by Ingredients, 2025 and 2035
  • Figure 8: Global Market Y-o-Y Growth Comparison by Ingredients, 2025-2035
  • Figure 9: Global Market Attractiveness Analysis by Ingredients
  • Figure 10: Global Market Value Share and BPS Analysis by Form, 2025 and 2035
  • Figure 11: Global Market Y-o-Y Growth Comparison by Form, 2025-2035
  • Figure 12: Global Market Attractiveness Analysis by Form
  • Figure 13: Global Market Value Share and BPS Analysis by Distribution Channel, 2025 and 2035
  • Figure 14: Global Market Y-o-Y Growth Comparison by Distribution Channel, 2025-2035
  • Figure 15: Global Market Attractiveness Analysis by Distribution Channel
  • Figure 16: Global Market Value (USD Billion) Share and BPS Analysis by Region, 2025 and 2035
  • Figure 17: Global Market Y-o-Y Growth Comparison by Region, 2025-2035
  • Figure 18: Global Market Attractiveness Analysis by Region
  • Figure 19: North America Market Incremental $ Opportunity, 2025-2035
  • Figure 20: Latin America Market Incremental $ Opportunity, 2025-2035
  • Figure 21: Western Europe Market Incremental $ Opportunity, 2025-2035
  • Figure 22: Eastern Europe Market Incremental $ Opportunity, 2025-2035
  • Figure 23: East Asia Market Incremental $ Opportunity, 2025-2035
  • Figure 24: South Asia & Pacific Market Incremental $ Opportunity, 2025-2035
  • Figure 25: Middle East and Africa Market Incremental $ Opportunity, 2025-2035
  • Figure 26: North America Market Value Share and BPS Analysis by Country, 2025 and 2035
  • Figure 27: North America Market Value Share and BPS Analysis by Species, 2025 and 2035
  • Figure 28: North America Market Y-o-Y Growth Comparison by Species, 2025-2035
  • Figure 29: North America Market Attractiveness Analysis by Species
  • Figure 30: North America Market Value Share and BPS Analysis by Ingredients, 2025 and 2035
  • Figure 31: North America Market Y-o-Y Growth Comparison by Ingredients, 2025-2035
  • Figure 32: North America Market Attractiveness Analysis by Ingredients
  • Figure 33: North America Market Value Share and BPS Analysis by Form, 2025 and 2035
  • Figure 34: North America Market Y-o-Y Growth Comparison by Form, 2025-2035
  • Figure 35: North America Market Attractiveness Analysis by Form
  • Figure 36: North America Market Value Share and BPS Analysis by Distribution Channel, 2025 and 2035
  • Figure 37: North America Market Y-o-Y Growth Comparison by Distribution Channel, 2025-2035
  • Figure 38: North America Market Attractiveness Analysis by Distribution Channel
  • Figure 39: Latin America Market Value Share and BPS Analysis by Country, 2025 and 2035
  • Figure 40: Latin America Market Value Share and BPS Analysis by Species, 2025 and 2035
  • Figure 41: Latin America Market Y-o-Y Growth Comparison by Species, 2025-2035
  • Figure 42: Latin America Market Attractiveness Analysis by Species
  • Figure 43: Latin America Market Value Share and BPS Analysis by Ingredients, 2025 and 2035
  • Figure 44: Latin America Market Y-o-Y Growth Comparison by Ingredients, 2025-2035
  • Figure 45: Latin America Market Attractiveness Analysis by Ingredients
  • Figure 46: Latin America Market Value Share and BPS Analysis by Form, 2025 and 2035
  • Figure 47: Latin America Market Y-o-Y Growth Comparison by Form, 2025-2035
  • Figure 48: Latin America Market Attractiveness Analysis by Form
  • Figure 49: Latin America Market Value Share and BPS Analysis by Distribution Channel, 2025 and 2035
  • Figure 50: Latin America Market Y-o-Y Growth Comparison by Distribution Channel, 2025-2035
  • Figure 51: Latin America Market Attractiveness Analysis by Distribution Channel
  • Figure 52: Western Europe Market Value Share and BPS Analysis by Country, 2025 and 2035
  • Figure 53: Western Europe Market Value Share and BPS Analysis by Species, 2025 and 2035
  • Figure 54: Western Europe Market Y-o-Y Growth Comparison by Species, 2025-2035
  • Figure 55: Western Europe Market Attractiveness Analysis by Species
  • Figure 56: Western Europe Market Value Share and BPS Analysis by Ingredients, 2025 and 2035
  • Figure 57: Western Europe Market Y-o-Y Growth Comparison by Ingredients, 2025-2035
  • Figure 58: Western Europe Market Attractiveness Analysis by Ingredients
  • Figure 59: Western Europe Market Value Share and BPS Analysis by Form, 2025 and 2035
  • Figure 60: Western Europe Market Y-o-Y Growth Comparison by Form, 2025-2035
  • Figure 61: Western Europe Market Attractiveness Analysis by Form
  • Figure 62: Western Europe Market Value Share and BPS Analysis by Distribution Channel, 2025 and 2035
  • Figure 63: Western Europe Market Y-o-Y Growth Comparison by Distribution Channel, 2025-2035
  • Figure 64: Western Europe Market Attractiveness Analysis by Distribution Channel
  • Figure 65: Eastern Europe Market Value Share and BPS Analysis by Country, 2025 and 2035
  • Figure 66: Eastern Europe Market Value Share and BPS Analysis by Species, 2025 and 2035
  • Figure 67: Eastern Europe Market Y-o-Y Growth Comparison by Species, 2025-2035
  • Figure 68: Eastern Europe Market Attractiveness Analysis by Species
  • Figure 69: Eastern Europe Market Value Share and BPS Analysis by Ingredients, 2025 and 2035
  • Figure 70: Eastern Europe Market Y-o-Y Growth Comparison by Ingredients, 2025-2035
  • Figure 71: Eastern Europe Market Attractiveness Analysis by Ingredients
  • Figure 72: Eastern Europe Market Value Share and BPS Analysis by Form, 2025 and 2035
  • Figure 73: Eastern Europe Market Y-o-Y Growth Comparison by Form, 2025-2035
  • Figure 74: Eastern Europe Market Attractiveness Analysis by Form
  • Figure 75: Eastern Europe Market Value Share and BPS Analysis by Distribution Channel, 2025 and 2035
  • Figure 76: Eastern Europe Market Y-o-Y Growth Comparison by Distribution Channel, 2025-2035
  • Figure 77: Eastern Europe Market Attractiveness Analysis by Distribution Channel
  • Figure 78: East Asia Market Value Share and BPS Analysis by Country, 2025 and 2035
  • Figure 79: East Asia Market Value Share and BPS Analysis by Species, 2025 and 2035
  • Figure 80: East Asia Market Y-o-Y Growth Comparison by Species, 2025-2035
  • Figure 81: East Asia Market Attractiveness Analysis by Species
  • Figure 82: East Asia Market Value Share and BPS Analysis by Ingredients, 2025 and 2035
  • Figure 83: East Asia Market Y-o-Y Growth Comparison by Ingredients, 2025-2035
  • Figure 84: East Asia Market Attractiveness Analysis by Ingredients
  • Figure 85: East Asia Market Value Share and BPS Analysis by Form, 2025 and 2035
  • Figure 86: East Asia Market Y-o-Y Growth Comparison by Form, 2025-2035
  • Figure 87: East Asia Market Attractiveness Analysis by Form
  • Figure 88: East Asia Market Value Share and BPS Analysis by Distribution Channel, 2025 and 2035
  • Figure 89: East Asia Market Y-o-Y Growth Comparison by Distribution Channel, 2025-2035
  • Figure 90: East Asia Market Attractiveness Analysis by Distribution Channel
  • Figure 91: South Asia & Pacific Market Value Share and BPS Analysis by Country, 2025 and 2035
  • Figure 92: South Asia & Pacific Market Value Share and BPS Analysis by Species, 2025 and 2035
  • Figure 93: South Asia & Pacific Market Y-o-Y Growth Comparison by Species, 2025-2035
  • Figure 94: South Asia & Pacific Market Attractiveness Analysis by Species
  • Figure 95: South Asia & Pacific Market Value Share and BPS Analysis by Ingredients, 2025 and 2035
  • Figure 96: South Asia & Pacific Market Y-o-Y Growth Comparison by Ingredients, 2025-2035
  • Figure 97: South Asia & Pacific Market Attractiveness Analysis by Ingredients
  • Figure 98: South Asia & Pacific Market Value Share and BPS Analysis by Form, 2025 and 2035
  • Figure 99: South Asia & Pacific Market Y-o-Y Growth Comparison by Form, 2025-2035
  • Figure 100: South Asia & Pacific Market Attractiveness Analysis by Form
  • Figure 101: South Asia & Pacific Market Value Share and BPS Analysis by Distribution Channel, 2025 and 2035
  • Figure 102: South Asia & Pacific Market Y-o-Y Growth Comparison by Distribution Channel, 2025-2035
  • Figure 103: South Asia & Pacific Market Attractiveness Analysis by Distribution Channel
  • Figure 104: Middle East and Africa Market Value Share and BPS Analysis by Country, 2025 and 2035
  • Figure 105: Middle East and Africa Market Value Share and BPS Analysis by Species, 2025 and 2035
  • Figure 106: Middle East and Africa Market Y-o-Y Growth Comparison by Species, 2025-2035
  • Figure 107: Middle East and Africa Market Attractiveness Analysis by Species
  • Figure 108: Middle East and Africa Market Value Share and BPS Analysis by Ingredients, 2025 and 2035
  • Figure 109: Middle East and Africa Market Y-o-Y Growth Comparison by Ingredients, 2025-2035
  • Figure 110: Middle East and Africa Market Attractiveness Analysis by Ingredients
  • Figure 111: Middle East and Africa Market Value Share and BPS Analysis by Form, 2025 and 2035
  • Figure 112: Middle East and Africa Market Y-o-Y Growth Comparison by Form, 2025-2035
  • Figure 113: Middle East and Africa Market Attractiveness Analysis by Form
  • Figure 114: Middle East and Africa Market Value Share and BPS Analysis by Distribution Channel, 2025 and 2035
  • Figure 115: Middle East and Africa Market Y-o-Y Growth Comparison by Distribution Channel, 2025-2035
  • Figure 116: Middle East and Africa Market Attractiveness Analysis by Distribution Channel
  • Figure 117: Global Market - Tier Structure Analysis
  • Figure 118: Global Market - Company Share Analysis

Frequently Asked Questions

How big is the marine feed market in 2025?

The global marine feed market is estimated to be valued at USD 42.6 billion in 2025.

What will be the size of marine feed market in 2035?

The marine feed market size is projected to reach USD 83.0 billion by 2035.

How much will the marine feed market growth between 2025 and 2035?

The marine feed market is expected to grow at a 6.9% CAGR between 2025 and 2035.

Which species segment is projected to lead in the marine feed market in 2025?

The fish segment is projected to lead in the marine feed market with 69% market share in 2025.

Which form type is projected to lead in the marine feed market in 2025?

The pellet form is projected to lead in the marine feed market with 62.7% market share in 2025.

Explore Similar Insights

Future Market Insights

Marine Feed Market