Reports

- Global Locations -

Headquarters

Future Market Insights, Inc.

Christiana Corporate, 200
Continental Drive, Suite 401,
Newark, Delaware - 19713,
United States

T: +1-347-918-3531

Americas

Future Market Insights, Inc.

616 Corporate Way, Suite 2-9018,
Valley Cottage, NY 10989, United States

MEA

Future Market Insights

1602-6 Jumeirah Bay X2 Tower, Plot No: JLT-PH2-X2A,
Jumeirah Lakes Towers, Dubai,
United Arab Emirates

Europe

Future Market Insights

3rd Floor, 207 Regent Street,
W1B 3HH London
United Kingdom

T: + 44 (0) 20 8123 9659

Asia Pacific

Future Market Insights

IndiaLand Global Tech Park, Unit UG-1, Behind Grand HighStreet, Phase 1, Hinjawadi, MH, Pune – 411057, India

Marine-derived Protein Market Outlook from 2023 to 2033

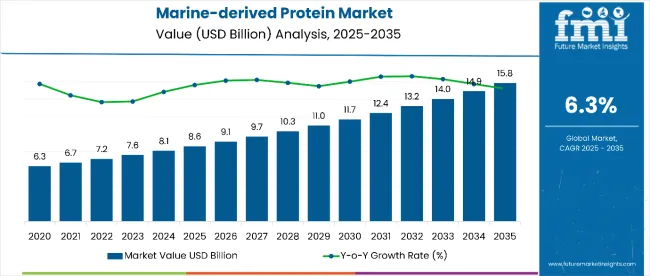
The global marine-derived protein market size is projected to witness substantial growth, increasing from US$ 7,634.9 million in 2023 to US$ 20,190.0 million by 2033. The market is expected to surge at a CAGR of 6.3% during the projection period 2023 to 2033.

Attributes Key Insights
Estimated Marine-derived Protein Market Size (2023E) US$ 7,634.9 million
Projected Marine-derived Protein Market Value (2033F) US$ 20,190.0 million
Value-based CAGR (2023 to 2033) 6.3%

Don't pay for what you don't need

Customize your report by selecting specific countries or regions and save 30%!

Key Trends Listed in the Marine-derived Protein Market Report

  • Rising demand for sustainable protein sources drives growth in the marine-derived protein market.
  • Technological advancements enhance the extraction and purity of marine proteins.
  • Increased focus on health and wellness boosts consumption of omega-3-rich marine-derived proteins.
  • The versatility of marine proteins expands applications in food, beverages, and nutritional supplements.
  • The growing aquaculture industry ensures a consistent supply of high-quality marine-derived proteins.
  • Consumer preference for eco-friendly diets fuels the adoption of marine-derived proteins.
  • Regulatory emphasis on sustainable fishing practices shapes the marine-derived protein market.
  • Increased research and development drive the discovery of new marine protein sources and formulations.
  • Global awareness of overfishing impacts spurs interest in marine-derived protein as a responsible choice.

The marine-derived protein market represents a pivotal paradigm shift in the global food industry, embodying a harmonious blend of nutrition, sustainability, and innovation. Derived from diverse marine sources such as fish, algae, and shellfish, these proteins have emerged as frontrunners in pursuing sustainable, high-quality dietary options.

With an ever-increasing focus on environmental conservation and healthier eating habits, marine-based proteins have garnered immense attention from consumers and manufacturers. In recent years, a surge in health-conscious consumerism and environmental awareness has significantly contributed to the market's expansion.

Marine-based proteins offer a plethora of essential nutrients, including omega-3 fatty acids, vitamins, and minerals, making them an ideal choice for health-conscious individuals. Additionally, their low ecological impact and efficient production methods have positioned them as eco-friendly alternatives to traditional livestock-based proteins. Manufacturers in the marine-derived protein market are actively investing in research and development, exploring innovative extraction techniques and product formulations.

Their efforts are geared toward enhancing the nutritional profile, taste, and texture of marine-based protein products. Moreover, strategic collaborations with marine biologists and environmental scientists underscore the industry's commitment to sustainable practices.

The versatility of marine-derived protein allows their incorporation into an extensive range of food products, from supplements and functional foods to culinary delicacies, catering to diverse consumer preferences. As the global population continues to gravitate toward sustainable living and healthier dietary choices, the marine-derived protein market is not only meeting but also shaping these evolving demands, heralding a new era in the food industry.

2018 to 2022 Vs. 2023 to 2033 Marine-derived Protein Market Outlook

Between 2018 and 2022, the global marine-derived protein market experienced a transformative phase marked by unprecedented growth and a shift toward sustainable dietary choices. During this period, the market witnessed a substantial uptick in sales, surging from US$ 4,580.1 million in 2018 to US$ 6,868.3 million in 2022. This surge was propelled by rising consumer awareness regarding the health benefits of marine-derived protein and its eco-friendly nature.

Historical Value (2018) US$ 4,580.1 million
Historical Value (2022) US$ 6,868.3 million

Consumers, increasingly conscious of the environmental impact of traditional livestock farming, turned to marine-derived protein sourced from fish, seaweed, and other organisms. These proteins offered a dual advantage - a rich source of essential nutrients and a significantly lower ecological footprint.

Advancements in processing technologies led to the creation of a diverse range of marine-derived protein products, including supplements, powders, and ready-to-eat foods, further amplifying market growth. Looking ahead, the market is poised for continued expansion from 2023 to 2033.

Projections suggest a sustained increase in demand, with the market's value expected to reach US$ 20,190.0 million by 2033. This growth will be bolstered by ongoing research and development initiatives to enhance the taste, texture, and nutritional profiles of marine-derived protein products.

Collaborations between manufacturers, research institutions, and government bodies are anticipated to drive innovation, ensuring the market's competitiveness and promoting sustainable practices in marine-derived protein production. As the world embraces eco-conscious consumption, marine-derived protein are positioned as a vital component of the future of sustainable nutrition.

Nandini Roy Choudhury

Principal Consultant

Talk to Analyst

Find your sweet spots for generating winning opportunities in this market.

Latest Trends and Opportunities in the Marine-derived Protein Market

Attributes Key Factors
Marine-Derived Protein Market Trends
  • Interest in Sustainable and Alternative Sources: As worries about how animal agriculture affects the environment grow, so does the demand for sustainable and alternative protein sources. When opposed to typical cattle, marine-derived proteins such as those from fish and other aquatic organisms are thought to be more environmentally benign.
  • Nutritional Advantages: Proteins originating from marine sources are frequently abundant in important amino acids, omega-3 fatty acids, and other good elements for human health. They are regarded as an essential supply of premium protein for a well-balanced diet.
  • Growing Applications: Nutraceuticals, cosmetics, animal feed, food and drink, and medicines are just a few industries that employ proteins obtained from marine sources. They are entering several goods, such as beauty items, functional meals, and protein supplements.
  • Technological Developments: Technological developments have made it easier to extract and process proteins originating from marine sources, resulting in increased yields, better quality, and the creation of novel product formulations.
Growth Hindrances
  • Environmental Concerns and Overfishing: Stricter laws governing fishing methods have been implemented in response to worries about overfishing and its effects on marine ecosystems. This can restrict the supply of raw materials needed to produce proteins obtained from marine sources.
  • Supply Chain Interruptions: Events connected to the weather, transportation problems, and geopolitical conflicts can all impact the marine-derived protein market. These interruptions can cause uneven supply and volatile prices.
  • High Production Costs: It can be costly to extract and process proteins produced from marine sources, particularly for specialized and high-quality goods. This can affect how affordable proteins produced from marine sources are compared to other protein sources.
Upcoming Opportunities
  • Interest in Functional Foods and Nutraceuticals: There is significant potential in the market for proteins derived from marine sources due to the growing consumer interest in these products, which provide health benefits beyond a simple diet. The nutritional use of these proteins, which include omega-3 fatty acids and necessary amino acids, makes them valuable.
  • Use in Sports Nutrition: Due to its high-quality protein content and potential advantages for muscle repair and performance development, the sports nutrition industry presents a promising market for proteins derived from marine sources. This covers uses in protein bars, drinks, and powders for athletes and fitness fanatics.

Overview of Adjacent Marine-derived Protein Markets

The section covers a comparative view of three markets similar to the global marine-derived protein market. As per estimations, the fish protein isolate market would lead out of the three markets.

The market for marine-derived protein is set to surge at a CAGR of 6.3% by 2033. The fish protein concentrate and fish protein isolate markets are projected to rise at CAGRs of 6.9% and 7.3%, respectively, from 2023 to 2033.

The fish protein concentrate market is witnessing growth due to the rising demand for high-quality protein sources in several food products. Fish protein concentrate, with its excellent amino acid profile and nutritional benefits, is used to fortify a wide range of food items, including snacks, functional beverages, and pet food.

The growing awareness of the health benefits of fish-derived protein is driving the fish protein isolate market. As consumers seek protein supplements with superior digestibility, fish protein isolate stands out as an excellent option. Its applications in sports nutrition, dietary supplements, and functional foods would propel market growth.

Marine-derived Protein Market:

Attributes Marine-derived Protein Market
CAGR (2023 to 2033) 6.3%
Growth Factor The industry is progressively trying to produce hydrolysates, isolates, concentrates, peptides, and value-added products from proteins produced from marine sources. These specialty goods address particular dietary requirements and uses.
Restraining Factor Despite the nutritional advantages of proteins produced from marine sources, consumers and stakeholders in the food sector would need to be made aware of these benefits. To encourage their use, market education and initiatives to raise awareness can be required.
Opportunity Proteins originating from marine sources can serve as valuable components in food and drinks, such as baked goods, sauces, snacks, and dairy substitutes. They can improve these goods' functional qualities and nutritional profiles.
Key Trends More customers are realizing the advantages of using products derived from seafood for their health. This awareness is driving product demand incorporating proteins obtained from marine sources.

Fish Protein Concentrate Market:

Attributes Fish Protein Concentrate Market
CAGR (2023 to 2033) 6.9%
Growth Factor Increased protein consumption among consumers due to improved health consciousness and the adoption of fitness goals
Restraining Factor The rising demand for plant-based proteins such as soy, pea, and other substitutes threatens marine-derived proteins. Customers looking for environmentally responsible and sustainable protein sources frequently find plant-based solutions appealing.
Opportunity The increasing acceptance of fish protein concentrates in cosmetic and personal care products presents an opportunity to innovate more.
Key Trends 'On-the-go snacking' is a rising consumer trend that manufacturers are witnessing, driving the fish protein concentrate market.

Fish Protein Isolate Market:

Attributes Fish Protein Isolate Market
CAGR (2023 to 2033) 7.3%
Growth Factor The rising interest in adding omega-3 fatty acids into meals, combined with a reduction in sodium content, is a growth factor in the fish protein isolate market.
Restraining Factor Proteins originating from marine sources can or cannot be accepted and adopted depending on consumer preferences. A handful of customers can be allergic to seafood, or they can be worried about the flavor or smell of products derived from the sea.
Opportunity Increased research and development due to rivalry among firms at both the global and regional levels would provide opportunities to diversify product categories.
Key Trends The growing trend for offering low-cost protein has made the market extremely competitive. To acquire competitive strength, key players are relying on strategic cooperation and acquisitions.

Get the data you need at a Fraction of the cost

Personalize your report by choosing insights you need
and save 40%!

Country-wise Insights

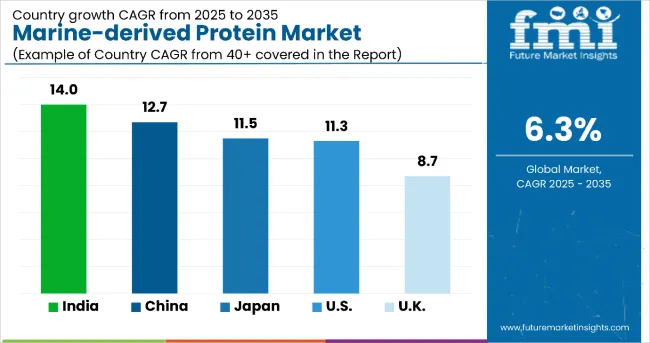
In the table below, the CAGRs of the top three countries are given for the review period 2023 to 2033. The United States is expected to remain dominant by exhibiting a CAGR of 8.5%. Australia and China are anticipated to follow with CAGRs of 4.2% and 8.2%, respectively.

Countries CAGR
United States 8.5%
China 8.2%
Australia 4.2%

Health Consciousness and Sustainability Drive Sales in the United States

The marine-derived protein market in the United States is poised to exhibit a CAGR of 8.5% in the estimated period. The country is set to reach a market valuation of US$ 7,470.3 million during the forecast period.

Growing awareness about the health benefits of marine-derived proteins, such as high-quality amino acids and omega-3 fatty acids, has led to their popularity among health-conscious consumers. The rising demand for sustainable and eco-friendly protein sources has driven the adoption of marine-derived proteins, aligning with the environmental concerns of consumers.

Innovations in food processing technology have improved the taste and texture of marine-derived protein products, making them more appealing to a wider consumer base. Moreover, the trend for alternative protein sources has contributed to the surging sales of marine-derived proteins, offering a viable option for those seeking non-animal protein alternatives.

Collaborations between food manufacturers and seafood industries have resulted in diverse product offerings. These would help in enhancing consumer choices and boosting sales in the marine-derived protein market in the United States.

Collaborative Innovations Spurring China's Marine-derived Protein Market

China’s fast urbanization and increased disposable income have resulted in the marine-derived protein market growing at 8.2% from 2023 to 2033. The country is anticipated to reach a market size of US$ 5,410.9 million in 2033.

In China, collaborative initiatives between food manufacturers and seafood companies have significantly diversified marine-derived protein product offerings. These partnerships have led to the development of a wide array of innovative and appealing products derived from marine sources.

By combining expertise from both sectors, these collaborations have optimized processing techniques, ensuring the production of high-quality, flavorful, and nutritionally rich marine-derived protein items. Consumers now have access to a diverse range of marine-derived protein products, including fish protein concentrates, fish hydrolysates, and fish protein isolates, each tailored to meet varying dietary needs.

The expanded variety has resonated with consumers, driving market growth. Moreover, these collaborative efforts have enhanced supply chains, making marine-derived protein more readily available to a broader audience. In essence, these collaborations have not only increased product variety but also improved product accessibility and quality.

The combined effort between food manufacturers and seafood industries has played a pivotal role in propelling the marine-derived protein market in China. These would help in meeting the demands of health-conscious consumers while contributing significantly to the market's expansion.

Expanding Health and Fitness Industry Creating Opportunities in Australia

Australia's increasing emphasis on well-being is expected to help the marine-derived protein market witness a CAGR of 4.2% through 2033. It will likely reach a market valuation of US$ 1,514.3 million by 2033.

The rise in fitness and health-conscious consumers seeking natural and nutrient-rich protein sources has created a growing demand for marine-derived proteins. Furthermore, the versatility of marine proteins in several food applications, including sports nutrition supplements and functional foods, has expanded its market presence.

The ongoing research and development efforts in creating innovative marine protein-based products tailored to consumer preferences have played a significant role in driving sales. Furthermore, collaborations between food companies and international markets have opened up export opportunities, driving marine-derived protein sales in the country.

Demand in the United Kingdom Surges from Nutraceutical Companies

The United Kingdom has witnessed a rising interest in sustainable and alternative protein sources, similar to several other countries. Marine-derived proteins are becoming increasingly popular since they are thought to be more ecologically friendly than regular livestock.

The nutritional advantages of marine-derived proteins, such as their high protein content, necessary amino acids, and omega-3 fatty acids, are becoming more known to consumers in the United Kingdom. This awareness is driving the demand for goods containing these components.

Several food and beverage products, such as seafood-based goods, protein supplements, functional foods, and nutraceuticals, contain proteins obtained from marine sources. Their nutritional worth and functional qualities make them valuable. The need for nutraceuticals and practical meals, which provide health advantages over essential diet, has prompted the use of marine-derived proteins in several goods aimed at health-conscious consumers.

Strict Food Safety and Quality Norms in India to Propel Sales

India is pursuing research and development to extract and process marine-derived proteins more efficiently, as well as to uncover new sources and uses for them. To improve research, development, and market reach, companies in India’s marine-derived protein market frequently collaborate with technology providers, academic institutions, and other stakeholders.

Compliance with several regulatory frameworks and criteria concerning food safety, quality, and sustainability is vital for businesses operating in India’s marine-derived protein market. Sustainable fishing and aquaculture methods are highly valued in India, reflected in the procurement and manufacturing of proteins obtained from the sea. To meet the increasing demand, both domestic and foreign competitors are supplying products in the competitive market for proteins derived from marine sources in India.

Category-wise Insights

The table below signifies leading sub-categories under source, end-user, and extraction techniques in the marine-derived protein market. Fish-derived protein is expected to dominate the market for marine-derived proteins to reach US$ 5,532.1 million by 2033. Under the extraction technique category, the enzymatic hydrolysis segment is projected to attain a valuation of US$ 5,572.4 million by 2033.

Segment Value (2033)
Fish-derived Proteins (Source) US$ 5,532.1 million
Food and Beverage Industry (End-user) US$ 6,258.9 million
Enzymatic Hydrolysis (Extraction Technique) US$ 5,572.4 million

Fish-derived Proteins Dominate with Superior Nutrition and Versatility

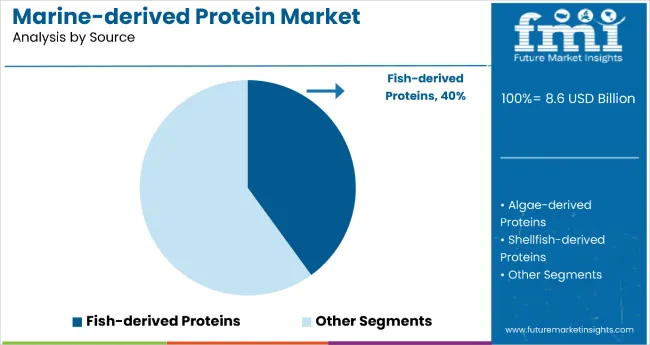
Based on the source, the fish-derived proteins segment is expected to hold a market share of 27.4% by 2033. It is anticipated to reach a market valuation of US$ 5,532.1 million by 2033.

Fish-derived proteins are renowned for their high-quality amino acids and essential fatty acids, especially omega-3, which benefit overall health. Additionally, fish proteins offer a neutral taste, making them ideal for several culinary applications.

Algae-derived proteins, shellfish-derived proteins, and marine invertebrate proteins, although valuable, often have distinct flavors and textures that can limit their widespread use in the food industry. This is projected to contribute to the higher preference for fish-derived proteins.

Marine-derived Proteins Driving Innovation in the Food and Beverage Industry

Based on end-users, the food and beverage industry is expected to hold a market share of 31.0% to reach a valuation of US$ 6,258.9 million by 2033. The food and beverage industry experiences a significant demand for marine-derived proteins due to their potential to enhance nutritional content without altering the taste drastically. Proteins from marine sources are set to be used in functional foods and beverages, catering to health-conscious consumers seeking natural protein supplements.

While the pharmaceutical cosmetics and skincare industries also benefit from marine proteins, their applications are more specialized. Pharmaceuticals would require specific formulations. Cosmetic applications necessitate refined, often specialized, protein extracts. Hence, the broader utility of marine proteins in the food and beverage industry drives their demand.

Enzymatic Hydrolysis Revolutionizing Marine Protein Extraction

Based on the extraction technique, the enzymatic hydrolysis segment is expected to hold a market share of 27.6% and attain a valuation of US$ 5,572.4 million by 2033. Enzymatic hydrolysis stands out as a widely preferred extraction method due to its efficiency and ability to preserve protein integrity. This method utilizes enzymes to break down proteins into peptides and amino acids, ensuring a higher yield of bioactive compounds.

Compared to supercritical fluid extraction, high-pressure processing (HPP), ultrasound-assisted extraction, and microwave-assisted extraction, enzymatic hydrolysis balances effectiveness and cost. It maintains the bioactivity of proteins and peptides, making them suitable for several applications in food, beverages, and supplements. The method's gentle processing conditions also prevent the denaturation of sensitive compounds, making it the preferred choice for extracting valuable proteins from marine sources.

Competitive Landscape

The marine-derived protein market has a diverse and dynamic competitive landscape. Leading companies specializing in diverse fields are focusing on research and development, sustainable sourcing, and new formulations.

Leading companies emphasize environmentally friendly practices and product certifications. They are aiming to satisfy the increased demand for natural and sustainable ingredients. Additionally, they would try to preserve their market position and capitalize on the growing demand by focusing on quality, innovation, and matching customer preferences.

For instance,

  • In 2022, Pioneer Points Partners and Verdane acquired Scanbio Marine Group to create one of Europe's leading aquaculture waste management companies.
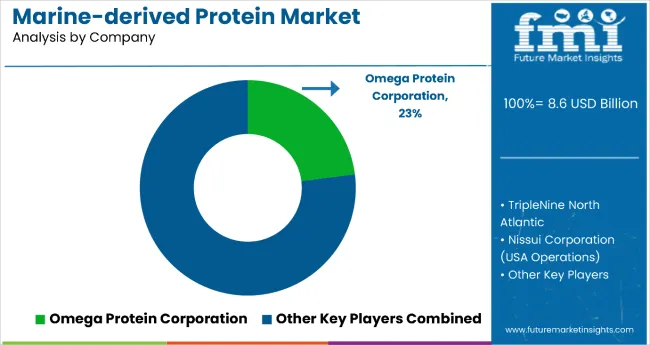
  • In 2022, Cooke Inc., a seafood corporation, acquired Omega Protein Corporation, a Houston-based company. It would aid with the company's expanding supply side of business. It would also support the company's growth strategy as a leader in seafood production.
  • In 2020, BlueNalu, a California-based seafood product manufacturer, announced its collaboration with Nutreco, an aquafeed manufacturer. This collaboration is expected to assist BlueNalu in strengthening its position in the seafood manufacturing business.

Scope of the Report

Attribute Details
Estimated Marine-derived Protein Market Size (2023E) US$ 7,634.9 million
Projected Marine-derived Protein Market Value (2033F) US$ 20,190.0 million
Value-based CAGR (2023 to 2033) 6.3%
Forecast Period 2023 to 2033
Historical Data Available for 2018 to 2022
Market Analysis US$ million for Value, MT for Volume
Key Regions Covered North America, Latin America, Europe, East Asia, South Asia, and the Middle East & Africa
Key Countries Covered United States, Canada, Brazil, Mexico, Germany, United Kingdom, France, Italy, Spain, Nordic, Russia, Poland, China, India, Thailand, Indonesia, Australia and New Zealand, Japan, GCC countries, North Africa, South Africa, and others.
Key Segments Covered Source, End-user, Type, Extraction Technique, and Region
Key Companies Profiled
  • Omega Protein Corporation
  • Aroma NZ Ltd.
  • Hofseth BioCare ASA
  • GC Rieber Oils
  • Scanbio Marine Group
  • Golden Omega
  • Marine Ingredients
  • Sea Run Holdings Inc.
  • Arctic Nutrition AS
  • CP Kelco
  • Other Players
Report Coverage Market Forecast, Company Share Analysis, Competition Intelligence, Drivers Restraints Opportunity Trends Analysis, Market Dynamics and Challenges, and Strategic Growth Initiatives

Marine-derived Protein Market Segmentation by Category

By Source:

  • Fish-derived Proteins
  • Algae-derived Proteins
  • Shellfish-derived Proteins
  • Marine Invertebrate Proteins

By End-user:

  • Food and Beverage Industry
  • Pharmaceutical Industry
  • Cosmetics and Skincare Industry

By Extraction Technique:

  • Enzymatic Hydrolysis
  • Supercritical Fluid Extraction
  • High-Pressure Processing (HPP)
  • Ultrasound-assisted Extraction
  • Microwave-assisted Extraction

By Type:

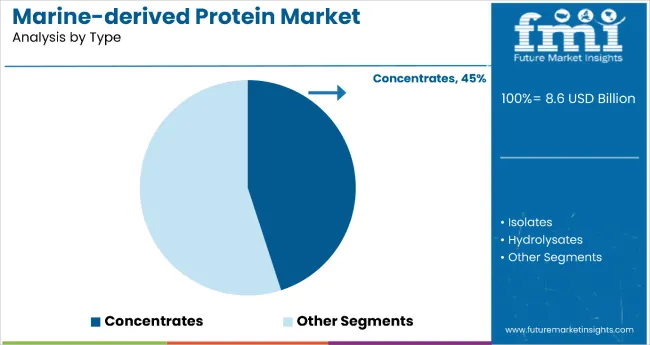
  • Concentrates
  • Isolates
  • Hydrolysates

By Region:

  • North America
  • Latin America
  • Europe
  • East Asia
  • South Asia
  • Middle East & Africa

Frequently Asked Questions

At what rate will the marine-derived protein market grow by 2033?

By 2033, the marine-derived protein market is expected to rise at a CAGR of 6.3%.

What is the estimated value of the marine-derived protein market in 2023?

Marine-derived protein market is estimated to reach US$ 7,634.9 million in 2023.

What is the expected value of the marine-derived protein market by 2033?

By 2033, the market is expected to be worth US$ 20,190.0 million.

Which source is expected to lead the market by 2033?

Based on the source, the fish-derived proteins segment is expected to reach US$ 5,532.1 million by 2033.

Who are the key players in the marine-derived protein market?

Leading players include Omega Protein Corporation, Aroma NZ Ltd., and Hofseth BioCare ASA.

Table of Content

1. Executive Summary

    1.1. Global Market Outlook

    1.2. Demand Side Trends

    1.3. Supply Side Trends

    1.4. Technology Roadmap

    1.5. Analysis and Recommendations

2. Market Overview

    2.1. Market Coverage / Taxonomy

    2.2. Market Definition

3. Market Dynamics

    3.1. Drivers

        3.1.1. Supply Side Drivers

        3.1.2. Demand Side drivers

        3.1.3. Economic Side Drivers

    3.2. Restraints

    3.3. Opportunity

    3.4. Market trends By Region

    3.5. Forecast Factors - Relevance and Impact

    3.6. Regulations and Policies

4. Global Market-Pricing Analysis

    4.1. Price Point Assessment by Region

        4.1.1. Manufacturer-Level Pricing

        4.1.2. Distributor Level Pricing

    4.2. Price Point Assessment By Source

    4.3. Price Forecast till 2033

5. Value Chain Analysis

    5.1. Operating margins at each node of the supply chain

    5.2. List of Active Market Participants

6. Global Market Size (in Value (US$ million) and Volume (MT) Analysis 2018 to 2022 and Forecast, 2023 to 2033

    6.1. Historical Market Size (in Value (US$ million) and Volume (MT) Analysis, 2018 to 2022

    6.2. Current and Future Market Size (in Value (US$ million) and Volume (MT) Analysis, 2023 to 2033

        6.2.1. Y-o-Y Growth Trend Analysis

        6.2.2. Absolute $ Opportunity Analysis

7. Global Market Analysis 2018 to 2022 and Forecast 2023 to 2033, By Source

    7.1. Introduction / Key Findings

    7.2. Historical Market Size (in Value (US$ million) and Volume (MT) Analysis By Source, 2018 to 2022

    7.3. Current and Future Market Size (in Value (US$ million) and Volume (MT) Analysis and Forecast By Source, 2023 to 2033

        7.3.1. Fish-derived Proteins

        7.3.2. Algae-derived Proteins

        7.3.3. Shellfish-derived Proteins

        7.3.4. Marine Invertebrate Proteins

    7.4. Market Attractiveness Analysis By Source

8. Global Market Analysis 2018 to 2022 and Forecast 2023 to 2033, by Type

    8.1. Introduction / Key Findings

    8.2. Historical Market Size (in Value (US$ million) and Volume (MT) Analysis By Type, 2018 to 2022

    8.3. Current and Future Market Size (in Value (US$ million) and Volume (MT) Analysis and Forecast By Type, 2023 to 2033

        8.3.1. Concentrates

        8.3.2. Isolates

        8.3.3. Hydrolysates

    8.4. Market Attractiveness Analysis By Type

9. Global Market Analysis 2018 to 2022 and Forecast 2023 to 2033, by End-user

    9.1. Introduction / Key Findings

    9.2. Historical Market Size (in Value (US$ million) and Volume (MT) Analysis By End-user, 2018 to 2022

    9.3. Current and Future Market Size (in Value (US$ million) and Volume (MT) Analysis and Forecast By End-user, 2023 to 2033

        9.3.1. Food and Beverage Industry

        9.3.2. Pharmaceutical Industry

        9.3.3. Cosmetics and Skincare Industry

    9.4. Market Attractiveness Analysis By End-user

10. Global Market Analysis 2018 to 2022 and Forecast 2023 to 2033, by Extraction Technique

    10.1. Introduction / Key Findings

    10.2. Historical Market Size (in Value (US$ million) and Volume (MT) Analysis By Extraction Technique, 2018 to 2022

    10.3. Current and Future Market Size (in Value (US$ million) and Volume (MT) Analysis and Forecast By Extraction Technique, 2023 to 2033

        10.3.1. Enzymatic Hydrolysis

        10.3.2. Supercritical Fluid Extraction

        10.3.3. High-Pressure Processing (HPP)

        10.3.4. Ultrasound-assisted Extraction

        10.3.5. Microwave-assisted Extraction

    10.4. Market Attractiveness Analysis By Extraction Technique

11. Global Market Analysis 2018 to 2022 and Forecast 2023 to 2033, by Region

    11.1. Introduction

    11.2. Historical Market Size (in Value (US$ million) and Volume (MT) Analysis By Region, 2018 to 2022

    11.3. Current Market Size (in Value (US$ million) and Volume (MT) Analysis and Forecast By Region, 2023 to 2033

        11.3.1. North America;

        11.3.2. Latin America

        11.3.3. Europe

        11.3.4. East Asia

        11.3.5. South Asia

        11.3.6. Oceania

        11.3.7. Middle East and Africa

    11.4. Market Attractiveness Analysis By Region

12. North America Market Analysis 2018 to 2022 and Forecast 2023 to 2033

    12.1. Introduction

    12.2. Pricing Analysis

    12.3. Historical Market Size (US$ million) and Volume Trend Analysis By Market Taxonomy, 2018 to 2022

    12.4. Market Size (US$ million) and Volume Forecast By Market Taxonomy, 2023 to 2033

        12.4.1. By Country

            12.4.1.1. United states

            12.4.1.2. Canada

        12.4.2. By Source

        12.4.3. By Type

        12.4.4. By End-user

        12.4.5. By Extraction Technique

    12.5. Market Attractiveness Analysis

        12.5.1. By Country

        12.5.2. By Source

        12.5.3. By Type

        12.5.4. By End-user

        12.5.5. By Extraction Technique

    12.6. Key Takeaways

13. Latin America Market Analysis 2018 to 2022 and Forecast 2023 to 2033

    13.1. Introduction

    13.2. Pricing Analysis

    13.3. Historical Market Size (US$ million) and Volume Trend Analysis By Market Taxonomy, 2018 to 2022

    13.4. Market Size (US$ million) and Volume Forecast By Market Taxonomy, 2023 to 2033

        13.4.1. By Country

            13.4.1.1. Brazil

            13.4.1.2. Mexico

            13.4.1.3. Colombia

            13.4.1.4. Argentina

            13.4.1.5. Rest of Latin America

        13.4.2. By Source

        13.4.3. By Type

        13.4.4. By End-user

        13.4.5. By Extraction Technique

    13.5. Market Attractiveness Analysis

        13.5.1. By Country

        13.5.2. By Source

        13.5.3. By Type

        13.5.4. By End-user

        13.5.5. By Extraction Technique

    13.6. Key Takeaways

14. Europe Market Analysis 2018 to 2022 and Forecast 2023 to 2033

    14.1. Introduction

    14.2. Pricing Analysis

    14.3. Historical Market Size (US$ million) and Volume Trend Analysis By Market Taxonomy, 2018 to 2022

    14.4. Market Size (US$ million) and Volume Forecast By Market Taxonomy, 2023 to 2033

        14.4.1. By Country

            14.4.1.1. Germany

            14.4.1.2. United Kingdom

            14.4.1.3. France

            14.4.1.4. Italy

            14.4.1.5. Spain

            14.4.1.6. BENELUX

            14.4.1.7. Nordic

            14.4.1.8. Russia

            14.4.1.9. Poland

            14.4.1.10. Rest of Europe

        14.4.2. By Source

        14.4.3. By Type

        14.4.4. By End-user

        14.4.5. By Extraction Technique

    14.5. Market Attractiveness Analysis

        14.5.1. By Country

        14.5.2. By Source

        14.5.3. By Type

        14.5.4. By End-user

        14.5.5. By Extraction Technique

    14.6. Key Takeaways

15. East Asia Market Analysis 2018 to 2022 and Forecast 2023 to 2033

    15.1. Introduction

    15.2. Pricing Analysis

    15.3. Historical Market Size (US$ million) and Volume Trend Analysis By Market Taxonomy, 2018 to 2022

    15.4. Market Size (US$ million) and Volume Forecast By Market Taxonomy, 2023 to 2033

        15.4.1. By Country

            15.4.1.1. China

            15.4.1.2. Japan

            15.4.1.3. South Korea

        15.4.2. By Source

        15.4.3. By Type

        15.4.4. By End-user

        15.4.5. By Extraction Technique

    15.5. Market Attractiveness Analysis

        15.5.1. By Country

        15.5.2. By Source

        15.5.3. By Type

        15.5.4. By End-user

        15.5.5. By Extraction Technique

    15.6. Key Takeaways

16. South Asia Market Analysis 2018 to 2022 and Forecast 2023 to 2033

    16.1. Introduction

    16.2. Pricing Analysis

    16.3. Historical Market Size (US$ million) and Volume Trend Analysis By Market Taxonomy, 2018 to 2022

    16.4. Market Size (US$ million) and Volume Forecast By Market Taxonomy, 2023 to 2033

        16.4.1. By Country

            16.4.1.1. India

            16.4.1.2. Thailand

            16.4.1.3. Malaysia

            16.4.1.4. Indonesia

            16.4.1.5. Singapore

            16.4.1.6. Rest of South Asia

        16.4.2. By Source

        16.4.3. By Type

        16.4.4. By End-user

        16.4.5. By Extraction Technique

    16.5. Market Attractiveness Analysis

        16.5.1. By Country

        16.5.2. By Source

        16.5.3. By Type

        16.5.4. By End-user

        16.5.5. By Extraction Technique

    16.6. Key Takeaways

17. Oceania Market Analysis 2018 to 2022 and Forecast 2023 to 2033

    17.1. Introduction

    17.2. Pricing Analysis

    17.3. Historical Market Size (US$ million) and Volume Trend Analysis By Market Taxonomy, 2018 to 2022

    17.4. Market Size (US$ million) and Volume Forecast By Market Taxonomy, 2023 to 2033

        17.4.1. By Country

            17.4.1.1. Australia

            17.4.1.2. New Zealand

        17.4.2. By Source

        17.4.3. By Type

        17.4.4. By End-user

        17.4.5. By Extraction Technique

    17.5. Market Attractiveness Analysis

        17.5.1. By Country

        17.5.2. By Source

        17.5.3. By Type

        17.5.4. By End-user

        17.5.5. By Extraction Technique

    17.6. Key Takeaways

18. Middle East and Africa Market Analysis 2018 to 2022 and Forecast 2023 to 2033

    18.1. Introduction

    18.2. Pricing Analysis

    18.3. Historical Market Size (US$ million) and Volume Trend Analysis By Market Taxonomy, 2018 to 2022

    18.4. Market Size (US$ million) and Volume Forecast By Market Taxonomy, 2023 to 2033

        18.4.1. By Country

            18.4.1.1. United Arab Emirates

            18.4.1.2. Saudi Arabia

            18.4.1.3. Other GCC Countries

            18.4.1.4. North Africa

            18.4.1.5. South Africa

            18.4.1.6. Central Africa

        18.4.2. By Source

        18.4.3. By Type

        18.4.4. By End-user

        18.4.5. By Extraction Technique

    18.5. Market Attractiveness Analysis

        18.5.1. By Country

        18.5.2. By Source

        18.5.3. By Type

        18.5.4. By End-user

        18.5.5. By Extraction Technique

    18.6. Key Takeaways

19. Country-level Market Analysis 

    19.1. United States Market Analysis

        19.1.1. By Source

        19.1.2. By Type

        19.1.3. By End-user

        19.1.4. By Extraction Technique

    19.2. Canada Market Analysis

        19.2.1. By Source

        19.2.2. By Type

        19.2.3. By End-user

        19.2.4. By Extraction Technique

    19.3. Brazil Market Analysis

        19.3.1. By Source

        19.3.2. By Type

        19.3.3. By End-user

        19.3.4. By Extraction Technique

    19.4. Mexico Market Analysis

        19.4.1. By Source

        19.4.2. By Type

        19.4.3. By End-user

        19.4.4. By Extraction Technique

    19.5. Argentina Market Analysis

        19.5.1. By Source

        19.5.2. By Type

        19.5.3. By End-user

        19.5.4. By Extraction Technique

    19.6. Germany Market Analysis

        19.6.1. By Source

        19.6.2. By Type

        19.6.3. By End-user

        19.6.4. By Extraction Technique

    19.7. The United Kingdom Market Analysis

        19.7.1. By Source

        19.7.2. By Type

        19.7.3. By End-user

        19.7.4. By Extraction Technique

    19.8. France Market Analysis

        19.8.1. By Source

        19.8.2. By Type

        19.8.3. By End-user

        19.8.4. By Extraction Technique

    19.9. Italy Market Analysis

        19.9.1. By Source

        19.9.2. By Type

        19.9.3. By End-user

        19.9.4. By Price Range

        19.9.5. By Extraction Technique

    19.10. Spain Market Analysis

        19.10.1. By Source

        19.10.2. By Type

        19.10.3. By End-user

        19.10.4. By Extraction Technique

    19.11. BENELUX Market Analysis

        19.11.1. By Source

        19.11.2. By Type

        19.11.3. By End-user

        19.11.4. By Extraction Technique

    19.12. Nordic Market Analysis

        19.12.1. By Source

        19.12.2. By Type

        19.12.3. By End-user

        19.12.4. By Extraction Technique

    19.13. Russia Market Analysis

        19.13.1. By Source

        19.13.2. By Type

        19.13.3. By End-user

        19.13.4. By Extraction Technique

    19.14. Poland Market Analysis

        19.14.1. By Source

        19.14.2. By Type

        19.14.3. By End-user

        19.14.4. By Extraction Technique

    19.15. China Market Analysis

        19.15.1. By Source

        19.15.2. By Type

        19.15.3. By End-user

        19.15.4. By Extraction Technique

    19.16. Japan Market Analysis

        19.16.1. By Source

        19.16.2. By Type

        19.16.3. By End-user

        19.16.4. By Extraction Technique

    19.17. South Korea Market Analysis

        19.17.1. By Source

        19.17.2. By Type

        19.17.3. By End-user

        19.17.4. By Extraction Technique

    19.18. India Market Analysis

        19.18.1. By Source

        19.18.2. By Type

        19.18.3. By End-user

        19.18.4. By Extraction Technique

    19.19. Thailand Market Analysis

        19.19.1. By Source

        19.19.2. By Type

        19.19.3. By End-user

        19.19.4. By Extraction Technique

    19.20. Malaysia Market Analysis

        19.20.1. By Source

        19.20.2. By Type

        19.20.3. By End-user

        19.20.4. By Extraction Technique

    19.21. Indonesia Market Analysis

        19.21.1. By Source

        19.21.2. By Type

        19.21.3. By End-user

        19.21.4. By Extraction Technique

    19.22. Vietnam Market Analysis

        19.22.1. By Source

        19.22.2. By Type

        19.22.3. By End-user

        19.22.4. By Extraction Technique

    19.23. Philippines Market Analysis

        19.23.1. By Source

        19.23.2. By Type

        19.23.3. By End-user

        19.23.4. By Extraction Technique

    19.24. Singapore Market Analysis

        19.24.1. By Source

        19.24.2. By Type

        19.24.3. By End-user

        19.24.4. By Extraction Technique

    19.25. Australia Market Analysis

        19.25.1. By Source

        19.25.2. By Type

        19.25.3. By End-user

        19.25.4. By Extraction Technique

    19.26. New Zealand Market Analysis

        19.26.1. By Source

        19.26.2. By Type

        19.26.3. By End-user

        19.26.4. By Extraction Technique

    19.27. Türkiye Market Analysis

        19.27.1. By Source

        19.27.2. By Type

        19.27.3. By End-user

        19.27.4. By Extraction Technique

    19.28. Egypt Market Analysis

        19.28.1. By Source

        19.28.2. By Type

        19.28.3. By End-user

        19.28.4. By Extraction Technique

    19.29. South Africa Market Analysis

        19.29.1. By Source

        19.29.2. By Type

        19.29.3. By End-user

        19.29.4. By Extraction Technique

    19.30. GCC Countries Market Analysis

        19.30.1. By Source

        19.30.2. By Type

        19.30.3. By End-user

        19.30.4. By Extraction Technique

20. Market Structure Analysis

    20.1. Global Market Competition - a Dashboard View

    20.2. Industry Structure Analysis

        20.2.1. % tier 1 market players

        20.2.2. % tier 2 market players

        20.2.3. % tier 3 market players

    20.3. Global Market Company Share Analysis

        20.3.1. For Tier 1 Market Players, 2022

        20.3.2. Company Market Share Analysis of Top 5 Players, By Region

    20.4. Key Participants Market Presence (Intensity Mapping) by Region

21. Competition Analysis

    21.1. Competition Dashboard

    21.2. Competition Benchmarking

    21.3. Competition Deep Dive 

        21.3.1. CP  Kelco

            21.3.1.1. Product Portfolio

            21.3.1.2. Type

            21.3.1.3. Revenue by Market Segments (Product/Channel/Region)

            21.3.1.4. Sales Footprint

            21.3.1.5. Strategy Overview

                21.3.1.5.1. Marketing Strategy

                21.3.1.5.2. Product Strategy Channel Strategy

            21.3.1.6. SWOT Analysis

        21.3.2. Omega Protein Corporation

        21.3.3. Aroma NZ Ltd.

        21.3.4. Hofseth BioCare ASA

        21.3.5. GC Rieber Oils

        21.3.6. Scanbio Marine Group

        21.3.7. Golden Omega

        21.3.8. Marine Ingredients

        21.3.9. Sea Run Holdings Inc.

        21.3.10. Arctic Nutrition AS

        21.3.11. CP Kelco

        21.3.12. Other Players (On Additional Requests)

22. Assumptions and Acronyms Used

23. Research Methodology

List of Tables

Table 1: Global Market Value (US$ million) Forecast by Region, 2018 to 2033

Table 2: Global Market Volume (MT) Forecast by Region, 2018 to 2033

Table 3: Global Market Value (US$ million) Forecast by Source, 2018 to 2033

Table 4: Global Market Volume (MT) Forecast by Source, 2018 to 2033

Table 5: Global Market Value (US$ million) Forecast by Type, 2018 to 2033

Table 6: Global Market Volume (MT) Forecast by Type, 2018 to 2033

Table 7: Global Market Value (US$ million) Forecast by Extraction Technique, 2018 to 2033

Table 8: Global Market Volume (MT) Forecast by Extraction Technique, 2018 to 2033

Table 9: Global Market Value (US$ million) Forecast by End-user, 2018 to 2033

Table 10: Global Market Volume (MT) Forecast by End-user, 2018 to 2033

Table 11: North America Market Value (US$ million) Forecast by Country, 2018 to 2033

Table 12: North America Market Volume (MT) Forecast by Country, 2018 to 2033

Table 13: North America Market Value (US$ million) Forecast by Source, 2018 to 2033

Table 14: North America Market Volume (MT) Forecast by Source, 2018 to 2033

Table 15: North America Market Value (US$ million) Forecast by Type, 2018 to 2033

Table 16: North America Market Volume (MT) Forecast by Type, 2018 to 2033

Table 17: North America Market Value (US$ million) Forecast by Extraction Technique, 2018 to 2033

Table 18: North America Market Volume (MT) Forecast by Extraction Technique, 2018 to 2033

Table 19: North America Market Value (US$ million) Forecast by End-user, 2018 to 2033

Table 20: North America Market Volume (MT) Forecast by End-user, 2018 to 2033

Table 21: Latin America Market Value (US$ million) Forecast by Country, 2018 to 2033

Table 22: Latin America Market Volume (MT) Forecast by Country, 2018 to 2033

Table 23: Latin America Market Value (US$ million) Forecast by Source, 2018 to 2033

Table 24: Latin America Market Volume (MT) Forecast by Source, 2018 to 2033

Table 25: Latin America Market Value (US$ million) Forecast by Type, 2018 to 2033

Table 26: Latin America Market Volume (MT) Forecast by Type, 2018 to 2033

Table 27: Latin America Market Value (US$ million) Forecast by Extraction Technique, 2018 to 2033

Table 28: Latin America Market Volume (MT) Forecast by Extraction Technique, 2018 to 2033

Table 29: Latin America Market Value (US$ million) Forecast by End-user, 2018 to 2033

Table 30: Latin America Market Volume (MT) Forecast by End-user, 2018 to 2033

Table 31: Europe Market Value (US$ million) Forecast by Country, 2018 to 2033

Table 32: Europe Market Volume (MT) Forecast by Country, 2018 to 2033

Table 33: Europe Market Value (US$ million) Forecast by Source, 2018 to 2033

Table 34: Europe Market Volume (MT) Forecast by Source, 2018 to 2033

Table 35: Europe Market Value (US$ million) Forecast by Type, 2018 to 2033

Table 36: Europe Market Volume (MT) Forecast by Type, 2018 to 2033

Table 37: Europe Market Value (US$ million) Forecast by Extraction Technique, 2018 to 2033

Table 38: Europe Market Volume (MT) Forecast by Extraction Technique, 2018 to 2033

Table 39: Europe Market Value (US$ million) Forecast by End-user, 2018 to 2033

Table 40: Europe Market Volume (MT) Forecast by End-user, 2018 to 2033

Table 41: East Asia Market Value (US$ million) Forecast by Country, 2018 to 2033

Table 42: East Asia Market Volume (MT) Forecast by Country, 2018 to 2033

Table 43: East Asia Market Value (US$ million) Forecast by Source, 2018 to 2033

Table 44: East Asia Market Volume (MT) Forecast by Source, 2018 to 2033

Table 45: East Asia Market Value (US$ million) Forecast by Type, 2018 to 2033

Table 46: East Asia Market Volume (MT) Forecast by Type, 2018 to 2033

Table 47: East Asia Market Value (US$ million) Forecast by Extraction Technique, 2018 to 2033

Table 48: East Asia Market Volume (MT) Forecast by Extraction Technique, 2018 to 2033

Table 49: East Asia Market Value (US$ million) Forecast by End-user, 2018 to 2033

Table 50: East Asia Market Volume (MT) Forecast by End-user, 2018 to 2033

Table 51: South Asia Market Value (US$ million) Forecast by Country, 2018 to 2033

Table 52: South Asia Market Volume (MT) Forecast by Country, 2018 to 2033

Table 53: South Asia Market Value (US$ million) Forecast by Source, 2018 to 2033

Table 54: South Asia Market Volume (MT) Forecast by Source, 2018 to 2033

Table 55: South Asia Market Value (US$ million) Forecast by Type, 2018 to 2033

List of Charts

Figure 1: Global Market Value (US$ million) by Source, 2023 to 2033

Figure 2: Global Market Value (US$ million) by Type, 2023 to 2033

Figure 3: Global Market Value (US$ million) by Extraction Technique, 2023 to 2033

Figure 4: Global Market Value (US$ million) by End-user, 2023 to 2033

Figure 5: Global Market Value (US$ million) by Region, 2023 to 2033

Figure 6: Global Market Value (US$ million) Analysis by Region, 2018 to 2033

Figure 7: Global Market Volume (MT) Analysis by Region, 2018 to 2033

Figure 8: Global Market Value Share (%) and BPS Analysis by Region, 2023 to 2033

Figure 9: Global Market Y-o-Y Growth (%) Projections by Region, 2023 to 2033

Figure 10: Global Market Value (US$ million) Analysis by Source, 2018 to 2033

Figure 11: Global Market Volume (MT) Analysis by Source, 2018 to 2033

Figure 12: Global Market Value Share (%) and BPS Analysis by Source, 2023 to 2033

Figure 13: Global Market Y-o-Y Growth (%) Projections by Source, 2023 to 2033

Figure 14: Global Market Value (US$ million) Analysis by Type, 2018 to 2033

Figure 15: Global Market Volume (MT) Analysis by Type, 2018 to 2033

Figure 16: Global Market Value Share (%) and BPS Analysis by Type, 2023 to 2033

Figure 18: Global Market Y-o-Y Growth (%) Projections by Type, 2023 to 2033

Figure 18: Global Market Value (US$ million) Analysis by Extraction Technique, 2018 to 2033

Figure 19: Global Market Volume (MT) Analysis by Extraction Technique, 2018 to 2033

Figure 20: Global Market Value Share (%) and BPS Analysis by Extraction Technique, 2023 to 2033

Figure 22: Global Market Y-o-Y Growth (%) Projections by Extraction Technique, 2023 to 2033

Figure 23: Global Market Value (US$ million) Analysis by End-user, 2018 to 2033

Figure 23: Global Market Volume (MT) Analysis by End-user, 2018 to 2033

Figure 24: Global Market Value Share (%) and BPS Analysis by End-user, 2023 to 2033

Figure 25: Global Market Y-o-Y Growth (%) Projections by End-user, 2023 to 2033

Figure 26: Global Market Attractiveness by Source, 2023 to 2033

Figure 27: Global Market Attractiveness by Type, 2023 to 2033

Figure 28: Global Market Attractiveness by Extraction Technique, 2023 to 2033

Figure 29: Global Market Attractiveness by End-user, 2023 to 2033

Figure 30: Global Market Attractiveness by Region, 2023 to 2033

Figure 31: North America Market Value (US$ million) by Source, 2023 to 2033

Figure 33: North America Market Value (US$ million) by Type, 2023 to 2033

Figure 33: North America Market Value (US$ million) by Extraction Technique, 2023 to 2033

Figure 34: North America Market Value (US$ million) by End-user, 2023 to 2033

Figure 35: North America Market Value (US$ million) by Country, 2023 to 2033

Figure 36: North America Market Value (US$ million) Analysis by Country, 2018 to 2033

Figure 37: North America Market Volume (MT) Analysis by Country, 2018 to 2033

Figure 38: North America Market Value Share (%) and BPS Analysis by Country, 2023 to 2033

Figure 39: North America Market Y-o-Y Growth (%) Projections by Country, 2023 to 2033

Figure 40: North America Market Value (US$ million) Analysis by Source, 2018 to 2033

Figure 41: North America Market Volume (MT) Analysis by Source, 2018 to 2033

Figure 42: North America Market Value Share (%) and BPS Analysis by Source, 2023 to 2033

Figure 43: North America Market Y-o-Y Growth (%) Projections by Source, 2023 to 2033

Figure 44: North America Market Value (US$ million) Analysis by Type, 2018 to 2033

Figure 45: North America Market Volume (MT) Analysis by Type, 2018 to 2033

Figure 46: North America Market Value Share (%) and BPS Analysis by Type, 2023 to 2033

Figure 47: North America Market Y-o-Y Growth (%) Projections by Type, 2023 to 2033

Figure 48: North America Market Value (US$ million) Analysis by Extraction Technique, 2018 to 2033

Figure 49: North America Market Volume (MT) Analysis by Extraction Technique, 2018 to 2033

Figure 50: North America Market Value Share (%) and BPS Analysis by Extraction Technique, 2023 to 2033

Figure 51: North America Market Y-o-Y Growth (%) Projections by Extraction Technique, 2023 to 2033

Figure 52: North America Market Value (US$ million) Analysis by End-user, 2018 to 2033

Figure 53: North America Market Volume (MT) Analysis by End-user, 2018 to 2033

Figure 54: North America Market Value Share (%) and BPS Analysis by End-user, 2023 to 2033

Figure 55: North America Market Y-o-Y Growth (%) Projections by End-user, 2023 to 2033

Figure 56: North America Market Attractiveness by Source, 2023 to 2033

Figure 57: North America Market Attractiveness by Type, 2023 to 2033

Figure 58: North America Market Attractiveness by Extraction Technique, 2023 to 2033

Figure 59: North America Market Attractiveness by End-user, 2023 to 2033

Figure 60: North America Market Attractiveness by Country, 2023 to 2033

Figure 61: Latin America Market Value (US$ million) by Source, 2023 to 2033

Figure 62: Latin America Market Value (US$ million) by Type, 2023 to 2033

Figure 63: Latin America Market Value (US$ million) by Extraction Technique, 2023 to 2033

Figure 64: Latin America Market Value (US$ million) by End-user, 2023 to 2033

Figure 65: Latin America Market Value (US$ million) by Country, 2023 to 2033

Figure 66: Latin America Market Value (US$ million) Analysis by Country, 2018 to 2033

Figure 67: Latin America Market Volume (MT) Analysis by Country, 2018 to 2033

Figure 68: Latin America Market Value Share (%) and BPS Analysis by Country, 2023 to 2033

Figure 69: Latin America Market Y-o-Y Growth (%) Projections by Country, 2023 to 2033

Figure 70: Latin America Market Value (US$ million) Analysis by Source, 2018 to 2033

Figure 71: Latin America Market Volume (MT) Analysis by Source, 2018 to 2033

Figure 72: Latin America Market Value Share (%) and BPS Analysis by Source, 2023 to 2033

Figure 73: Latin America Market Y-o-Y Growth (%) Projections by Source, 2023 to 2033

Figure 74: Latin America Market Value (US$ million) Analysis by Type, 2018 to 2033

Figure 75: Latin America Market Volume (MT) Analysis by Type, 2018 to 2033

Figure 76: Latin America Market Value Share (%) and BPS Analysis by Type, 2023 to 2033

Figure 77: Latin America Market Y-o-Y Growth (%) Projections by Type, 2023 to 2033

Figure 78: Latin America Market Value (US$ million) Analysis by Extraction Technique, 2018 to 2033

Figure 79: Latin America Market Volume (MT) Analysis by Extraction Technique, 2018 to 2033

Figure 80: Latin America Market Value Share (%) and BPS Analysis by Extraction Technique, 2023 to 2033

Figure 81: Latin America Market Y-o-Y Growth (%) Projections by Extraction Technique, 2023 to 2033

Figure 82: Latin America Market Value (US$ million) Analysis by End-user, 2018 to 2033

Figure 83: Latin America Market Volume (MT) Analysis by End-user, 2018 to 2033

Figure 84: Latin America Market Value Share (%) and BPS Analysis by End-user, 2023 to 2033

Figure 85: Latin America Market Y-o-Y Growth (%) Projections by End-user, 2023 to 2033

Figure 86: Latin America Market Attractiveness by Source, 2023 to 2033

Figure 87: Latin America Market Attractiveness by Type, 2023 to 2033

Figure 88: Latin America Market Attractiveness by Extraction Technique, 2023 to 2033

Figure 89: Latin America Market Attractiveness by End-user, 2023 to 2033

Figure 90: Latin America Market Attractiveness by Country, 2023 to 2033

Figure 91: Europe Market Value (US$ million) by Source, 2023 to 2033

Figure 92: Europe Market Value (US$ million) by Type, 2023 to 2033

Figure 93: Europe Market Value (US$ million) by Extraction Technique, 2023 to 2033

Figure 94: Europe Market Value (US$ million) by End-user, 2023 to 2033

Figure 95: Europe Market Value (US$ million) by Country, 2023 to 2033

Figure 96: Europe Market Value (US$ million) Analysis by Country, 2018 to 2033

Figure 97: Europe Market Volume (MT) Analysis by Country, 2018 to 2033

Figure 98: Europe Market Value Share (%) and BPS Analysis by Country, 2023 to 2033

Figure 99: Europe Market Y-o-Y Growth (%) Projections by Country, 2023 to 2033

Figure 100: Europe Market Value (US$ million) Analysis by Source, 2018 to 2033

Figure 101: Europe Market Volume (MT) Analysis by Source, 2018 to 2033

Figure 102: Europe Market Value Share (%) and BPS Analysis by Source, 2023 to 2033

Figure 103: Europe Market Y-o-Y Growth (%) Projections by Source, 2023 to 2033

Figure 104: Europe Market Value (US$ million) Analysis by Type, 2018 to 2033

Figure 105: Europe Market Volume (MT) Analysis by Type, 2018 to 2033

Figure 106: Europe Market Value Share (%) and BPS Analysis by Type, 2023 to 2033

Figure 107: Europe Market Y-o-Y Growth (%) Projections by Type, 2023 to 2033

Figure 108: Europe Market Value (US$ million) Analysis by Extraction Technique, 2018 to 2033

Figure 109: Europe Market Volume (MT) Analysis by Extraction Technique, 2018 to 2033

Figure 110: Europe Market Value Share (%) and BPS Analysis by Extraction Technique, 2023 to 2033

Figure 111: Europe Market Y-o-Y Growth (%) Projections by Extraction Technique, 2023 to 2033

Figure 112: Europe Market Value (US$ million) Analysis by End-user, 2018 to 2033

Figure 113: Europe Market Volume (MT) Analysis by End-user, 2018 to 2033

Figure 114: Europe Market Value Share (%) and BPS Analysis by End-user, 2023 to 2033

Figure 115: Europe Market Y-o-Y Growth (%) Projections by End-user, 2023 to 2033

Figure 116: Europe Market Attractiveness by Source, 2023 to 2033

Figure 118: Europe Market Attractiveness by Type, 2023 to 2033

Figure 118: Europe Market Attractiveness by Extraction Technique, 2023 to 2033

Figure 119: Europe Market Attractiveness by End-user, 2023 to 2033

Figure 120: Europe Market Attractiveness by Country, 2023 to 2033

Figure 122: East Asia Market Value (US$ million) by Source, 2023 to 2033

Figure 123: East Asia Market Value (US$ million) by Type, 2023 to 2033

Figure 123: East Asia Market Value (US$ million) by Extraction Technique, 2023 to 2033

Figure 124: East Asia Market Value (US$ million) by End-user, 2023 to 2033

Figure 125: East Asia Market Value (US$ million) by Country, 2023 to 2033

Figure 126: East Asia Market Value (US$ million) Analysis by Country, 2018 to 2033

Figure 127: East Asia Market Volume (MT) Analysis by Country, 2018 to 2033

Figure 128: East Asia Market Value Share (%) and BPS Analysis by Country, 2023 to 2033

Figure 129: East Asia Market Y-o-Y Growth (%) Projections by Country, 2023 to 2033

Figure 130: East Asia Market Value (US$ million) Analysis by Source, 2018 to 2033

Figure 131: East Asia Market Volume (MT) Analysis by Source, 2018 to 2033

Figure 133: East Asia Market Value Share (%) and BPS Analysis by Source, 2023 to 2033

Figure 133: East Asia Market Y-o-Y Growth (%) Projections by Source, 2023 to 2033

Figure 134: East Asia Market Value (US$ million) Analysis by Type, 2018 to 2033

Figure 135: East Asia Market Volume (MT) Analysis by Type, 2018 to 2033

Figure 136: East Asia Market Value Share (%) and BPS Analysis by Type, 2023 to 2033

Figure 137: East Asia Market Y-o-Y Growth (%) Projections by Type, 2023 to 2033

Figure 138: East Asia Market Value (US$ million) Analysis by Extraction Technique, 2018 to 2033

Figure 139: East Asia Market Volume (MT) Analysis by Extraction Technique, 2018 to 2033

Figure 140: East Asia Market Value Share (%) and BPS Analysis by Extraction Technique, 2023 to 2033

Figure 141: East Asia Market Y-o-Y Growth (%) Projections by Extraction Technique, 2023 to 2033

Figure 142: East Asia Market Value (US$ million) Analysis by End-user, 2018 to 2033

Figure 143: East Asia Market Volume (MT) Analysis by End-user, 2018 to 2033

Figure 144: East Asia Market Value Share (%) and BPS Analysis by End-user, 2023 to 2033

Figure 145: East Asia Market Y-o-Y Growth (%) Projections by End-user, 2023 to 2033

Figure 146: East Asia Market Attractiveness by Source, 2023 to 2033

Figure 147: East Asia Market Attractiveness by Type, 2023 to 2033

Figure 148: East Asia Market Attractiveness by Extraction Technique, 2023 to 2033

Figure 149: East Asia Market Attractiveness by End-user, 2023 to 2033

Figure 150: East Asia Market Attractiveness by Country, 2023 to 2033

Figure 151: South Asia Market Value (US$ million) by Source, 2023 to 2033

Figure 152: South Asia Market Value (US$ million) by Type, 2023 to 2033

Figure 153: South Asia Market Value (US$ million) by Extraction Technique, 2023 to 2033

Figure 154: South Asia Market Value (US$ million) by End-user, 2023 to 2033

Figure 155: South Asia Market Value (US$ million) by Country, 2023 to 2033

Figure 156: South Asia Market Value (US$ million) Analysis by Country, 2018 to 2033

Figure 157: South Asia Market Volume (MT) Analysis by Country, 2018 to 2033

Figure 158: South Asia Market Value Share (%) and BPS Analysis by Country, 2023 to 2033

Figure 159: South Asia Market Y-o-Y Growth (%) Projections by Country, 2023 to 2033

Figure 160: South Asia Market Value (US$ million) Analysis by Source, 2018 to 2033

Figure 161: South Asia Market Volume (MT) Analysis by Source, 2018 to 2033

Figure 162: South Asia Market Value Share (%) and BPS Analysis by Source, 2023 to 2033

Figure 163: South Asia Market Y-o-Y Growth (%) Projections by Source, 2023 to 2033

Figure 164: South Asia Market Value (US$ million) Analysis by Type, 2018 to 2033

Figure 165: South Asia Market Volume (MT) Analysis by Type, 2018 to 2033

Figure 166: South Asia Market Value Share (%) and BPS Analysis by Type, 2023 to 2033

Figure 167: South Asia Market Y-o-Y Growth (%) Projections by Type, 2023 to 2033

Figure 168: South Asia Market Value (US$ million) Analysis by Extraction Technique, 2018 to 2033

Figure 169: South Asia Market Volume (MT) Analysis by Extraction Technique, 2018 to 2033

Figure 180: South Asia Market Value Share (%) and BPS Analysis by Extraction Technique, 2023 to 2033

Figure 181: South Asia Market Y-o-Y Growth (%) Projections by Extraction Technique, 2023 to 2033

Figure 182: South Asia Market Value (US$ million) Analysis by End-user, 2018 to 2033

Figure 183: South Asia Market Volume (MT) Analysis by End-user, 2018 to 2033

Figure 184: South Asia Market Value Share (%) and BPS Analysis by End-user, 2023 to 2033

Figure 185: South Asia Market Y-o-Y Growth (%) Projections by End-user, 2023 to 2033

Figure 186: South Asia Market Attractiveness by Source, 2023 to 2033

Figure 187: South Asia Market Attractiveness by Type, 2023 to 2033

Figure 188: South Asia Market Attractiveness by Extraction Technique, 2023 to 2033

Figure 189: South Asia Market Attractiveness by End-user, 2023 to 2033

Figure 180: South Asia Market Attractiveness by Country, 2023 to 2033

Figure 181: Oceania Market Value (US$ million) by Source, 2023 to 2033

Figure 182: Oceania Market Value (US$ million) by Type, 2023 to 2033

Figure 183: Oceania Market Value (US$ million) by Extraction Technique, 2023 to 2033

Figure 184: Oceania Market Value (US$ million) by End-user, 2023 to 2033

Figure 185: Oceania Market Value (US$ million) by Country, 2023 to 2033

Figure 186: Oceania Market Value (US$ million) Analysis by Country, 2018 to 2033

Figure 187: Oceania Market Volume (MT) Analysis by Country, 2018 to 2033

Figure 188: Oceania Market Value Share (%) and BPS Analysis by Country, 2023 to 2033

Figure 189: Oceania Market Y-o-Y Growth (%) Projections by Country, 2023 to 2033

Figure 190: Oceania Market Value (US$ million) Analysis by Source, 2018 to 2033

Figure 191: Oceania Market Volume (MT) Analysis by Source, 2018 to 2033

Figure 192: Oceania Market Value Share (%) and BPS Analysis by Source, 2023 to 2033

Figure 193: Oceania Market Y-o-Y Growth (%) Projections by Source, 2023 to 2033

Figure 194: Oceania Market Value (US$ million) Analysis by Type, 2018 to 2033

Figure 195: Oceania Market Volume (MT) Analysis by Type, 2018 to 2033

Figure 196: Oceania Market Value Share (%) and BPS Analysis by Type, 2023 to 2033

Figure 197: Oceania Market Y-o-Y Growth (%) Projections by Type, 2023 to 2033

Figure 198: Oceania Market Value (US$ million) Analysis by Extraction Technique, 2018 to 2033

Figure 199: Oceania Market Volume (MT) Analysis by Extraction Technique, 2018 to 2033

Figure 200: Oceania Market Value Share (%) and BPS Analysis by Extraction Technique, 2023 to 2033

Figure 201: Oceania Market Y-o-Y Growth (%) Projections by Extraction Technique, 2023 to 2033

Figure 202: Oceania Market Value (US$ million) Analysis by End-user, 2018 to 2033

Figure 203: Oceania Market Volume (MT) Analysis by End-user, 2018 to 2033

Figure 204: Oceania Market Value Share (%) and BPS Analysis by End-user, 2023 to 2033

Figure 205: Oceania Market Y-o-Y Growth (%) Projections by End-user, 2023 to 2033

Figure 206: Oceania Market Attractiveness by Source, 2023 to 2033

Figure 207: Oceania Market Attractiveness by Type, 2023 to 2033

Figure 208: Oceania Market Attractiveness by Extraction Technique, 2023 to 2033

Figure 209: Oceania Market Attractiveness by End-user, 2023 to 2033

Figure 220: Oceania Market Attractiveness by Country, 2023 to 2033

Figure 221: Middle East and Africa Market Value (US$ million) by Source, 2023 to 2033

Figure 222: Middle East and Africa Market Value (US$ million) by Type, 2023 to 2033

Figure 223: Middle East and Africa Market Value (US$ million) by Extraction Technique, 2023 to 2033

Figure 224: Middle East and Africa Market Value (US$ million) by End-user, 2023 to 2033

Figure 225: Middle East and Africa Market Value (US$ million) by Country, 2023 to 2033

Figure 226: Middle East and Africa Market Value (US$ million) Analysis by Country, 2018 to 2033

Figure 227: Middle East and Africa Market Volume (MT) Analysis by Country, 2018 to 2033

Figure 228: Middle East and Africa Market Value Share (%) and BPS Analysis by Country, 2023 to 2033

Figure 229: Middle East and Africa Market Y-o-Y Growth (%) Projections by Country, 2023 to 2033

Figure 230: Middle East and Africa Market Value (US$ million) Analysis by Source, 2018 to 2033

Figure 231: Middle East and Africa Market Volume (MT) Analysis by Source, 2018 to 2033

Figure 233: Middle East and Africa Market Value Share (%) and BPS Analysis by Source, 2023 to 2033

Figure 233: Middle East and Africa Market Y-o-Y Growth (%) Projections by Source, 2023 to 2033

Figure 234: Middle East and Africa Market Value (US$ million) Analysis by Type, 2018 to 2033

Figure 235: Middle East and Africa Market Volume (MT) Analysis by Type, 2018 to 2033

Figure 236: Middle East and Africa Market Value Share (%) and BPS Analysis by Type, 2023 to 2033

Figure 237: Middle East and Africa Market Y-o-Y Growth (%) Projections by Type, 2023 to 2033

Figure 238: Middle East and Africa Market Value (US$ million) Analysis by Extraction Technique, 2018 to 2033

Figure 239: Middle East and Africa Market Volume (MT) Analysis by Extraction Technique, 2018 to 2033

Figure 230: Middle East and Africa Market Value Share (%) and BPS Analysis by Extraction Technique, 2023 to 2033

Figure 231: Middle East and Africa Market Y-o-Y Growth (%) Projections by Extraction Technique, 2023 to 2033

Figure 233: Middle East and Africa Market Value (US$ million) Analysis by End-user, 2018 to 2033

Figure 233: Middle East and Africa Market Volume (MT) Analysis by End-user, 2018 to 2033

Figure 234: Middle East and Africa Market Value Share (%) and BPS Analysis by End-user, 2023 to 2033

Figure 235: Middle East and Africa Market Y-o-Y Growth (%) Projections by End-user, 2023 to 2033

Figure 236: Middle East and Africa Market Attractiveness by Source, 2023 to 2033

Figure 237: Middle East and Africa Market Attractiveness by Type, 2023 to 2033

Figure 238: Middle East and Africa Market Attractiveness by Extraction Technique, 2023 to 2033

Figure 239: Middle East and Africa Market Attractiveness by End-user, 2023 to 2033

Figure 240: Middle East and Africa Market Attractiveness by Country, 2023 to 2033

Recommendations

Food and Beverage

Fish Roe Enzymes and Extracts Market

Published : July 2023

Food and Beverage

Fish Protein Concentrate Market

Published : March 2023

Food and Beverage

Fish Protein Market

Published : December 2022

Food and Beverage

Fish Protein Isolate Market

Published : June 2020

Explore Food and Beverage Insights

View Reports

Marine-derived Protein Market