Protein Puddings Market Size and Share Forecast Outlook 2025 to 2035

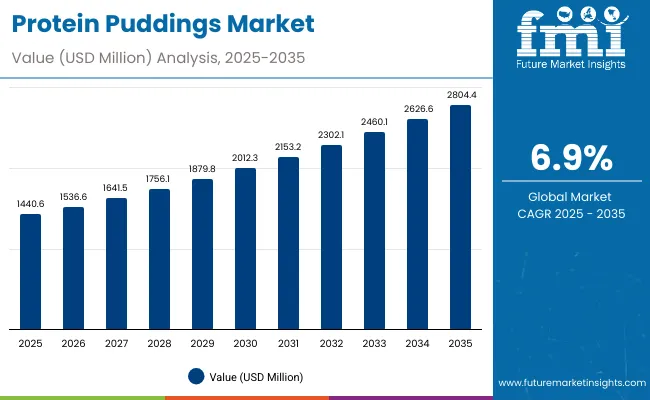
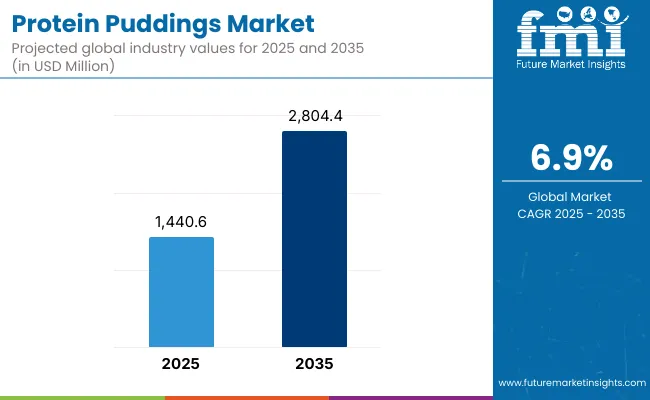
The Protein Puddings Market is projected to be valued at USD 1,440.6 million in 2025 and is forecasted to reach USD 2,804.4 million by 2035. This growth represents an increase of USD 1,363.8 million over the decade, translating to a nearly 2X expansion and a compound annual growth rate (CAGR) of 6.9%. A steady climb in high-protein functional foods particularly within the dairy and plant-based pudding space is anticipated to fuel this trajectory.
Protein Puddings Market 1

Quick Stats for Protein Puddings Market

  • Protein Puddings Market Value (2025): USD 1,440.6 million
  • Protein Puddings Market Forecast Value (2035): USD 2,804.4 million
  • Protein Puddings Forecast CAGR:6.9%
  • Leading Segment in Protein Puddings in 2025, by Product Type:Ready-to-Eat (RTE) Pudding Cups (48.6%)
  • Key Growth Regions in the Protein Puddings: North America, Asia-Pacific, Europe
  • Top Key Players in Protein Puddings:Arla Foods amba, Ehrmann GmbH, NJIE (ProPud), Valio Ltd., Zott Dairy, Danone (Alpro), Myprotein (The Hut Group), Bariatrix Europe, UFIT Drinks, Bernard Food Industries.

Protein Puddings Market Key Takeaways
Protein Puddings Market

Metric Value
Protein Puddings Estimated Value in (2025E) USD 1,440.6 million
Protein Puddings Forecast Value in (2035F) USD 2,804.4 million
Forecast CAGR (2025 to 2035) 6.9%

Between 2025 and 2030, the market is expected to rise from USD 1,440.6 million to approximately USD 2,012.3 million, marking an addition of USD 571.7 million, or 42% of the total decade-long growth. During this initial phase, early-stage innovation in protein fortification, combined with premium product positioning, is expected to shape consumer uptake. Higher demand across North America and Europe is likely to be observed as sports nutrition and wellness segments continue to converge with indulgent formats.

In the subsequent period from 2030 to 2035, a sharper growth curve is forecasted, with the market increasing from USD 2,012.3 million to USD 2,804.4 million, adding USD 792.1 million, which constitutes 58% of total growth. This acceleration is expected to be driven by widespread mainstreaming of protein puddings into meal replacement routines and the incorporation of hybrid animal-plant protein systems. Regional expansion, clean-label innovation, and digital retail channels are projected to further elevate value capture across the latter half of the forecast window.

From 2020 to 2024, the Protein Puddings Market experienced sustained momentum as high-protein, low-sugar indulgent foods gained broader acceptance among fitness-focused, weight-conscious, and aging consumers. During this phase, the competitive landscape was dominated by established dairy players, who accounted for over 60% of market revenue, leveraging their processing capabilities and distribution networks. Product innovation during this period was focused on dairy-based RTE cups, with clean-label claims and digestive wellness enhancements serving as differentiators. Plant-based and hybrid formulations remained in nascent stages, contributing less than 15% of total sales.

By 2025, demand is projected to reach USD 1,440.6 million, with consumer expectations shifting toward personalization, functional fortification (e.g., probiotics, fiber), and digital engagement. Over the next decade, value migration is expected toward plant-forward, on-the-go, and direct-to-consumer (DTC) models. Legacy brands are now pivoting to retain relevance through flavor diversification, packaging innovation, and e-commerce integration. Meanwhile, digitally native brands with agile formulation cycles and strong influencer marketing presence are capturing share. The basis of competitive advantage is moving from distribution scale alone to product experience, functional utility, and brand trust. Recurring revenue via subscriptions, loyalty programs, and personalized wellness bundling is expected to define the next wave of market leadership.

Why the Protein Puddings Market is growing?

Significant growth in the Protein Puddings Market has been driven by a convergence of health-conscious consumer behavior, functional snacking trends, and protein fortification innovation. A shift toward high-protein, low-sugar indulgent foods has been widely observed, as consumers increasingly seek balanced nutrition without compromising on taste or convenience. This demand has been reinforced by the expansion of fitness lifestyles, weight management routines, and aging populations seeking muscle maintenance and satiety-enhancing diets.

Enhanced accessibility through supermarkets, online retail, and direct-to-consumer platforms has been strategically leveraged to expand reach across both urban and rural demographics. Technological advancements in formulation science have allowed for improved texture, taste masking, and protein blending-particularly in ready-to-eat and refrigerated pudding formats. Blended proteins and plant-based alternatives are also being adopted to cater to vegan, lactose-intolerant, and allergen-sensitive consumers.

Retailers and manufacturers have responded by investing in clean-label, low-carb, and functional SKUs, which are being actively positioned as meal replacements, post-workout snacks, or healthy desserts. Flavor diversification and convenience packaging formats are being employed to stimulate trial and repeat purchases. As regulatory clarity and consumer education improve, sustained market growth is expected to be supported by innovation pipelines, global expansion strategies, and cross-category hybridization with nutraceuticals and sports nutrition products.

Segmental Analysis

The Protein Puddings Market has been segmented based on product type, source, end user, flavor, distribution channel, and region. Among these, product type, source, and end user have emerged as foundational dimensions shaping market growth and innovation. Product segmentation has reflected the varying consumption preferences for convenience, indulgence, and dietary compliance, with ready-to-eat formats continuing to dominate shelves and innovation pipelines. On the basis of Source, a diverse range of dairy and plant-based proteins has been deployed to cater to shifting consumer dietary patterns. Meanwhile, the End User segment has demonstrated strong performance as personalized nutrition and sports-based formulations have been aligned with specific consumer demographics. These segments have been closely analyzed to understand current dominance and future potential, as demand continues to diversify across performance-driven, lifestyle-oriented, and health-critical consumer groups.
Insights into the Product Type Segment with Ready-to-Eat (RTE) Pudding Cups leading in Market Share

Protein Puddings Market By Product Type

Product Type Segment Market Value Share, 2025
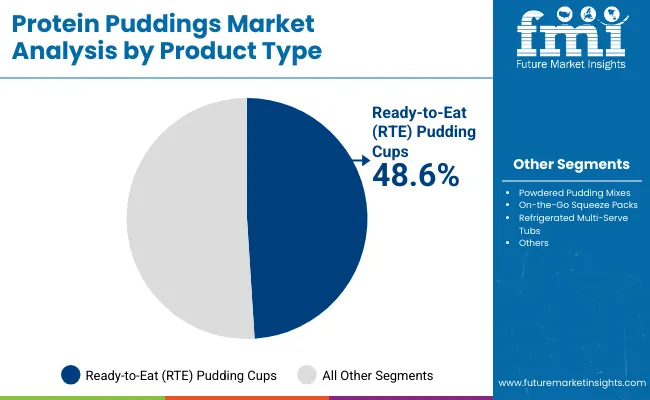
Ready-to-Eat (RTE) Pudding Cups 48.6%
Powdered Pudding Mixes 21.7%

Ready-to-Eat (RTE) Pudding Cups are projected to account for 48.6% of the Protein Puddings Market in 2025, maintaining their dominance due to convenience and mass appeal. Strong adoption has been observed among active and health-conscious consumers, particularly those seeking protein-rich snacks that require no preparation. The segment’s expansion has been supported by advances in packaging, extended shelf stability, and clean-label ingredient integration. As manufacturers continue to enhance flavor and texture profiles while maintaining nutritional claims, sustained demand is expected. The rise of subscription-based DTC models and increased placement in supermarkets and gyms has further reinforced segment penetration. Given evolving consumer lifestyles and the demand for functional indulgence, RTE Pudding Cups are likely to remain the anchor format of the market.
Insights into the Source Segment with Whey Protein Dominating the Demand

Protein Puddings Market By Source

Source 2025 Share%
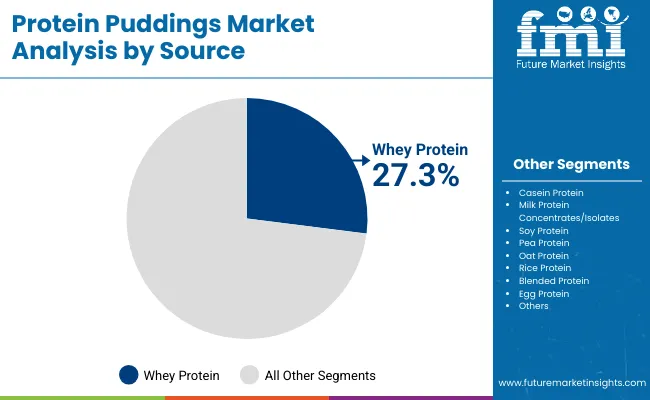
Whey Protein 27.3%
Casein Protein 14.6%
Milk Protein Concentrates/Isolates 13.9%

Whey Protein is expected to hold the highest share at 27.3% in 2025, attributed to its superior digestibility, amino acid profile, and widespread consumer trust. Long favored in sports and clinical nutrition, whey-based formulations have been extended into indulgent protein snacks such as puddings. The segment’s performance has been driven by its compatibility with dairy bases, favorable texture outcomes, and recognized efficacy in muscle recovery. While plant-based alternatives are gaining ground, whey continues to serve as the protein of choice for high-performance products. Innovations in filtration and flavor masking have further enhanced its versatility. Continued dominance is likely as mainstream consumers prioritize scientifically backed protein sources, although hybrid blends and clean-label plant options may gradually dilute its share over time.
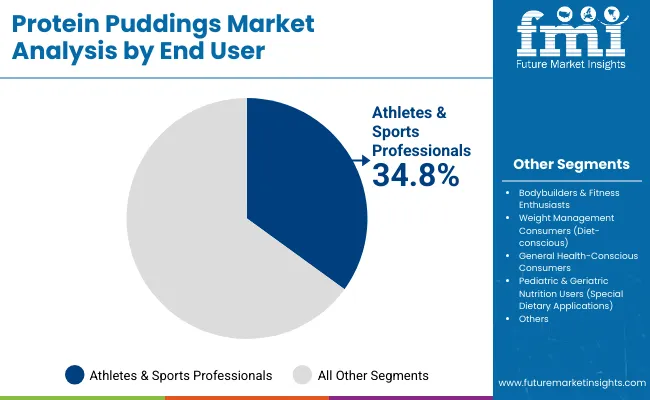
Insights into the End User Segment with Focus on Athletes & Sports Professionals

Protein Puddings Market By End User

End User 2025 Share%
Athletes & Sports Professionals 34.8%
Bodybuilders & Fitness Enthusiasts 25.8%
Weight Management Consumers (diet-conscious) 18.3%

Athletes and Sports Professionals are projected to represent 34.8% of the market in 2025, establishing themselves as the largest consumer base. Performance-driven nutritional needs have fueled consistent uptake of protein puddings as a post-exercise recovery snack or muscle support supplement. This segment has benefited from targeted marketing, clinical claims, and placement within fitness retail environments. On-the-go formats such as RTE cups and squeeze packs have been optimized for convenience post-training, while high-protein, low-carb formulations have been prioritized. As performance nutrition becomes increasingly mainstream, the boundaries between athlete-focused and lifestyle segments are expected to blur. However, product lines tailored specifically for this group are anticipated to retain a premium positioning, with new ingredient integrations and clinical endorsements driving continued engagement.

What are the Drivers, Restraints, and Key Trends of the Protein Puddings Market?

While demand continues to accelerate across health, wellness, and sports nutrition segments, challenges around taste masking, protein stability, and clean-label claims have been observed. Still, the market is being shaped by the growing integration of functional foods into daily routines and the rise of hybrid protein formats tailored to evolving dietary preferences.

Functional Snacking Becoming a Core Consumer Behavior

The incorporation of protein-enriched puddings into daily eating patterns has been accelerated by growing demand for functional snacking. These products are no longer being positioned solely as post-workout options but are now being consumed across breakfast, midday, and evening snacking occasions. The rise of time-compressed lifestyles, combined with higher consumer awareness around satiety and muscle maintenance, has fueled this trend. Health-aware consumers are actively seeking portable, nutritionally dense snacks that align with their macronutrient goals. As indulgence and nutrition converge, protein puddings have been embraced as a bridge category that satisfies both emotional and dietary needs. Continued investment in product formats and retail placements is expected to amplify functional snacking as a key market driver.

Blended and Alternative Protein Sources Gaining Momentum

A shift toward diversified protein sourcing has been observed, with blended dairy-plant formulations and egg or rice protein alternatives being explored. This trend has been catalyzed by growing interest in allergen-free, vegan, and sustainable protein sources. Blended protein systems have been utilized to improve texture, flavor neutrality, and cost-efficiency, while appealing to flexitarian consumers. As label scrutiny intensifies, manufacturers are expected to innovate with combinations that balance efficacy, taste, and digestibility.
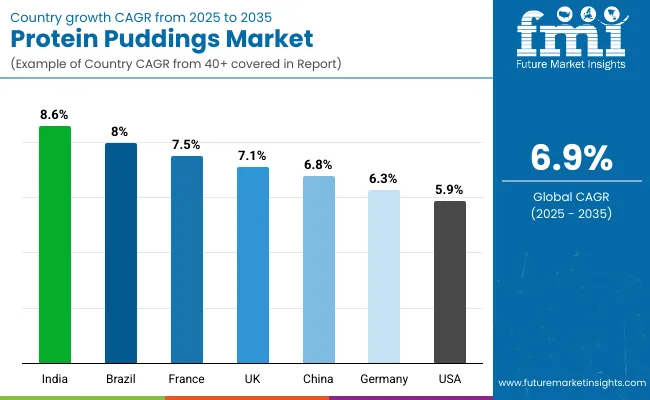
Analysis of Protein Puddings Market by Key Countries

Country Wise Protein Puddings Market

Country CAGR (2025 to 2035)
China 6.8%
India 8.6%
Germany 6.3%
France 7.5%
UK 7.1%
USA 5.9%
Brazil 8.0%

The global Protein Puddings Market has been shaped by significant cross-country differences in health awareness, nutritional infrastructure, and sports nutrition adoption. Accelerated expansion has been observed across emerging economies, where the fusion of convenience and protein fortification is being embraced across demographics. Asia-Pacific has been identified as the most dynamic region, with India expected to grow at 8.6% CAGR, fueled by rising health consciousness, an expanding fitness ecosystem, and increased availability of protein-enriched dairy and plant-based products. In China, growth at 6.8% CAGR is being driven by a shift in consumer dietary patterns, urbanization-led snacking behavior, and domestic innovations in functional foods targeting younger consumers.

In Europe, consistent growth is being supported by high product awareness, structured retail penetration, and evolving regulatory support for protein claims. France (7.5%), the UK (7.1%), and Germany (6.3%) are forecasted to maintain upward trajectories, driven by clean-label demand, rising flexitarianism, and premiumization of protein puddings within grocery and pharmacy channels.

In Brazil, an 8.0% CAGR is expected as middle-class consumers increasingly adopt protein-rich formats for weight management and fitness. Meanwhile, the USA will grow at 5.9% CAGR, supported by strong DTC brands and clinical positioning of protein puddings, though growth will remain moderate due to market maturity and saturation in sports nutrition SKUs.
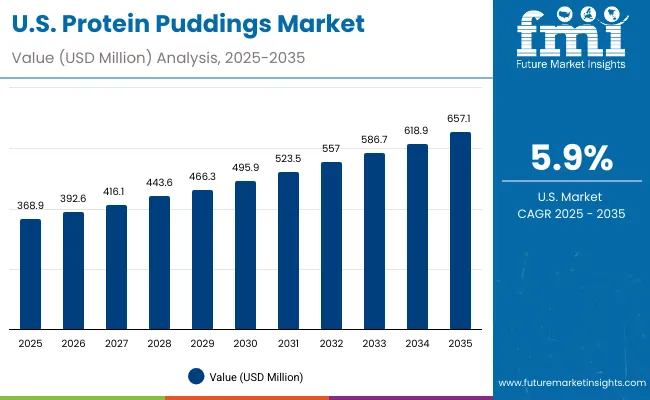
Sales Outlook for Protein Puddings in the United States

Usa Protein Puddings Market

Year USA Protein Puddings Market (USD Million)
2025 368.9
2026 392.6
2027 416.1
2028 443.6
2029 466.3
2030 495.9
2031 523.5
2032 557.0
2033 586.7
2034 618.9
2035 657.1

The Protein Puddings Market in the United States is projected to grow at a CAGR of 5.9% from 2025 to 2035. Growth has been propelled by rising consumer emphasis on high-protein, low-sugar snacking solutions that align with weight management, muscle recovery, and active lifestyle goals. Ready-to-eat formats have been embraced across fitness, convenience retail, and clinical nutrition settings, especially within metropolitan regions.

Clinical and wellness-driven innovation has been prioritized by domestic brands, with protein puddings increasingly positioned as meal replacements and functional desserts. Demand has also been supported by the integration of dairy and plant-based hybrid proteins to cater to a broader health-aware population, including lactose-intolerant and flexitarian consumers.

E-commerce and DTC platforms have been actively utilized to promote subscriptions, limited editions, and influencer-led product launches. Clean-label claims, satiety benefits, and indulgent flavors have been leveraged to attract both performance-focused and mainstream audiences.

  • Meal replacement adoption in fitness and wellness circles has elevated protein pudding penetration in daily diets.
  • Direct-to-consumer (DTC) models have enhanced customization, accessibility, and brand loyalty across high-value consumer segments.

Growth and Expansion Outlook for Protein Puddings Market in the United Kingdom

The Protein Puddings Market in the UK is projected to register a CAGR of 7.1% between 2025 and 2035, supported by the mainstreaming of functional snacks in both retail and gym-affiliated channels. Growth has been driven by strong consumer alignment with high-protein, low-sugar formats that fit clean-label and weight management trends. Ready-to-eat pudding cups and on-the-go formats have been increasingly adopted as alternatives to traditional dairy desserts and bars. Hybrid protein formulations particularly those combining dairy with plant-based proteins have gained acceptance among flexitarian consumers. Strong distribution via supermarkets, health stores, and online DTC models has been observed, while subscription models continue to gain traction among repeat buyers.

  • Protein puddings are being integrated into daily diets as dessert substitutes.
  • DTC subscription growth is strengthening brand-customer relationships.
  • Flexitarian diets are boosting demand for blended and plant proteins.
  • Clean-label and satiety claims are driving premium positioning.

Growth and Expansion Outlook for Protein Puddings in China

The Protein Puddings Market in China is anticipated to expand at a CAGR of 6.8% between 2025 and 2035, driven by the convergence of functional food trends, digital retail penetration, and modern snacking behavior. Rising awareness of muscle health, especially among urban youth and middle-aged populations, has led to increasing experimentation with high-protein desserts. The market has benefited from the integration of protein puddings into fitness regimens, particularly among gym-goers and social media-influenced consumers. Domestic players have actively launched pudding products that align with national taste preferences and clean-label demands. Premium packaging, probiotic fortification, and celebrity endorsements have been used to drive differentiation.

  • Digital platforms (Douyin, Tmall) are enabling rapid market access and visibility.
  • Protein puddings are being positioned as beauty and wellness snacks.
  • Domestic dairy giants are introducing clean-label, protein-rich SKUs.
  • Functional dessert trends are accelerating post-COVID health focus.

Sales Outlook for Protein Puddings in India

In India, the Protein Puddings Market is forecasted to grow at a robust CAGR of 8.6% from 2025 to 2035, making it one of the fastest-growing national markets. Rapid urbanization, rising disposable incomes, and a fitness-focused millennial demographic have contributed to increased awareness of protein-rich functional foods. Growth has been further catalyzed by the entry of both domestic startups and multinational nutrition brands offering regionally tailored flavors and plant-forward formulations. Localized branding, affordability, and positioning around energy and satiety have allowed protein puddings to gain traction even outside Tier 1 cities. Online platforms, including wellness-focused e-commerce sites, have been actively utilized for first-time consumer acquisition.

  • Regional flavors and Ayurvedic positioning are being explored for product differentiation.
  • Online-first strategies are unlocking demand in Tier 2 and Tier 3 cities.
  • Plant-based and lactose-free offerings are expanding rapidly.
  • Affordable price points are driving first-time trial among new health-conscious segments.

In-depth Analysis of Protein Puddings in Germany

Country Wise Protein Puddings Market

Country 2025
UK 21.4%
Germany 27.6%
Italy 10.8%
France 16.9%
Spain 9.7%
BENELUX 5.9%
Nordic 4.2%
Rest of Europe 3.5%
Country 2035
UK 19.9%
Germany 26.1%
Italy 11.4%
France 15.7%
Spain 10.9%
BENELUX 5.7%
Nordic 5.0%
Rest of Europe 5.3%

Germany’s Protein Puddings Market is forecasted to grow at a CAGR of 6.8% through 2035, underpinned by strong demand for clean-label, high-protein snacks with indulgent appeal. Consumers have shown a preference for dairy-based pudding formats fortified with whey, casein, or milk protein isolates. Increased gym participation and active lifestyle trends have supported market penetration across younger and aging demographics alike. The segment has benefited from premium placement in supermarkets, organic chains, and pharmacy health aisles. Innovation in functional claims such as satiety, digestive health, and low-carb content has strengthened product appeal. Flavor diversification, including mocha, berry, and exotic seasonal options, is also being embraced.
  • Clean-label compliance and ingredient transparency are critical to growth.
  • Organic and pharmacy retail channels are driving premium purchases.
  • Functional positioning is aligned with aging population wellness goals.
  • Demand for indulgent yet nutritious snacks is reshaping dairy aisles.

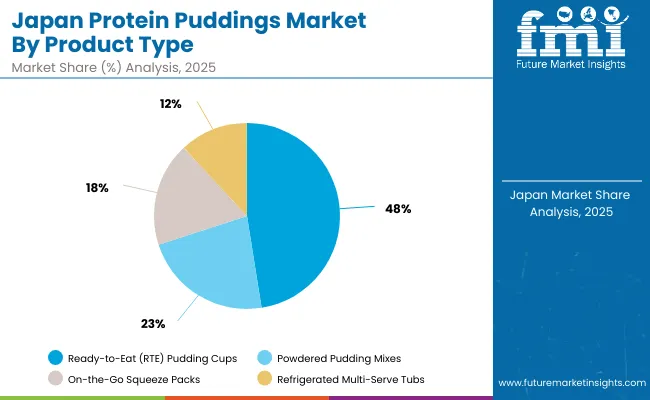
Growth Outlook for Protein Puddings in Japan

Japan Protein Puddings Market

Product Type Market Value Share, 2025
Ready-to-Eat (RTE) Pudding Cups 47.5%
Powdered Pudding Mixes 22.5%
On-the-Go Squeeze Packs 18.1%
Refrigerated Multi-Serve Tubs 11.9%

The Protein Puddings Market in Japan is projected to reach a valuation of USD 86.8 million by 2025. Among product formats, Ready-to-Eat (RTE) Pudding Cups are expected to dominate with 47.5% share, while Powdered Pudding Mixes hold 22.5%, and On-the-Go Squeeze Packs follow at 18.1%. Although traditional convenience formats continue to lead, a gradual transition toward portable and customizable options such as squeeze packs and powdered mixes is being observed. This shift reflects changing consumer expectations around portion control, mobility, and personalization.

Market growth is being underpinned by Japan’s increasing preference for functional indulgence, where high-protein snacks are perceived as healthier dessert alternatives. The rise of clinical wellness, coupled with demand for low-sugar and lactose-free formulations, has encouraged innovation in plant-protein variants and hybrid formats. As population aging accelerates, protein puddings are also being used to support nutritional supplementation for senior demographics.
  • Japan is projected to hold a notable share of the global market in 2025
  • RTE Pudding Cups lead, but on-the-go formats are gaining momentum
  • Demand is supported by aging population and high protein awareness
  • Innovation is driven by clean-label, functional, and portable consumption trends.

Opportunity Analysis of South Korea Protein Puddings Market

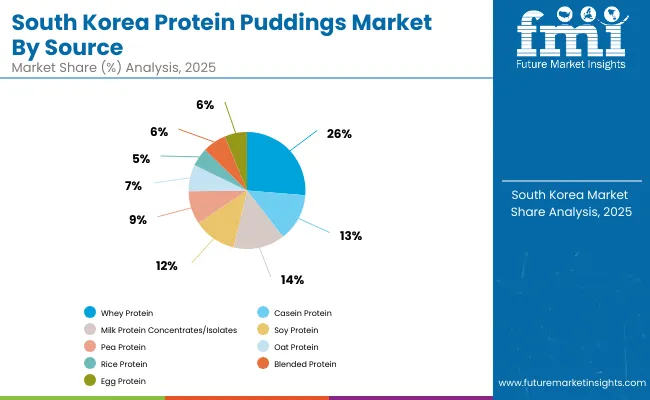
South Korea Protein Puddings Market

Source Market Value Share, 2025
Whey Protein 26.3%
Casein Protein 13.2%
Milk Protein Concentrates/Isolates 14.2%
Soy Protein 11.9%
Pea Protein 9.2%
Oat Protein 7.4%
Rice Protein 5.1%
Blended Protein 6.5%
Egg Protein 6.2%

The Protein Puddings Market in South Korea is projected to expand steadily through 2035, driven by growing nutritional awareness, increased fitness engagement, and a heightened preference for functional yet indulgent food formats. In 2025, Whey Protein is expected to lead with a 26.3% market share, while plant-based alternatives such as Oat, Pea, and Rice Proteins are forecasted to gain traction due to rising lactose intolerance and clean-label demand.

Blended Proteins, holding 6.5% of the market in 2025, are poised for the fastest growth, as Korean consumers increasingly seek balanced nutrition that combines the efficacy of dairy with the digestibility of plant-based options. Innovation in protein delivery such as pudding-based formats tailored for skin health, weight management, and recovery is expected to be prioritized by both domestic and global brands entering the Korean wellness space.

High digital literacy and strong e-commerce infrastructure are being leveraged to personalize protein product offerings through direct-to-consumer platforms, K-beauty wellness crossovers, and KOL-driven campaigns.
  • Blended and plant-based proteins are gaining rapid traction
  • Whey and dairy proteins remain dominant due to fitness-driven consumption
  • Functional positioning aligned with beauty, immunity, and active aging is emerging
  • E-commerce and influencer marketing are being used for rapid product scaling.

Competitive Landscape of Protein Puddings Market

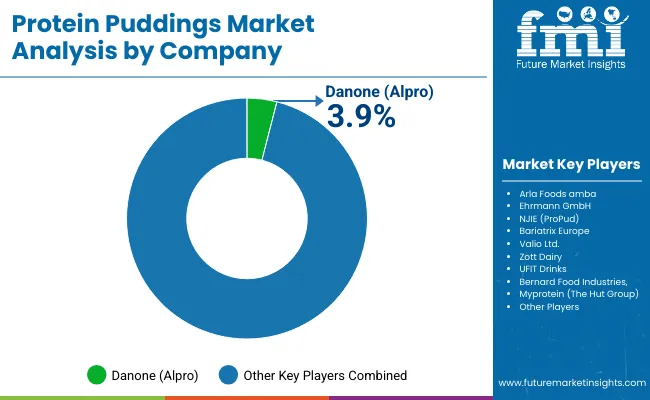
Protein Puddings Market By Company

Company Global Value Share 2025
Danone (Alpro) 3.9%
Others 96.1%

The Protein Puddings Market is moderately consolidated, with established dairy companies, performance nutrition brands, and functional food innovators competing across health, wellness, and sports nutrition segments. Global dairy leaders such as Arla Foods amba, Danone (Alpro), and Valio Ltd. are expected to retain dominant positions, backed by robust dairy sourcing, cold chain infrastructure, and long-standing consumer trust. These companies have emphasized high-protein innovations through clean-label, lactose-free, and functional pudding lines, often cross-leveraging their expertise in yogurt, beverages, and fortified dairy categories.

Mid-sized health and performance brands like Ehrmann GmbH, NJIE (ProPud), and UFIT Drinks have been positioned as agile innovators, targeting fitness-conscious consumers with ready-to-eat formats, advanced protein blends, and influencer-driven marketing. Their products have been increasingly placed in gym kiosks, convenience stores, and DTC platforms, offering both taste appeal and macro-alignment.

Niche-focused players such as Bariatrix Europe, Myprotein (The Hut Group), and Bernard Food Industries have carved out space through clinical nutrition SKUs, private label partnerships, and e-commerce-first strategies. These brands often cater to protein-specific dietary needs like weight loss, diabetic nutrition, or senior care.

Competitive differentiation is being driven by ingredient transparency, functional fortification (e.g., probiotics, fiber), and format diversification. The shift toward subscription-based models, plant-dairy hybrids, and sustainability narratives is expected to intensify over the forecast period.

Key Developments in Protein Puddings Market

  • In September 2025, Arla Foods introduced its Protein Puddin Available in two flavours, Chocolate and Salted Caramel, the puddings are low in fat, contain no added sugar, and deliver 20g of protein per 200g serving range across Australian retailers, including Coles, Harris Farm Markets, Costco, and 7-Eleven.
  • In June 2025, Valio (Finland) launched its Pro Feel Protein Pudding in the United States. The product was introduced with ~17g protein per pot, low in sugar (~7g), and positioned as a functional dessert / snack option for health- and protein‑focused consumers.

Scope of the Report

Item Value
Quantitative Units USD 1,440.6 million
Product Type Ready-to-Eat (RTE) Pudding Cups, Powdered Pudding Mixes, On-the-Go Squeeze Packs, Refrigerated Multi-Serve Tubs
Source Whey Protein, Casein Protein, Milk Protein Concentrates/Isolates, Soy Protein, Pea Protein, Oat Protein, Rice Protein, Blended Protein, Egg Protein
Flavor Chocolate, Vanilla, Strawberry, Banana, Blueberry, Mango, Mocha/Coffee, Caramel, Cookies & Cream, Exotic/Seasonal Flavors (e.g., Pumpkin Spice, Matcha, Coconut)
End User Athletes & Sports Professionals, Bodybuilders & Fitness Enthusiasts, Weight Management Consumers, General Health-Conscious Consumers, Pediatric & Geriatric Nutrition Users
Distribution Channel Supermarkets, Hypermarkets, Convenience Stores, Specialty Nutrition & Health Stores, Pharmacies/Drugstores, Online Retail, Fitness & Gym Outlets, Direct-to-Consumer (DTC)
Regions Covered North America, Europe, Asia-Pacific, Latin America, Middle East & Africa
Country Covered United States, Canada, Germany, France, United Kingdom, China, Japan, India, Brazil, South Africa
Key Companies Profiled Arla Foods amba, Ehrmann GmbH, NJIE (ProPud), Bariatrix Europe, Valio Ltd., Zott Dairy, UFIT Drinks, Bernard Food Industries, Myprotein (The Hut Group), Danone (Alpro)
Additional Attributes Dollar sales by source type, product form, and end user; demand trends in weight management and active nutrition; growing adoption of plant-based and blended protein systems; retail innovations (shelf-stable, chilled, and DTC formats); cross-functional benefits (satiety, energy, gut health); regional flavor development strategies; and integration with fitness and lifestyle branding campaigns.

Key Segments

By Source:

  • Whey Protein
  • Casein Protein
  • Milk Protein Concentrates/Isolates
  • Soy Protein
  • Pea Protein
  • Oat Protein
  • Rice Protein
  • Blended Protein
  • Egg Protein

By Product Type:

  • Ready-to-Eat (RTE) Pudding Cups
  • Powdered Pudding Mixes
  • On-the-Go Squeeze Packs
  • Refrigerated Multi-Serve Tubs

By Flavor:

  • Chocolate
  • Vanilla
  • Strawberry
  • Blueberry
  • Banana
  • Mango
  • Mocha/Coffee
  • Caramel
  • Cookies & Cream
  • Exotic/Seasonal Flavors

By Distribution Channel:

  • Supermarkets
  • Hypermarkets
  • Convenience Stores
  • Specialty Nutrition & Health Stores
  • Pharmacies/Drugstores (health food sections)
  • Online Retail (e-commerce, brand websites, subscription services)
  • Fitness & Gym Outlets
  • Direct-to-Consumer (DTC sales by brands)

By End User:

  • Athletes & Sports Professionals
  • Bodybuilders & Fitness Enthusiasts
  • Weight Management Consumers (diet-conscious)
  • General Health-Conscious Consumers
  • Pediatric & Geriatric Nutrition

By Region:

  • North America
  • Latin America
  • Europe
  • East Asia
  • South Asia & Pacific
  • Middle East and Africa

Table of Content

  1. Executive Summary
    • Global Market Outlook
    • Demand-side Trends
    • Supply-side Trends
    • Technology Roadmap Analysis
    • Analysis and Recommendations
  2. Market Overview
    • Market Coverage / Taxonomy
    • Market Definition / Scope / Limitations
  3. Market Background
    • Market Dynamics
      • Drivers
      • Restraints
      • Opportunity
      • Trends
    • Scenario Forecast
      • Demand in Optimistic Scenario
      • Demand in Likely Scenario
      • Demand in Conservative Scenario
    • Opportunity Map Analysis
    • Product Life Cycle Analysis
    • Supply Chain Analysis
    • Investment Feasibility Matrix
    • Value Chain Analysis
    • PESTLE and Porter’s Analysis
    • Regulatory Landscape
    • Regional Parent Market Outlook
    • Production and Consumption Statistics
    • Import and Export Statistics
  4. Global Analysis 2020 to 2024 and Forecast, 2025 to 2035
    • Historical Market Size Value (USD Million) & Volume (Units) Analysis, 2020 to 2024
    • Current and Future Market Size Value (USD Million) & Volume (Units) Projections, 2025 to 2035
      • Y-o-Y Growth Trend Analysis
      • Absolute $ Opportunity Analysis
  5. Global Pricing Analysis 2020 to 2024 and Forecast 2025 to 2035
  6. Global Analysis 2020 to 2024 and Forecast 2025 to 2035, By Source
    • Introduction / Key Findings
    • Historical Market Size Value (USD Million) & Volume (Units) Analysis By Source, 2020 to 2024
    • Current and Future Market Size Value (USD Million) & Volume (Units) Analysis and Forecast By Source, 2025 to 2035
      • Whey Protein
      • Casein Protein
      • Milk Protein Concentrates/Isolates
      • Soy Protein
      • Pea Protein
      • Oat Protein
      • Rice Protein
      • Blended Protein
      • Egg Protein
    • Y-o-Y Growth Trend Analysis By Source, 2020 to 2024
    • Absolute $ Opportunity Analysis By Source, 2025 to 2035
  7. Global Analysis 2020 to 2024 and Forecast 2025 to 2035, By Product Type
    • Introduction / Key Findings
    • Historical Market Size Value (USD Million) & Volume (Units) Analysis By Product Type, 2020 to 2024
    • Current and Future Market Size Value (USD Million) & Volume (Units) Analysis and Forecast By Product Type, 2025 to 2035
      • Ready-to-Eat (RTE) Pudding Cups
      • Powdered Pudding Mixes
      • On-the-Go Squeeze Packs
      • Refrigerated Multi-Serve Tubs
    • Y-o-Y Growth Trend Analysis By Product Type, 2020 to 2024
    • Absolute $ Opportunity Analysis By Product Type, 2025 to 2035
  8. Global Analysis 2020 to 2024 and Forecast 2025 to 2035, By Flavor
    • Introduction / Key Findings
    • Historical Market Size Value (USD Million) & Volume (Units) Analysis By Flavor, 2020 to 2024
    • Current and Future Market Size Value (USD Million) & Volume (Units) Analysis and Forecast By Flavor, 2025 to 2035
      • Chocolate
      • Vanilla
      • Strawberry
      • Blueberry
      • Banana
      • Mango
      • Mocha/Coffee
      • Caramel
      • Cookies & Cream
      • Exotic/Seasonal Flavors (pumpkin spice, matcha, coconut, etc.)
    • Y-o-Y Growth Trend Analysis By Flavor, 2020 to 2024
    • Absolute $ Opportunity Analysis By Flavor, 2025 to 2035
  9. Global Analysis 2020 to 2024 and Forecast 2025 to 2035, By Distribution Channel
    • Introduction / Key Findings
    • Historical Market Size Value (USD Million) & Volume (Units) Analysis By Distribution Channel, 2020 to 2024
    • Current and Future Market Size Value (USD Million) & Volume (Units) Analysis and Forecast By Distribution Channel, 2025 to 2035
      • Supermarkets
      • Hypermarkets
      • Convenience Stores
      • Specialty Nutrition & Health Stores
      • Pharmacies/Drugstores (health food sections)
      • Online Retail (e-commerce, brand websites, subscription services)
      • Fitness & Gym Outlets
      • Direct-to-Consumer (DTC sales by brands)
    • Y-o-Y Growth Trend Analysis By Distribution Channel, 2020 to 2024
    • Absolute $ Opportunity Analysis By Distribution Channel, 2025 to 2035
  10. Global Analysis 2020 to 2024 and Forecast 2025 to 2035, By End User
    • Introduction / Key Findings
    • Historical Market Size Value (USD Million) & Volume (Units) Analysis By End User, 2020 to 2024
    • Current and Future Market Size Value (USD Million) & Volume (Units) Analysis and Forecast By End User, 2025 to 2035
      • Athletes & Sports Professionals
      • Bodybuilders & Fitness Enthusiasts
      • Weight Management Consumers (diet-conscious)
      • General Health-Conscious Consumers
      • Pediatric & Geriatric Nutrition Users (special dietary applications)
    • Y-o-Y Growth Trend Analysis By End User, 2020 to 2024
    • Absolute $ Opportunity Analysis By End User, 2025 to 2035
  11. Global Analysis 2020 to 2024 and Forecast 2025 to 2035, By Region
    • Introduction
    • Historical Market Size Value (USD Million) & Volume (Units) Analysis By Region, 2020 to 2024
    • Current Market Size Value (USD Million) & Volume (Units) Analysis and Forecast By Region, 2025 to 2035
      • North America
      • Latin America
      • Europe
      • East Asia
      • South Asia & Pacific
      • Middle East and Africa
    • Market Attractiveness Analysis By Region
  12. North America Analysis 2020 to 2024 and Forecast 2025 to 2035, By Country
    • Historical Market Size Value (USD Million) & Volume (Units) Trend Analysis By Market Taxonomy, 2020 to 2024
    • Market Size Value (USD Million) & Volume (Units) Forecast By Market Taxonomy, 2025 to 2035
      • By Country
        • U.S.
        • Canada
      • By Source
      • By Product Type
      • By Flavor
      • By Distribution Channel
      • By End User
    • Market Attractiveness Analysis
      • By Country
      • By Source
      • By Product Type
      • By Flavor
      • By Distribution Channel
      • By End User
    • Key Takeaways
  13. Latin America Analysis 2020 to 2024 and Forecast 2025 to 2035, By Country
    • Historical Market Size Value (USD Million) & Volume (Units) Trend Analysis By Market Taxonomy, 2020 to 2024
    • Market Size Value (USD Million) & Volume (Units) Forecast By Market Taxonomy, 2025 to 2035
      • By Country
        • Brazil
        • Mexico
        • Colombia
        • Rest of Latin America
      • By Source
      • By Product Type
      • By Flavor
      • By Distribution Channel
      • By End User
    • Market Attractiveness Analysis
      • By Country
      • By Source
      • By Product Type
      • By Flavor
      • By Distribution Channel
      • By End User
    • Key Takeaways
  14. Europe Analysis 2020 to 2024 and Forecast 2025 to 2035, By Country
    • Historical Market Size Value (USD Million) & Volume (Units) Trend Analysis By Market Taxonomy, 2020 to 2024
    • Market Size Value (USD Million) & Volume (Units) Forecast By Market Taxonomy, 2025 to 2035
      • By Country
        • Germany
        • U.K.
        • France
        • Italy
        • Spain
        • Belgium
        • Netherlands
        • Nordic
        • Switzerland
        • Russia
        • Poland
        • Rest of Europe
      • By Source
      • By Product Type
      • By Flavor
      • By Distribution Channel
      • By End User
    • Market Attractiveness Analysis
      • By Country
      • By Source
      • By Product Type
      • By Flavor
      • By Distribution Channel
      • By End User
    • Key Takeaways
  15. East Asia Analysis 2020 to 2024 and Forecast 2025 to 2035, By Country
    • Historical Market Size Value (USD Million) & Volume (Units) Trend Analysis By Market Taxonomy, 2020 to 2024
    • Market Size Value (USD Million) & Volume (Units) Forecast By Market Taxonomy, 2025 to 2035
      • By Country
        • China
        • Japan
        • South Korea
      • By Source
      • By Product Type
      • By Flavor
      • By Distribution Channel
      • By End User
    • Market Attractiveness Analysis
      • By Country
      • By Source
      • By Product Type
      • By Flavor
      • By Distribution Channel
      • By End User
    • Key Takeaways
  16. South Asia & Pacific Analysis 2020 to 2024 and Forecast 2025 to 2035, By Country
    • Historical Market Size Value (USD Million) & Volume (Units) Trend Analysis By Market Taxonomy, 2020 to 2024
    • Market Size Value (USD Million) & Volume (Units) Forecast By Market Taxonomy, 2025 to 2035
      • By Country
        • India
        • Thailand
        • Malaysia
        • Indonesia
        • Singapore
        • Vietnam
        • Australia
        • New Zealand
        • Rest of South Asia
      • By Source
      • By Product Type
      • By Flavor
      • By Distribution Channel
      • By End User
    • Market Attractiveness Analysis
      • By Country
      • By Source
      • By Product Type
      • By Flavor
      • By Distribution Channel
      • By End User
    • Key Takeaways
  17. Middle East and Africa Analysis 2020 to 2024 and Forecast 2025 to 2035, By Country
    • Historical Market Size Value (USD Million) & Volume (Units) Trend Analysis By Market Taxonomy, 2020 to 2024
    • Market Size Value (USD Million) & Volume (Units) Forecast By Market Taxonomy, 2025 to 2035
      • By Country
        • Turkey
        • UAE
        • Saudi Arabia
        • Israel
        • Other GCC Countries
        • North Africa
        • South Africa
      • By Source
      • By Product Type
      • By Flavor
      • By Distribution Channel
      • By End User
    • Market Attractiveness Analysis
      • By Country
      • By Source
      • By Product Type
      • By Flavor
      • By Distribution Channel
      • By End User
    • Key Takeaways
  18. Key Countries Analysis
    • U.S.
      • Pricing Analysis
      • Market Share Analysis, 2024
        • By Source
        • By Product Type
        • By Flavor
        • By Distribution Channel
        • By End User
    • Canada
      • Pricing Analysis
      • Market Share Analysis, 2024
        • By Source
        • By Product Type
        • By Flavor
        • By Distribution Channel
        • By End User
    • Mexico
      • Pricing Analysis
      • Market Share Analysis, 2024
        • By Source
        • By Product Type
        • By Flavor
        • By Distribution Channel
        • By End User
    • Brazil
      • Pricing Analysis
      • Market Share Analysis, 2024
        • By Source
        • By Product Type
        • By Flavor
        • By Distribution Channel
        • By End User
    • Chile
      • Pricing Analysis
      • Market Share Analysis, 2024
        • By Source
        • By Product Type
        • By Flavor
        • By Distribution Channel
        • By End User
    • Germany
      • Pricing Analysis
      • Market Share Analysis, 2024
        • By Source
        • By Product Type
        • By Flavor
        • By Distribution Channel
        • By End User
    • U.K.
      • Pricing Analysis
      • Market Share Analysis, 2024
        • By Source
        • By Product Type
        • By Flavor
        • By Distribution Channel
        • By End User
    • Italy
      • Pricing Analysis
      • Market Share Analysis, 2024
        • By Source
        • By Product Type
        • By Flavor
        • By Distribution Channel
        • By End User
    • Spain
      • Pricing Analysis
      • Market Share Analysis, 2024
        • By Source
        • By Product Type
        • By Flavor
        • By Distribution Channel
        • By End User
    • France
      • Pricing Analysis
      • Market Share Analysis, 2024
        • By Source
        • By Product Type
        • By Flavor
        • By Distribution Channel
        • By End User
    • India
      • Pricing Analysis
      • Market Share Analysis, 2024
        • By Source
        • By Product Type
        • By Flavor
        • By Distribution Channel
        • By End User
    • ASEAN
      • Pricing Analysis
      • Market Share Analysis, 2024
        • By Source
        • By Product Type
        • By Flavor
        • By Distribution Channel
        • By End User
    • Australia & New Zealand
      • Pricing Analysis
      • Market Share Analysis, 2024
        • By Source
        • By Product Type
        • By Flavor
        • By Distribution Channel
        • By End User
    • China
      • Pricing Analysis
      • Market Share Analysis, 2024
        • By Source
        • By Product Type
        • By Flavor
        • By Distribution Channel
        • By End User
    • Japan
      • Pricing Analysis
      • Market Share Analysis, 2024
        • By Source
        • By Product Type
        • By Flavor
        • By Distribution Channel
        • By End User
    • South Korea
      • Pricing Analysis
      • Market Share Analysis, 2024
        • By Source
        • By Product Type
        • By Flavor
        • By Distribution Channel
        • By End User
    • Russia
      • Pricing Analysis
      • Market Share Analysis, 2024
        • By Source
        • By Product Type
        • By Flavor
        • By Distribution Channel
        • By End User
    • Poland
      • Pricing Analysis
      • Market Share Analysis, 2024
        • By Source
        • By Product Type
        • By Flavor
        • By Distribution Channel
        • By End User
    • Hungary
      • Pricing Analysis
      • Market Share Analysis, 2024
        • By Source
        • By Product Type
        • By Flavor
        • By Distribution Channel
        • By End User
    • Kingdom of Saudi Arabia
      • Pricing Analysis
      • Market Share Analysis, 2024
        • By Source
        • By Product Type
        • By Flavor
        • By Distribution Channel
        • By End User
    • Turkiye
      • Pricing Analysis
      • Market Share Analysis, 2024
        • By Source
        • By Product Type
        • By Flavor
        • By Distribution Channel
        • By End User
    • South Africa
      • Pricing Analysis
      • Market Share Analysis, 2024
        • By Source
        • By Product Type
        • By Flavor
        • By Distribution Channel
        • By End User
  19. Market Structure Analysis
    • Competition Dashboard
    • Competition Benchmarking
    • Market Share Analysis of Top Players
      • By Regional
      • By Source
      • By Product Type
      • By Flavor
      • By Distribution Channel
      • By End User
  20. Competition Analysis
    • Competition Deep Dive
      • Arla Foods amba
        • Overview
        • Product Portfolio
        • Profitability by Market Segments (Product/Age /Sales Channel/Region)
        • Sales Footprint
        • Strategy Overview
        • Müller Group
        • Glanbia plc
        • Lantmännen (Propud brand)
        • Valio Ltd.
        • Suntory Beverage & Food Ltd.
        • Lindahls
        • Optimum Nutrition, Inc.
        • Myprotein (The Hut Group)
        • Alpro
    • Assumptions & Acronyms Used
    • Research Methodology

List of Tables

  • Table 1: Global Value (USD Million) Forecast by Region, 2020-2035
  • Table 2: Global Volume (Units) Forecast by Region, 2020-2035
  • Table 3: Global Value (USD Million) Forecast By Source, 2020-2035
  • Table 4: Global Volume (Units) Forecast By Source, 2020-2035
  • Table 5: Global Value (USD Million) Forecast by Product Type, 2020-2035
  • Table 6: Global Volume (Units) Forecast by Product Type, 2020-2035
  • Table 7: Global Value (USD Million) Forecast by Flavor, 2020-2035
  • Table 8: Global Volume (Units) Forecast by Flavor, 2020-2035
  • Table 9: Global Value (USD Million) Forecast by Distribution Channel, 2020-2035
  • Table 10: Global Volume (Units) Forecast by Distribution Channel, 2020-2035
  • Table 11: Global Value (USD Million) Forecast by End User, 2020-2035
  • Table 12: Global Volume (Units) Forecast by End User, 2020-2035
  • Table 13: North America Value (USD Million) Forecast by Country, 2020-2035
  • Table 14: North America Volume (Units) Forecast by Country, 2020-2035
  • Table 15: North America Value (USD Million) Forecast By Source, 2020-2035
  • Table 16: North America Volume (Units) Forecast By Source, 2020-2035
  • Table 17: North America Value (USD Million) Forecast by Product Type, 2020-2035
  • Table 18: North America Volume (Units) Forecast by Product Type, 2020-2035
  • Table 19: North America Value (USD Million) Forecast by Flavor, 2020-2035
  • Table 20: North America Volume (Units) Forecast by Flavor, 2020-2035
  • Table 21: North America Value (USD Million) Forecast by Distribution Channel, 2020-2035
  • Table 22: North America Volume (Units) Forecast by Distribution Channel, 2020-2035
  • Table 23: North America Value (USD Million) Forecast by End User, 2020-2035
  • Table 24: North America Volume (Units) Forecast by End User, 2020-2035
  • Table 25: Latin America Value (USD Million) Forecast by Country, 2020-2035
  • Table 26: Latin America Volume (Units) Forecast by Country, 2020-2035
  • Table 27: Latin America Value (USD Million) Forecast By Source, 2020-2035
  • Table 28: Latin America Volume (Units) Forecast By Source, 2020-2035
  • Table 29: Latin America Value (USD Million) Forecast by Product Type, 2020-2035
  • Table 30: Latin America Volume (Units) Forecast by Product Type, 2020-2035
  • Table 31: Latin America Value (USD Million) Forecast by Flavor, 2020-2035
  • Table 32: Latin America Volume (Units) Forecast by Flavor, 2020-2035
  • Table 33: Latin America Value (USD Million) Forecast by Distribution Channel, 2020-2035
  • Table 34: Latin America Volume (Units) Forecast by Distribution Channel, 2020-2035
  • Table 35: Latin America Value (USD Million) Forecast by End User, 2020-2035
  • Table 36: Latin America Volume (Units) Forecast by End User, 2020-2035
  • Table 37: Europe Value (USD Million) Forecast by Country, 2020-2035
  • Table 38: Europe Volume (Units) Forecast by Country, 2020-2035
  • Table 39: Europe Value (USD Million) Forecast By Source, 2020-2035
  • Table 40: Europe Volume (Units) Forecast By Source, 2020-2035
  • Table 41: Europe Value (USD Million) Forecast by Product Type, 2020-2035
  • Table 42: Europe Volume (Units) Forecast by Product Type, 2020-2035
  • Table 43: Europe Value (USD Million) Forecast by Flavor, 2020-2035
  • Table 44: Europe Volume (Units) Forecast by Flavor, 2020-2035
  • Table 45: Europe Value (USD Million) Forecast by Distribution Channel, 2020-2035
  • Table 46: Europe Volume (Units) Forecast by Distribution Channel, 2020-2035
  • Table 47: Europe Value (USD Million) Forecast by End User, 2020-2035
  • Table 48: Europe Volume (Units) Forecast by End User, 2020-2035
  • Table 49: East Asia Value (USD Million) Forecast by Country, 2020-2035
  • Table 50: East Asia Volume (Units) Forecast by Country, 2020-2035
  • Table 51: East Asia Value (USD Million) Forecast By Source, 2020-2035
  • Table 52: East Asia Volume (Units) Forecast By Source, 2020-2035
  • Table 53: East Asia Value (USD Million) Forecast by Product Type, 2020-2035
  • Table 54: East Asia Volume (Units) Forecast by Product Type, 2020-2035
  • Table 55: East Asia Value (USD Million) Forecast by Flavor, 2020-2035
  • Table 56: East Asia Volume (Units) Forecast by Flavor, 2020-2035
  • Table 57: East Asia Value (USD Million) Forecast by Distribution Channel, 2020-2035
  • Table 58: East Asia Volume (Units) Forecast by Distribution Channel, 2020-2035
  • Table 59: East Asia Value (USD Million) Forecast by End User, 2020-2035
  • Table 60: East Asia Volume (Units) Forecast by End User, 2020-2035
  • Table 61: South Asia & Pacific Value (USD Million) Forecast by Country, 2020-2035
  • Table 62: South Asia & Pacific Volume (Units) Forecast by Country, 2020-2035
  • Table 63: South Asia & Pacific Value (USD Million) Forecast By Source, 2020-2035
  • Table 64: South Asia & Pacific Volume (Units) Forecast By Source, 2020-2035
  • Table 65: South Asia & Pacific Value (USD Million) Forecast by Product Type, 2020-2035
  • Table 66: South Asia & Pacific Volume (Units) Forecast by Product Type, 2020-2035
  • Table 67: South Asia & Pacific Value (USD Million) Forecast by Flavor, 2020-2035
  • Table 68: South Asia & Pacific Volume (Units) Forecast by Flavor, 2020-2035
  • Table 69: South Asia & Pacific Value (USD Million) Forecast by Distribution Channel, 2020-2035
  • Table 70: South Asia & Pacific Volume (Units) Forecast by Distribution Channel, 2020-2035
  • Table 71: South Asia & Pacific Value (USD Million) Forecast by End User, 2020-2035
  • Table 72: South Asia & Pacific Volume (Units) Forecast by End User, 2020-2035
  • Table 73: Middle East and Africa Value (USD Million) Forecast by Country, 2020-2035
  • Table 74: Middle East and Africa Volume (Units) Forecast by Country, 2020-2035
  • Table 75: Middle East and Africa Value (USD Million) Forecast By Source, 2020-2035
  • Table 76: Middle East and Africa Volume (Units) Forecast By Source, 2020-2035
  • Table 77: Middle East and Africa Value (USD Million) Forecast by Product Type, 2020-2035
  • Table 78: Middle East and Africa Volume (Units) Forecast by Product Type, 2020-2035
  • Table 79: Middle East and Africa Value (USD Million) Forecast by Flavor, 2020-2035
  • Table 80: Middle East and Africa Volume (Units) Forecast by Flavor, 2020-2035
  • Table 81: Middle East and Africa Value (USD Million) Forecast by Distribution Channel, 2020-2035
  • Table 82: Middle East and Africa Volume (Units) Forecast by Distribution Channel, 2020-2035
  • Table 83: Middle East and Africa Value (USD Million) Forecast by End User, 2020-2035
  • Table 84: Middle East and Africa Volume (Units) Forecast by End User, 2020-2035

List of Figures

  • Figure 1: Global Volume (Units) Forecast 2020-2035
  • Figure 2: Global Pricing Analysis
  • Figure 3: Global Value (USD Million) Forecast 2020-2035
  • Figure 4: Global Value Share and BPS Analysis By Source, 2025 and 2035
  • Figure 5: Global Y-o-Y Growth Comparison By Source, 2025-2035
  • Figure 6: Global Attractiveness Analysis By Source
  • Figure 7: Global Value Share and BPS Analysis by Product Type, 2025 and 2035
  • Figure 8: Global Y-o-Y Growth Comparison by Product Type, 2025-2035
  • Figure 9: Global Attractiveness Analysis by Product Type
  • Figure 10: Global Value Share and BPS Analysis by Flavor, 2025 and 2035
  • Figure 11: Global Y-o-Y Growth Comparison by Flavor, 2025-2035
  • Figure 12: Global Attractiveness Analysis by Flavor
  • Figure 13: Global Value Share and BPS Analysis by Distribution Channel, 2025 and 2035
  • Figure 14: Global Y-o-Y Growth Comparison by Distribution Channel, 2025-2035
  • Figure 15: Global Attractiveness Analysis by Distribution Channel
  • Figure 16: Global Value Share and BPS Analysis by End User, 2025 and 2035
  • Figure 17: Global Y-o-Y Growth Comparison by End User, 2025-2035
  • Figure 18: Global Attractiveness Analysis by End User
  • Figure 19: Global Value (USD Million) Share and BPS Analysis by Region, 2025 and 2035
  • Figure 20: Global Y-o-Y Growth Comparison by Region, 2025-2035
  • Figure 21: Global Attractiveness Analysis by Region
  • Figure 22: North America Incremental $ Opportunity, 2025-2035
  • Figure 23: Latin America Incremental $ Opportunity, 2025-2035
  • Figure 24: Europe Incremental $ Opportunity, 2025-2035
  • Figure 25: East Asia Incremental $ Opportunity, 2025-2035
  • Figure 26: South Asia & Pacific Incremental $ Opportunity, 2025-2035
  • Figure 27: Middle East and Africa Incremental $ Opportunity, 2025-2035
  • Figure 28: North America Value Share and BPS Analysis by Country, 2025 and 2035
  • Figure 29: North America Value Share and BPS Analysis By Source, 2025 and 2035
  • Figure 30: North America Y-o-Y Growth Comparison By Source, 2025-2035
  • Figure 31: North America Attractiveness Analysis By Source
  • Figure 32: North America Value Share and BPS Analysis by Product Type, 2025 and 2035
  • Figure 33: North America Y-o-Y Growth Comparison by Product Type, 2025-2035
  • Figure 34: North America Attractiveness Analysis by Product Type
  • Figure 35: North America Value Share and BPS Analysis by Flavor, 2025 and 2035
  • Figure 36: North America Y-o-Y Growth Comparison by Flavor, 2025-2035
  • Figure 37: North America Attractiveness Analysis by Flavor
  • Figure 38: North America Value Share and BPS Analysis by Distribution Channel, 2025 and 2035
  • Figure 39: North America Y-o-Y Growth Comparison by Distribution Channel, 2025-2035
  • Figure 40: North America Attractiveness Analysis by Distribution Channel
  • Figure 41: North America Value Share and BPS Analysis by End User, 2025 and 2035
  • Figure 42: North America Y-o-Y Growth Comparison by End User, 2025-2035
  • Figure 43: North America Attractiveness Analysis by End User
  • Figure 44: Latin America Value Share and BPS Analysis by Country, 2025 and 2035
  • Figure 45: Latin America Value Share and BPS Analysis By Source, 2025 and 2035
  • Figure 46: Latin America Y-o-Y Growth Comparison By Source, 2025-2035
  • Figure 47: Latin America Attractiveness Analysis By Source
  • Figure 48: Latin America Value Share and BPS Analysis by Product Type, 2025 and 2035
  • Figure 49: Latin America Y-o-Y Growth Comparison by Product Type, 2025-2035
  • Figure 50: Latin America Attractiveness Analysis by Product Type
  • Figure 51: Latin America Value Share and BPS Analysis by Flavor, 2025 and 2035
  • Figure 52: Latin America Y-o-Y Growth Comparison by Flavor, 2025-2035
  • Figure 53: Latin America Attractiveness Analysis by Flavor
  • Figure 54: Latin America Value Share and BPS Analysis by Distribution Channel, 2025 and 2035
  • Figure 55: Latin America Y-o-Y Growth Comparison by Distribution Channel, 2025-2035
  • Figure 56: Latin America Attractiveness Analysis by Distribution Channel
  • Figure 57: Latin America Value Share and BPS Analysis by End User, 2025 and 2035
  • Figure 58: Latin America Y-o-Y Growth Comparison by End User, 2025-2035
  • Figure 59: Latin America Attractiveness Analysis by End User
  • Figure 60: Europe Value Share and BPS Analysis by Country, 2025 and 2035
  • Figure 61: Europe Value Share and BPS Analysis By Source, 2025 and 2035
  • Figure 62: Europe Y-o-Y Growth Comparison By Source, 2025-2035
  • Figure 63: Europe Attractiveness Analysis By Source
  • Figure 64: Europe Value Share and BPS Analysis by Product Type, 2025 and 2035
  • Figure 65: Europe Y-o-Y Growth Comparison by Product Type, 2025-2035
  • Figure 66: Europe Attractiveness Analysis by Product Type
  • Figure 67: Europe Value Share and BPS Analysis by Flavor, 2025 and 2035
  • Figure 68: Europe Y-o-Y Growth Comparison by Flavor, 2025-2035
  • Figure 69: Europe Attractiveness Analysis by Flavor
  • Figure 70: Europe Value Share and BPS Analysis by Distribution Channel, 2025 and 2035
  • Figure 71: Europe Y-o-Y Growth Comparison by Distribution Channel, 2025-2035
  • Figure 72: Europe Attractiveness Analysis by Distribution Channel
  • Figure 73: Europe Value Share and BPS Analysis by End User, 2025 and 2035
  • Figure 74: Europe Y-o-Y Growth Comparison by End User, 2025-2035
  • Figure 75: Europe Attractiveness Analysis by End User
  • Figure 76: East Asia Value Share and BPS Analysis by Country, 2025 and 2035
  • Figure 77: East Asia Value Share and BPS Analysis By Source, 2025 and 2035
  • Figure 78: East Asia Y-o-Y Growth Comparison By Source, 2025-2035
  • Figure 79: East Asia Attractiveness Analysis By Source
  • Figure 80: East Asia Value Share and BPS Analysis by Product Type, 2025 and 2035
  • Figure 81: East Asia Y-o-Y Growth Comparison by Product Type, 2025-2035
  • Figure 82: East Asia Attractiveness Analysis by Product Type
  • Figure 83: East Asia Value Share and BPS Analysis by Flavor, 2025 and 2035
  • Figure 84: East Asia Y-o-Y Growth Comparison by Flavor, 2025-2035
  • Figure 85: East Asia Attractiveness Analysis by Flavor
  • Figure 86: East Asia Value Share and BPS Analysis by Distribution Channel, 2025 and 2035
  • Figure 87: East Asia Y-o-Y Growth Comparison by Distribution Channel, 2025-2035
  • Figure 88: East Asia Attractiveness Analysis by Distribution Channel
  • Figure 89: East Asia Value Share and BPS Analysis by End User, 2025 and 2035
  • Figure 90: East Asia Y-o-Y Growth Comparison by End User, 2025-2035
  • Figure 91: East Asia Attractiveness Analysis by End User
  • Figure 92: South Asia & Pacific Value Share and BPS Analysis by Country, 2025 and 2035
  • Figure 93: South Asia & Pacific Value Share and BPS Analysis By Source, 2025 and 2035
  • Figure 94: South Asia & Pacific Y-o-Y Growth Comparison By Source, 2025-2035
  • Figure 95: South Asia & Pacific Attractiveness Analysis By Source
  • Figure 96: South Asia & Pacific Value Share and BPS Analysis by Product Type, 2025 and 2035
  • Figure 97: South Asia & Pacific Y-o-Y Growth Comparison by Product Type, 2025-2035
  • Figure 98: South Asia & Pacific Attractiveness Analysis by Product Type
  • Figure 99: South Asia & Pacific Value Share and BPS Analysis by Flavor, 2025 and 2035
  • Figure 100: South Asia & Pacific Y-o-Y Growth Comparison by Flavor, 2025-2035
  • Figure 101: South Asia & Pacific Attractiveness Analysis by Flavor
  • Figure 102: South Asia & Pacific Value Share and BPS Analysis by Distribution Channel, 2025 and 2035
  • Figure 103: South Asia & Pacific Y-o-Y Growth Comparison by Distribution Channel, 2025-2035
  • Figure 104: South Asia & Pacific Attractiveness Analysis by Distribution Channel
  • Figure 105: South Asia & Pacific Value Share and BPS Analysis by End User, 2025 and 2035
  • Figure 106: South Asia & Pacific Y-o-Y Growth Comparison by End User, 2025-2035
  • Figure 107: South Asia & Pacific Attractiveness Analysis by End User
  • Figure 108: Middle East and Africa Value Share and BPS Analysis by Country, 2025 and 2035
  • Figure 109: Middle East and Africa Value Share and BPS Analysis By Source, 2025 and 2035
  • Figure 110: Middle East and Africa Y-o-Y Growth Comparison By Source, 2025-2035
  • Figure 111: Middle East and Africa Attractiveness Analysis By Source
  • Figure 112: Middle East and Africa Value Share and BPS Analysis by Product Type, 2025 and 2035
  • Figure 113: Middle East and Africa Y-o-Y Growth Comparison by Product Type, 2025-2035
  • Figure 114: Middle East and Africa Attractiveness Analysis by Product Type
  • Figure 115: Middle East and Africa Value Share and BPS Analysis by Flavor, 2025 and 2035
  • Figure 116: Middle East and Africa Y-o-Y Growth Comparison by Flavor, 2025-2035
  • Figure 117: Middle East and Africa Attractiveness Analysis by Flavor
  • Figure 118: Middle East and Africa Value Share and BPS Analysis by Distribution Channel, 2025 and 2035
  • Figure 119: Middle East and Africa Y-o-Y Growth Comparison by Distribution Channel, 2025-2035
  • Figure 120: Middle East and Africa Attractiveness Analysis by Distribution Channel
  • Figure 121: Middle East and Africa Value Share and BPS Analysis by End User, 2025 and 2035
  • Figure 122: Middle East and Africa Y-o-Y Growth Comparison by End User, 2025-2035
  • Figure 123: Middle East and Africa Attractiveness Analysis by End User
  • Figure 124: Global - Tier Structure Analysis
  • Figure 125: Global - Company Share Analysis

Frequently Asked Questions

How big is the Protein Puddings Market in 2025?

The global Protein Puddings is estimated to be valued at USD 1,440.6 million in 2025.

What will be the size of Protein Puddings Market in 2035?

The market size for the Protein Puddings is projected to reach USD 2,804.4 million by 2035.

How much will be the Protein Puddings Market growth between 2025 and 2035?

The Protein Puddings is expected to grow at a 6.9% CAGR between 2025 and 2035.

What are the key product types in the Protein Puddings Market?

The key product types in the Protein Puddings Market are Ready-to-Eat (RTE) Pudding Cups, Powdered Pudding Mixes, On-the-Go Squeeze Packs, and Refrigerated Multi-Serve Tubs.

Which product type segment to contribute significant share in the Protein Puddings Market in 2025?

In terms of product type, the Ready-to-Eat (RTE) Pudding Cups segment is expected to command the highest share at 48.6% in 2025.

Explore Similar Insights

Future Market Insights

Protein Puddings Market

Chat With

MaRIA

Hi There, I am MaRIA, Your Market Research Intelligence Assistant. How may I help you?