Protein Purification Resin Market
Market Insights on Protein Purification Resin covering sales outlook, demand forecast & up-to-date key trends
Protein Purification Resin Market by Type, End Use, Distribution Channel & Region - Forecast 2022 – 2032
Protein Purification Resin Market Outlook (2022-2032)
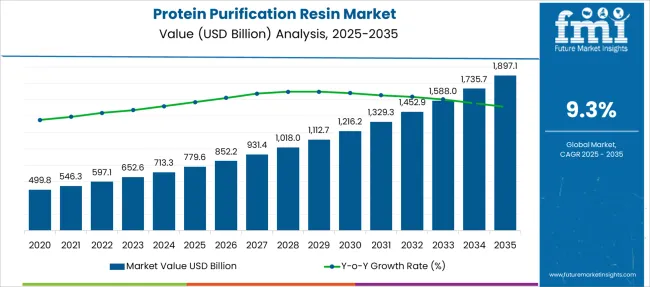
[308 Pages Report] The protein purification resin market sits at an evaluation of US$ 5.7 billion in 2022 and is projected to reach a market share of US$ 13.8 billion in 2032. The market is said to expand at a staggering CAGR of 9.3% during the forecast period from 2022 to 2032.
The key market driving factor of the global protein purification resin market is the increasing accessibility of non-governmental and governmental funds coupled with increased expenditure on research and development activities across the world.
Attributes |
Details |
Protein Purification Resin Market CAGR |
9.3% |
Protein Purification Resin Market Size (2021) |
US$ 5.7 Bn |
Protein Purification Resin Market Size (2032) |
US$ 13.8 Bn |
Since several government organizations are spending on numerous research and development activities, the demand for protein purification resin is primarily used to meet this requirement. Protein purification resin is generally used in pharmaceutical and academic research facilities and laboratories for several protein purification technologies like high-performance liquid chromatography, affinity chromatography, and fast protein liquid chromatography.
Protein purification resin is used for efficient, convenient, and consistently splitting of antibodies and proteins from the crude samples during the downstream processing. Protein purification resins are agarose-based, silica-based, Sepharose-based, etc. Protein research involves techniques such as separation, concentration, and stabilization, and they eradicate contaminants such as viruses, endotoxins, and nucleic acid. The techniques consist of verifying and maintaining a purification table to trace the development of the enzyme. They are generally used to categorize a protein’s function, interactions, and structure.
The sales of protein purification resin are on the rise owing to more expenditure on research and development activities, and an increase in the prevalence of governmental and non-governmental funds is promoting the growth of the global protein purification resin market. The COVID-19 pandemic resulted in an interruption in the protein purification procedure, and this negatively impacted the global market. However, presently the additional funds aimed toward the research and development are a breather for the market and helping it recover the loss incurred during the pandemic.
The demand for protein purification resin is primarily for the use of this technique in downstream processing in the academic institute, research and development, and pharmaceutical industry.
Let us know your requirement to get
100% FREE customization
What are the Research and Developments in the Global Protein Purification Resin Market?
Governments across the world are actively investing in research and development and setting out initiatives that boost the development and growth of the biotechnology and pharmaceutical markets. The supportive governments are also providing several benefits through grants, tax incentives, and investment-friendly regulations, amongst others.
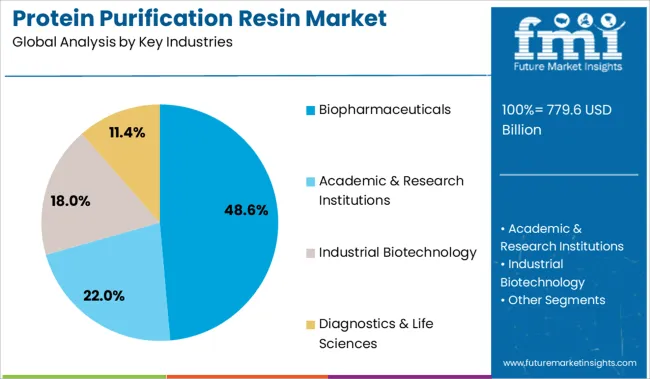
The demand for the protein purification resin market is higher in the pharmaceutical industry owing to considerable investments in the development of the biomarker-specific molecule. The protein purification resin market is growing owing to lucrative funding from both private and public research organizations for protein research and increasing research in the structural-based drug design field.
Technological advancements such as automated purification instruments and single-use technologies are also fuelling the growth of the protein purification resin market. Also, the increasing trend of Contract Research Organization (CRO) is creating an upsurge in demand for protein purification resin.
The increasing prevalence of disease and several other health issues has resulted in additional consumption of pharmaceutical products, and this is said to promote the growth of this market during the forecast years.
In the pharmaceutical industry, the most crucial factor is the purity of the protein. The protein purification resin is utilized in the pharmaceutical industry in medium- and small-scale downstream processing. In the developing regions, the rate of expansion of the pharmaceutical industry is higher, and this is creating opportunities and will support the global protein purification resin market.
Several protein purification resin manufacturers across the world are constantly inventing and launching novel products which are suitable for varied parameters such as low-pressure to medium-pressure liquid chromatography. The easy accessibility of innovative and novel protein purification resin products is escalating the demand and sales of the products in the global market.
What is the Regional Analysis of the Protein Purification Resin Market?
The global protein purification resin market can be divided into seven distinctive regions. In developed nations, rapid industrialization and innovation will continue to drive the sales of protein purification resin expansion.
North America is responsible for the biggest market share of the global protein purification resin market followed by Europe. These regions possess strong research and development field and the support from pharmaceutical industry are backing the increased consumption of protein purification resin in the global market by the countries of these regions.
Also, in North America, the funding for life science research is higher, this region also has presence of key market players, and established research infrastructure. These factors will promote the growth of protein purification resin market in this region.
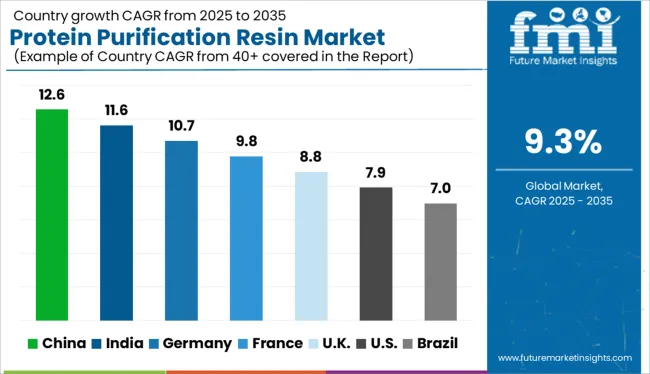
Asia Pacific is anticipated to garner highest growth rate amongst the global protein purification resin market. This is due to larger research and development activities in this region which will boost the consumption of protein purification resin in the global market. Developing countries such as China and India have increased initiatives undertaken by their governments. Also, the governments of these countries are supporting funds for the development of new and inventive purification methods.
Find your sweet spots for generating winning opportunities in this market.
Talk to AnalystHow Competition Impacts the Protein Purification Resin Market?
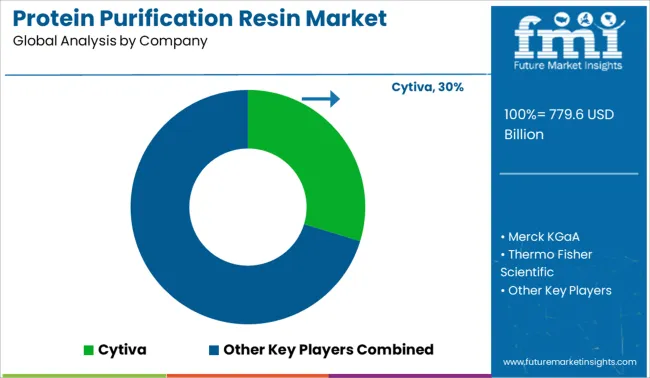
Few global protein purification resin market key players are Promega Corporation, Labome, Pall Corporation, IBA GmbH, Takara Bio Inc., Purolite Life Sciences, BioVision Incorporated, Westburg BV, Roche Holding AG, Sterogene Bioseparations, Expedeon Ltd., Thermo-Fisher Scientific, Mayflower Bioscience, Merck KGaA, Molecular Cloning Laboratories.
These players are using numerous strategies, such as mergers & acquisitions, partnerships, collaborations, etc., to strengthen their market position and augment the sales of protein purification resin. For instance, in February 2022, Merck KGaA which is a leader in science and technology, declared the closure of transaction to acquire Exelead, after the regulatory clearances and execution of other mandatory closing conditions for nearly USD 780 million in cash.
Report Scope
Report Attribute |
Details |
Growth Rate |
CAGR of 9.3% from 2022 to 2032 |
Base Year for Estimation |
2021 |
Historical Data |
2015-2020 |
Forecast Period |
2022-2032 |
Quantitative Units |
Revenue in USD Million, Volume in Kilotons and CAGR from 2022-2032 |
Report Coverage |
Revenue Forecast, Volume Forecast, Company Ranking, Competitive Landscape, Growth Factors, Trends and Pricing Analysis |
Segments Covered |
|
Regions Covered |
|
Key Countries Profiled |
|
Key Companies Profiled |
|
Customization |
Available Upon Request |

An unified Market Research Subscription Platform, built for today’s disparate research needs.
Key Segments Profiled in the Protein Purification Resin Market Survey
By Type:
- Protein A
- Protein G
- Protein L
By End Use:
- Pharmaceutical
- Research Laboratories
- Academic Research Institute
By Distribution Channel:
- Direct Sales Channel/ B2B
- Indirect Sales Channel/B2C
- Specialty Stores
- Online Retail
- Other Retail Format
By Region:
- North America
- Latin America
- Western Europe
- Eastern Europe
- Asia Pacific
- Japan
- Middle East and Africa
Frequently Asked Questions
The global protein purification resin market is set to advance at a CAGR of 9.3% from 2022 to 2032.
North America followed by Europe is likely to hold major protein purification resin market share during the forecast period.
Protein Purification Resin market is expected to reach US$ 13.8 billion by 2032.
1. Executive Summary
1.1. Global Market Outlook
1.2. Demand-side Trends
1.3. Supply-side Trends
1.4. Technology Roadmap Analysis
1.5. Analysis and Recommendations
2. Market Overview
2.1. Market Coverage / Taxonomy
2.2. Market Definition / Scope / Limitations
3. Market Background
3.1. Market Dynamics
3.1.1. Drivers
3.1.2. Restraints
3.1.3. Opportunity
3.1.4. Trends
3.2. Scenario Forecast
3.2.1. Demand in Optimistic Scenario
3.2.2. Demand in Likely Scenario
3.2.3. Demand in Conservative Scenario
3.3. Opportunity Map Analysis
3.4. Product Life Cycle Analysis
3.5. Supply Chain Analysis
3.5.1. Supply Side Participants and their Roles
3.5.1.1. Producers
3.5.1.2. Mid-Level Participants (Traders/ Agents/ Brokers)
3.5.1.3. Wholesalers and Distributors
3.5.2. Value Added and Value Created at Node in the Supply Chain
3.5.3. List of Raw Material Suppliers
3.5.4. List of Existing and Potential Buyer’s
3.6. Investment Feasibility Matrix
3.7. Value Chain Analysis
3.7.1. Profit Margin Analysis
3.7.2. Wholesalers and Distributors
3.7.3. Retailers
3.8. PESTLE and Porter’s Analysis
3.9. Regulatory Landscape
3.9.1. By Key Regions
3.9.2. By Key Countries
3.10. Regional Parent Market Outlook
3.11. Production and Consumption Statistics
3.12. Import and Export Statistics
4. Global Protein Purification Resin Market Analysis 2017-2021 and Forecast, 2022-2032
4.1. Historical Market Size Value (US$ Mn) & Volume (Tons) Analysis, 2017-2021
4.2. Current and Future Market Size Value (US$ Mn) & Volume (Tons) Projections, 2022-2032
4.2.1. Y-o-Y Growth Trend Analysis
4.2.2. Absolute $ Opportunity Analysis
5. Global Protein Purification Resin Market Analysis 2017-2021 and Forecast 2022-2032, By Type
5.1. Introduction / Key Findings
5.2. Historical Market Size Value (US$ Mn) & Volume (Tons) Analysis By Type, 2017-2021
5.3. Current and Future Market Size Value (US$ Mn) & Volume (Tons) Analysis and Forecast By Type, 2022-2032
5.3.1. Protein A
5.3.2. Protein G
5.3.3. Protein L
5.4. Y-o-Y Growth Trend Analysis By Type, 2017-2021
5.5. Absolute $ Opportunity Analysis By Type, 2022-2032
6. Global Protein Purification Resin Market Analysis 2017-2021 and Forecast 2022-2032, By End Use
6.1. Introduction / Key Findings
6.2. Historical Market Size Value (US$ Mn) & Volume (Tons) Analysis By End Use, 2017-2021
6.3. Current and Future Market Size Value (US$ Mn) & Volume (Tons) Analysis and Forecast By End Use, 2022-2032
6.3.1. Pharmaceutical
6.3.2. Research Laboratories
6.3.3. Academic Research Institute
6.4. Y-o-Y Growth Trend Analysis By End Use, 2017-2021
6.5. Absolute $ Opportunity Analysis By End Use, 2022-2032
7. Global Protein Purification Resin Market Analysis 2017-2021 and Forecast 2022-2032, By Distribution Channel
7.1. Introduction / Key Findings
7.2. Historical Market Size Value (US$ Mn) & Volume (Tons) Analysis By Distribution Channel, 2017-2021
7.3. Current and Future Market Size Value (US$ Mn) & Volume (Tons) Analysis and Forecast By Distribution Channel, 2022-2032
7.3.1. Direct Sales
7.3.2. Indirect Sales
7.3.2.1. Specialty Stores
7.3.2.2. Online Retail
7.3.2.3. Other Retail Format
7.4. Y-o-Y Growth Trend Analysis By Distribution Channel, 2017-2021
7.5. Absolute $ Opportunity Analysis By Distribution Channel, 2022-2032
8. Global Protein Purification Resin Market Analysis 2017-2021 and Forecast 2022-2032, By Region
8.1. Introduction
8.2. Historical Market Size Value (US$ Mn) & Volume (Tons) Analysis By Region, 2017-2021
8.3. Current Market Size Value (US$ Mn) & Volume (Tons) Analysis and Forecast By Region, 2022-2032
8.3.1. North America
8.3.2. Latin America
8.3.3. Europe
8.3.4. Asia Pacific
8.3.5. MEA
8.4. Market Attractiveness Analysis By Region
9. North America Protein Purification Resin Market Analysis 2017-2021 and Forecast 2022-2032, By Country
9.1. Historical Market Size Value (US$ Mn) & Volume (Tons) Trend Analysis By Market Taxonomy, 2017-2021
9.2. Market Size Value (US$ Mn) & Volume (Tons) Forecast By Market Taxonomy, 2022-2032
9.2.1. By Country
9.2.1.1. U.S.
9.2.1.2. Canada
9.2.2. By Type
9.2.3. By End Use
9.2.4. By Distribution Channel
9.3. Market Attractiveness Analysis
9.3.1. By Country
9.3.2. By Type
9.3.3. By End Use
9.3.4. By Distribution Channel
9.4. Key Takeaways
10. Latin America Protein Purification Resin Market Analysis 2017-2021 and Forecast 2022-2032, By Country
10.1. Historical Market Size Value (US$ Mn) & Volume (Tons) Trend Analysis By Market Taxonomy, 2017-2021
10.2. Market Size Value (US$ Mn) & Volume (Tons) Forecast By Market Taxonomy, 2022-2032
10.2.1. By Country
10.2.1.1. Brazil
10.2.1.2. Mexico
10.2.1.3. Rest of Latin America
10.2.2. By Type
10.2.3. By End Use
10.2.4. By Distribution Channel
10.3. Market Attractiveness Analysis
10.3.1. By Country
10.3.2. By Type
10.3.3. By End Use
10.3.4. By Distribution Channel
10.4. Key Takeaways
11. Europe Protein Purification Resin Market Analysis 2017-2021 and Forecast 2022-2032, By Country
11.1. Historical Market Size Value (US$ Mn) & Volume (Tons) Trend Analysis By Market Taxonomy, 2017-2021
11.2. Market Size Value (US$ Mn) & Volume (Tons) Forecast By Market Taxonomy, 2022-2032
11.2.1. By Country
11.2.1.1. Germany
11.2.1.2. U.K.
11.2.1.3. France
11.2.1.4. Spain
11.2.1.5. Italy
11.2.1.6. Rest of Europe
11.2.2. By Type
11.2.3. By End Use
11.2.4. By Distribution Channel
11.3. Market Attractiveness Analysis
11.3.1. By Country
11.3.2. By Type
11.3.3. By End Use
11.3.4. By Distribution Channel
11.4. Key Takeaways
12. Asia Pacific Protein Purification Resin Market Analysis 2017-2021 and Forecast 2022-2032, By Country
12.1. Historical Market Size Value (US$ Mn) & Volume (Tons) Trend Analysis By Market Taxonomy, 2017-2021
12.2. Market Size Value (US$ Mn) & Volume (Tons) Forecast By Market Taxonomy, 2022-2032
12.2.1. By Country
12.2.1.1. China
12.2.1.2. Japan
12.2.1.3. South Korea
12.2.1.4. Malaysia
12.2.1.5. Singapore
12.2.1.6. Australia
12.2.1.7. New Zealand
12.2.1.8. Rest of APAC
12.2.2. By Type
12.2.3. By End Use
12.2.4. By Distribution Channel
12.3. Market Attractiveness Analysis
12.3.1. By Country
12.3.2. By Type
12.3.3. By End Use
12.3.4. By Distribution Channel
12.4. Key Takeaways
13. MEA Protein Purification Resin Market Analysis 2017-2021 and Forecast 2022-2032, By Country
13.1. Historical Market Size Value (US$ Mn) & Volume (Tons) Trend Analysis By Market Taxonomy, 2017-2021
13.2. Market Size Value (US$ Mn) & Volume (Tons) Forecast By Market Taxonomy, 2022-2032
13.2.1. By Country
13.2.1.1. GCC Countries
13.2.1.2. South Africa
13.2.1.3. Israel
13.2.1.4. Rest of MEA
13.2.2. By Type
13.2.3. By End Use
13.2.4. By Distribution Channel
13.3. Market Attractiveness Analysis
13.3.1. By Country
13.3.2. By Type
13.3.3. By End Use
13.3.4. By Distribution Channel
13.4. Key Takeaways
14. Key Countries Protein Purification Resin Market Analysis
14.1. U.S.
14.1.1. Pricing Analysis
14.1.2. Market Share Analysis, 2021
14.1.2.1. By Type
14.1.2.2. By End Use
14.1.2.3. By Distribution Channel
14.2. Canada
14.2.1. Pricing Analysis
14.2.2. Market Share Analysis, 2021
14.2.2.1. By Type
14.2.2.2. By End Use
14.2.2.3. By Distribution Channel
14.3. Brazil
14.3.1. Pricing Analysis
14.3.2. Market Share Analysis, 2021
14.3.2.1. By Type
14.3.2.2. By End Use
14.3.2.3. By Distribution Channel
14.4. Mexico
14.4.1. Pricing Analysis
14.4.2. Market Share Analysis, 2021
14.4.2.1. By Type
14.4.2.2. By End Use
14.4.2.3. By Distribution Channel
14.5. Germany
14.5.1. Pricing Analysis
14.5.2. Market Share Analysis, 2021
14.5.2.1. By Type
14.5.2.2. By End Use
14.5.2.3. By Distribution Channel
14.6. U.K.
14.6.1. Pricing Analysis
14.6.2. Market Share Analysis, 2021
14.6.2.1. By Type
14.6.2.2. By End Use
14.6.2.3. By Distribution Channel
14.7. France
14.7.1. Pricing Analysis
14.7.2. Market Share Analysis, 2021
14.7.2.1. By Type
14.7.2.2. By End Use
14.7.2.3. By Distribution Channel
14.8. Spain
14.8.1. Pricing Analysis
14.8.2. Market Share Analysis, 2021
14.8.2.1. By Type
14.8.2.2. By End Use
14.8.2.3. By Distribution Channel
14.9. Italy
14.9.1. Pricing Analysis
14.9.2. Market Share Analysis, 2021
14.9.2.1. By Type
14.9.2.2. By End Use
14.9.2.3. By Distribution Channel
14.10. China
14.10.1. Pricing Analysis
14.10.2. Market Share Analysis, 2021
14.10.2.1. By Type
14.10.2.2. By End Use
14.10.2.3. By Distribution Channel
14.11. Japan
14.11.1. Pricing Analysis
14.11.2. Market Share Analysis, 2021
14.11.2.1. By Type
14.11.2.2. By End Use
14.11.2.3. By Distribution Channel
14.12. South Korea
14.12.1. Pricing Analysis
14.12.2. Market Share Analysis, 2021
14.12.2.1. By Type
14.12.2.2. By End Use
14.12.2.3. By Distribution Channel
14.13. Malaysia
14.13.1. Pricing Analysis
14.13.2. Market Share Analysis, 2021
14.13.2.1. By Type
14.13.2.2. By End Use
14.13.2.3. By Distribution Channel
14.14. Singapore
14.14.1. Pricing Analysis
14.14.2. Market Share Analysis, 2021
14.14.2.1. By Type
14.14.2.2. By End Use
14.14.2.3. By Distribution Channel
14.15. Australia
14.15.1. Pricing Analysis
14.15.2. Market Share Analysis, 2021
14.15.2.1. By Type
14.15.2.2. By End Use
14.15.2.3. By Distribution Channel
14.16. New Zealand
14.16.1. Pricing Analysis
14.16.2. Market Share Analysis, 2021
14.16.2.1. By Type
14.16.2.2. By End Use
14.16.2.3. By Distribution Channel
14.17. GCC Countries
14.17.1. Pricing Analysis
14.17.2. Market Share Analysis, 2021
14.17.2.1. By Type
14.17.2.2. By End Use
14.17.2.3. By Distribution Channel
14.18. South Africa
14.18.1. Pricing Analysis
14.18.2. Market Share Analysis, 2021
14.18.2.1. By Type
14.18.2.2. By End Use
14.18.2.3. By Distribution Channel
14.19. Israel
14.19.1. Pricing Analysis
14.19.2. Market Share Analysis, 2021
14.19.2.1. By Type
14.19.2.2. By End Use
14.19.2.3. By Distribution Channel
15. Market Structure Analysis
15.1. Competition Dashboard
15.2. Competition Benchmarking
15.3. Market Share Analysis of Top Players
15.3.1. By Regional
15.3.2. By Type
15.3.3. By End Use
15.3.4. By Distribution Channel
16. Competition Analysis
16.1. Competition Deep Dive
16.1.1. Promega Corporation
16.1.1.1. Overview
16.1.1.2. Product Portfolio
16.1.1.3. Profitability by Market Segments
16.1.1.4. Sales Footprint
16.1.1.5. Strategy Overview
16.1.1.5.1. Marketing Strategy
16.1.1.5.2. Product Strategy
16.1.1.5.3. Channel Strategy
16.1.2. Labome
16.1.2.1. Overview
16.1.2.2. Product Portfolio
16.1.2.3. Profitability by Market Segments
16.1.2.4. Sales Footprint
16.1.2.5. Strategy Overview
16.1.2.5.1. Marketing Strategy
16.1.2.5.2. Product Strategy
16.1.2.5.3. Channel Strategy
16.1.3. Pall Corporation
16.1.3.1. Overview
16.1.3.2. Product Portfolio
16.1.3.3. Profitability by Market Segments
16.1.3.4. Sales Footprint
16.1.3.5. Strategy Overview
16.1.3.5.1. Marketing Strategy
16.1.3.5.2. Product Strategy
16.1.3.5.3. Channel Strategy
16.1.4. IBA GmbH
16.1.4.1. Overview
16.1.4.2. Product Portfolio
16.1.4.3. Profitability by Market Segments
16.1.4.4. Sales Footprint
16.1.4.5. Strategy Overview
16.1.4.5.1. Marketing Strategy
16.1.4.5.2. Product Strategy
16.1.4.5.3. Channel Strategy
16.1.5. Takara Bio Inc.
16.1.5.1. Overview
16.1.5.2. Product Portfolio
16.1.5.3. Profitability by Market Segments
16.1.5.4. Sales Footprint
16.1.5.5. Strategy Overview
16.1.5.5.1. Marketing Strategy
16.1.5.5.2. Product Strategy
16.1.5.5.3. Channel Strategy
16.1.6. Purolite Life Sciences
16.1.6.1. Overview
16.1.6.2. Product Portfolio
16.1.6.3. Profitability by Market Segments
16.1.6.4. Sales Footprint
16.1.6.5. Strategy Overview
16.1.6.5.1. Marketing Strategy
16.1.6.5.2. Product Strategy
16.1.6.5.3. Channel Strategy
16.1.7. BioVision Incorporated
16.1.7.1. Overview
16.1.7.2. Product Portfolio
16.1.7.3. Profitability by Market Segments
16.1.7.4. Sales Footprint
16.1.7.5. Strategy Overview
16.1.7.5.1. Marketing Strategy
16.1.7.5.2. Product Strategy
16.1.7.5.3. Channel Strategy
16.1.8. Westburg BV
16.1.8.1. Overview
16.1.8.2. Product Portfolio
16.1.8.3. Profitability by Market Segments
16.1.8.4. Sales Footprint
16.1.8.5. Strategy Overview
16.1.8.5.1. Marketing Strategy
16.1.8.5.2. Product Strategy
16.1.8.5.3. Channel Strategy
16.1.9. Roche Holding AG
16.1.9.1. Overview
16.1.9.2. Product Portfolio
16.1.9.3. Profitability by Market Segments
16.1.9.4. Sales Footprint
16.1.9.5. Strategy Overview
16.1.9.5.1. Marketing Strategy
16.1.9.5.2. Product Strategy
16.1.9.5.3. Channel Strategy
16.1.10. Sterogene Bioseparations
16.1.10.1. Overview
16.1.10.2. Product Portfolio
16.1.10.3. Profitability by Market Segments
16.1.10.4. Sales Footprint
16.1.10.5. Strategy Overview
16.1.10.5.1. Marketing Strategy
16.1.10.5.2. Product Strategy
16.1.10.5.3. Channel Strategy
16.1.11. Expedeon Ltd.
16.1.11.1. Overview
16.1.11.2. Product Portfolio
16.1.11.3. Profitability by Market Segments
16.1.11.4. Sales Footprint
16.1.11.5. Strategy Overview
16.1.11.5.1. Marketing Strategy
16.1.11.5.2. Product Strategy
16.1.11.5.3. Channel Strategy
16.1.12. Thermo-Fisher Scientific
16.1.12.1. Overview
16.1.12.2. Product Portfolio
16.1.12.3. Profitability by Market Segments
16.1.12.4. Sales Footprint
16.1.12.5. Strategy Overview
16.1.12.5.1. Marketing Strategy
16.1.12.5.2. Product Strategy
16.1.12.5.3. Channel Strategy
16.1.13. Mayflower Bioscience
16.1.13.1. Overview
16.1.13.2. Product Portfolio
16.1.13.3. Profitability by Market Segments
16.1.13.4. Sales Footprint
16.1.13.5. Strategy Overview
16.1.13.5.1. Marketing Strategy
16.1.13.5.2. Product Strategy
16.1.13.5.3. Channel Strategy
16.1.14. Merck KGaA
16.1.14.1. Overview
16.1.14.2. Product Portfolio
16.1.14.3. Profitability by Market Segments
16.1.14.4. Sales Footprint
16.1.14.5. Strategy Overview
16.1.14.5.1. Marketing Strategy
16.1.14.5.2. Product Strategy
16.1.14.5.3. Channel Strategy
16.1.15. Molecular Cloning Laboratories
16.1.15.1. Overview
16.1.15.2. Product Portfolio
16.1.15.3. Profitability by Market Segments
16.1.15.4. Sales Footprint
16.1.15.5. Strategy Overview
16.1.15.5.1. Marketing Strategy
16.1.15.5.2. Product Strategy
16.1.15.5.3. Channel Strategy
17. Assumptions & Acronyms Used
18. Research Methodology
Let us know your requirement to get
100% FREE customization
Table 1: Global Protein Purification Resin Market Value (US$ Mn) Forecast by Region, 2017-2032
Table 2: Global Protein Purification Resin Market Volume (Tons) Forecast by Region, 2017-2032
Table 3: Global Protein Purification Resin Market Value (US$ Mn) Forecast by Type, 2017-2032
Table 4: Global Protein Purification Resin Market Volume (Tons) Forecast by Type, 2017-2032
Table 5: Global Protein Purification Resin Market Value (US$ Mn) Forecast by End Use, 2017-2032
Table 6: Global Protein Purification Resin Market Volume (Tons) Forecast by End Use, 2017-2032
Table 7: Global Protein Purification Resin Market Value (US$ Mn) Forecast by Distribution Channel, 2017-2032
Table 8: Global Protein Purification Resin Market Volume (Tons) Forecast by Distribution Channel, 2017-2032
Table 9: North America Protein Purification Resin Market Value (US$ Mn) Forecast by Country, 2017-2032
Table 10: North America Protein Purification Resin Market Volume (Tons) Forecast by Country, 2017-2032
Table 11: North America Protein Purification Resin Market Value (US$ Mn) Forecast by Type, 2017-2032
Table 12: North America Protein Purification Resin Market Volume (Tons) Forecast by Type, 2017-2032
Table 13: North America Protein Purification Resin Market Value (US$ Mn) Forecast by End Use, 2017-2032
Table 14: North America Protein Purification Resin Market Volume (Tons) Forecast by End Use, 2017-2032
Table 15: North America Protein Purification Resin Market Value (US$ Mn) Forecast by Distribution Channel, 2017-2032
Table 16: North America Protein Purification Resin Market Volume (Tons) Forecast by Distribution Channel, 2017-2032
Table 17: Latin America Protein Purification Resin Market Value (US$ Mn) Forecast by Country, 2017-2032
Table 18: Latin America Protein Purification Resin Market Volume (Tons) Forecast by Country, 2017-2032
Table 19: Latin America Protein Purification Resin Market Value (US$ Mn) Forecast by Type, 2017-2032
Table 20: Latin America Protein Purification Resin Market Volume (Tons) Forecast by Type, 2017-2032
Table 21: Latin America Protein Purification Resin Market Value (US$ Mn) Forecast by End Use, 2017-2032
Table 22: Latin America Protein Purification Resin Market Volume (Tons) Forecast by End Use, 2017-2032
Table 23: Latin America Protein Purification Resin Market Value (US$ Mn) Forecast by Distribution Channel, 2017-2032
Table 24: Latin America Protein Purification Resin Market Volume (Tons) Forecast by Distribution Channel, 2017-2032
Table 25: Europe Protein Purification Resin Market Value (US$ Mn) Forecast by Country, 2017-2032
Table 26: Europe Protein Purification Resin Market Volume (Tons) Forecast by Country, 2017-2032
Table 27: Europe Protein Purification Resin Market Value (US$ Mn) Forecast by Type, 2017-2032
Table 28: Europe Protein Purification Resin Market Volume (Tons) Forecast by Type, 2017-2032
Table 29: Europe Protein Purification Resin Market Value (US$ Mn) Forecast by End Use, 2017-2032
Table 30: Europe Protein Purification Resin Market Volume (Tons) Forecast by End Use, 2017-2032
Table 31: Europe Protein Purification Resin Market Value (US$ Mn) Forecast by Distribution Channel, 2017-2032
Table 32: Europe Protein Purification Resin Market Volume (Tons) Forecast by Distribution Channel, 2017-2032
Table 33: Asia Pacific Protein Purification Resin Market Value (US$ Mn) Forecast by Country, 2017-2032
Table 34: Asia Pacific Protein Purification Resin Market Volume (Tons) Forecast by Country, 2017-2032
Table 35: Asia Pacific Protein Purification Resin Market Value (US$ Mn) Forecast by Type, 2017-2032
Table 36: Asia Pacific Protein Purification Resin Market Volume (Tons) Forecast by Type, 2017-2032
Table 37: Asia Pacific Protein Purification Resin Market Value (US$ Mn) Forecast by End Use, 2017-2032
Table 38: Asia Pacific Protein Purification Resin Market Volume (Tons) Forecast by End Use, 2017-2032
Table 39: Asia Pacific Protein Purification Resin Market Value (US$ Mn) Forecast by Distribution Channel, 2017-2032
Table 40: Asia Pacific Protein Purification Resin Market Volume (Tons) Forecast by Distribution Channel, 2017-2032
Table 41: MEA Protein Purification Resin Market Value (US$ Mn) Forecast by Country, 2017-2032
Table 42: MEA Protein Purification Resin Market Volume (Tons) Forecast by Country, 2017-2032
Table 43: MEA Protein Purification Resin Market Value (US$ Mn) Forecast by Type, 2017-2032
Table 44: MEA Protein Purification Resin Market Volume (Tons) Forecast by Type, 2017-2032
Table 45: MEA Protein Purification Resin Market Value (US$ Mn) Forecast by End Use, 2017-2032
Table 46: MEA Protein Purification Resin Market Volume (Tons) Forecast by End Use, 2017-2032
Table 47: MEA Protein Purification Resin Market Value (US$ Mn) Forecast by Distribution Channel, 2017-2032
Table 48: MEA Protein Purification Resin Market Volume (Tons) Forecast by Distribution Channel, 2017-2032
Find your sweet spots for generating winning opportunities in this market.
Talk to AnalystFigure 1: Global Protein Purification Resin Market Value (US$ Mn) by Type, 2022-2032
Figure 2: Global Protein Purification Resin Market Value (US$ Mn) by End Use, 2022-2032
Figure 3: Global Protein Purification Resin Market Value (US$ Mn) by Distribution Channel, 2022-2032
Figure 4: Global Protein Purification Resin Market Value (US$ Mn) by Region, 2022-2032
Figure 5: Global Protein Purification Resin Market Value (US$ Mn) Analysis by Region, 2017-2032
Figure 6: Global Protein Purification Resin Market Volume (Tons) Analysis by Region, 2017-2032
Figure 7: Global Protein Purification Resin Market Value Share (%) and BPS Analysis by Region, 2022-2032
Figure 8: Global Protein Purification Resin Market Y-o-Y Growth (%) Projections by Region, 2022-2032
Figure 9: Global Protein Purification Resin Market Value (US$ Mn) Analysis by Type, 2017-2032
Figure 10: Global Protein Purification Resin Market Volume (Tons) Analysis by Type, 2017-2032
Figure 11: Global Protein Purification Resin Market Value Share (%) and BPS Analysis by Type, 2022-2032
Figure 12: Global Protein Purification Resin Market Y-o-Y Growth (%) Projections by Type, 2022-2032
Figure 13: Global Protein Purification Resin Market Value (US$ Mn) Analysis by End Use, 2017-2032
Figure 14: Global Protein Purification Resin Market Volume (Tons) Analysis by End Use, 2017-2032
Figure 15: Global Protein Purification Resin Market Value Share (%) and BPS Analysis by End Use, 2022-2032
Figure 16: Global Protein Purification Resin Market Y-o-Y Growth (%) Projections by End Use, 2022-2032
Figure 17: Global Protein Purification Resin Market Value (US$ Mn) Analysis by Distribution Channel, 2017-2032
Figure 18: Global Protein Purification Resin Market Volume (Tons) Analysis by Distribution Channel, 2017-2032
Figure 19: Global Protein Purification Resin Market Value Share (%) and BPS Analysis by Distribution Channel, 2022-2032
Figure 20: Global Protein Purification Resin Market Y-o-Y Growth (%) Projections by Distribution Channel, 2022-2032
Figure 21: Global Protein Purification Resin Market Attractiveness by Type, 2022-2032
Figure 22: Global Protein Purification Resin Market Attractiveness by End Use, 2022-2032
Figure 23: Global Protein Purification Resin Market Attractiveness by Distribution Channel, 2022-2032
Figure 24: Global Protein Purification Resin Market Attractiveness by Region, 2022-2032
Figure 25: North America Protein Purification Resin Market Value (US$ Mn) by Type, 2022-2032
Figure 26: North America Protein Purification Resin Market Value (US$ Mn) by End Use, 2022-2032
Figure 27: North America Protein Purification Resin Market Value (US$ Mn) by Distribution Channel, 2022-2032
Figure 28: North America Protein Purification Resin Market Value (US$ Mn) by Country, 2022-2032
Figure 29: North America Protein Purification Resin Market Value (US$ Mn) Analysis by Country, 2017-2032
Figure 30: North America Protein Purification Resin Market Volume (Tons) Analysis by Country, 2017-2032
Figure 31: North America Protein Purification Resin Market Value Share (%) and BPS Analysis by Country, 2022-2032
Figure 32: North America Protein Purification Resin Market Y-o-Y Growth (%) Projections by Country, 2022-2032
Figure 33: North America Protein Purification Resin Market Value (US$ Mn) Analysis by Type, 2017-2032
Figure 34: North America Protein Purification Resin Market Volume (Tons) Analysis by Type, 2017-2032
Figure 35: North America Protein Purification Resin Market Value Share (%) and BPS Analysis by Type, 2022-2032
Figure 36: North America Protein Purification Resin Market Y-o-Y Growth (%) Projections by Type, 2022-2032
Figure 37: North America Protein Purification Resin Market Value (US$ Mn) Analysis by End Use, 2017-2032
Figure 38: North America Protein Purification Resin Market Volume (Tons) Analysis by End Use, 2017-2032
Figure 39: North America Protein Purification Resin Market Value Share (%) and BPS Analysis by End Use, 2022-2032
Figure 40: North America Protein Purification Resin Market Y-o-Y Growth (%) Projections by End Use, 2022-2032
Figure 41: North America Protein Purification Resin Market Value (US$ Mn) Analysis by Distribution Channel, 2017-2032
Figure 42: North America Protein Purification Resin Market Volume (Tons) Analysis by Distribution Channel, 2017-2032
Figure 43: North America Protein Purification Resin Market Value Share (%) and BPS Analysis by Distribution Channel, 2022-2032
Figure 44: North America Protein Purification Resin Market Y-o-Y Growth (%) Projections by Distribution Channel, 2022-2032
Figure 45: North America Protein Purification Resin Market Attractiveness by Type, 2022-2032
Figure 46: North America Protein Purification Resin Market Attractiveness by End Use, 2022-2032
Figure 47: North America Protein Purification Resin Market Attractiveness by Distribution Channel, 2022-2032
Figure 48: North America Protein Purification Resin Market Attractiveness by Country, 2022-2032
Figure 49: Latin America Protein Purification Resin Market Value (US$ Mn) by Type, 2022-2032
Figure 50: Latin America Protein Purification Resin Market Value (US$ Mn) by End Use, 2022-2032
Figure 51: Latin America Protein Purification Resin Market Value (US$ Mn) by Distribution Channel, 2022-2032
Figure 52: Latin America Protein Purification Resin Market Value (US$ Mn) by Country, 2022-2032
Figure 53: Latin America Protein Purification Resin Market Value (US$ Mn) Analysis by Country, 2017-2032
Figure 54: Latin America Protein Purification Resin Market Volume (Tons) Analysis by Country, 2017-2032
Figure 55: Latin America Protein Purification Resin Market Value Share (%) and BPS Analysis by Country, 2022-2032
Figure 56: Latin America Protein Purification Resin Market Y-o-Y Growth (%) Projections by Country, 2022-2032
Figure 57: Latin America Protein Purification Resin Market Value (US$ Mn) Analysis by Type, 2017-2032
Figure 58: Latin America Protein Purification Resin Market Volume (Tons) Analysis by Type, 2017-2032
Figure 59: Latin America Protein Purification Resin Market Value Share (%) and BPS Analysis by Type, 2022-2032
Figure 60: Latin America Protein Purification Resin Market Y-o-Y Growth (%) Projections by Type, 2022-2032
Figure 61: Latin America Protein Purification Resin Market Value (US$ Mn) Analysis by End Use, 2017-2032
Figure 62: Latin America Protein Purification Resin Market Volume (Tons) Analysis by End Use, 2017-2032
Figure 63: Latin America Protein Purification Resin Market Value Share (%) and BPS Analysis by End Use, 2022-2032
Figure 64: Latin America Protein Purification Resin Market Y-o-Y Growth (%) Projections by End Use, 2022-2032
Figure 65: Latin America Protein Purification Resin Market Value (US$ Mn) Analysis by Distribution Channel, 2017-2032
Figure 66: Latin America Protein Purification Resin Market Volume (Tons) Analysis by Distribution Channel, 2017-2032
Figure 67: Latin America Protein Purification Resin Market Value Share (%) and BPS Analysis by Distribution Channel, 2022-2032
Figure 68: Latin America Protein Purification Resin Market Y-o-Y Growth (%) Projections by Distribution Channel, 2022-2032
Figure 69: Latin America Protein Purification Resin Market Attractiveness by Type, 2022-2032
Figure 70: Latin America Protein Purification Resin Market Attractiveness by End Use, 2022-2032
Figure 71: Latin America Protein Purification Resin Market Attractiveness by Distribution Channel, 2022-2032
Figure 72: Latin America Protein Purification Resin Market Attractiveness by Country, 2022-2032
Figure 73: Europe Protein Purification Resin Market Value (US$ Mn) by Type, 2022-2032
Figure 74: Europe Protein Purification Resin Market Value (US$ Mn) by End Use, 2022-2032
Figure 75: Europe Protein Purification Resin Market Value (US$ Mn) by Distribution Channel, 2022-2032
Figure 76: Europe Protein Purification Resin Market Value (US$ Mn) by Country, 2022-2032
Figure 77: Europe Protein Purification Resin Market Value (US$ Mn) Analysis by Country, 2017-2032
Figure 78: Europe Protein Purification Resin Market Volume (Tons) Analysis by Country, 2017-2032
Figure 79: Europe Protein Purification Resin Market Value Share (%) and BPS Analysis by Country, 2022-2032
Figure 80: Europe Protein Purification Resin Market Y-o-Y Growth (%) Projections by Country, 2022-2032
Figure 81: Europe Protein Purification Resin Market Value (US$ Mn) Analysis by Type, 2017-2032
Figure 82: Europe Protein Purification Resin Market Volume (Tons) Analysis by Type, 2017-2032
Figure 83: Europe Protein Purification Resin Market Value Share (%) and BPS Analysis by Type, 2022-2032
Figure 84: Europe Protein Purification Resin Market Y-o-Y Growth (%) Projections by Type, 2022-2032
Figure 85: Europe Protein Purification Resin Market Value (US$ Mn) Analysis by End Use, 2017-2032
Figure 86: Europe Protein Purification Resin Market Volume (Tons) Analysis by End Use, 2017-2032
Figure 87: Europe Protein Purification Resin Market Value Share (%) and BPS Analysis by End Use, 2022-2032
Figure 88: Europe Protein Purification Resin Market Y-o-Y Growth (%) Projections by End Use, 2022-2032
Figure 89: Europe Protein Purification Resin Market Value (US$ Mn) Analysis by Distribution Channel, 2017-2032
Figure 90: Europe Protein Purification Resin Market Volume (Tons) Analysis by Distribution Channel, 2017-2032
Figure 91: Europe Protein Purification Resin Market Value Share (%) and BPS Analysis by Distribution Channel, 2022-2032
Figure 92: Europe Protein Purification Resin Market Y-o-Y Growth (%) Projections by Distribution Channel, 2022-2032
Figure 93: Europe Protein Purification Resin Market Attractiveness by Type, 2022-2032
Figure 94: Europe Protein Purification Resin Market Attractiveness by End Use, 2022-2032
Figure 95: Europe Protein Purification Resin Market Attractiveness by Distribution Channel, 2022-2032
Figure 96: Europe Protein Purification Resin Market Attractiveness by Country, 2022-2032
Figure 97: Asia Pacific Protein Purification Resin Market Value (US$ Mn) by Type, 2022-2032
Figure 98: Asia Pacific Protein Purification Resin Market Value (US$ Mn) by End Use, 2022-2032
Figure 99: Asia Pacific Protein Purification Resin Market Value (US$ Mn) by Distribution Channel, 2022-2032
Figure 100: Asia Pacific Protein Purification Resin Market Value (US$ Mn) by Country, 2022-2032
Figure 101: Asia Pacific Protein Purification Resin Market Value (US$ Mn) Analysis by Country, 2017-2032
Figure 102: Asia Pacific Protein Purification Resin Market Volume (Tons) Analysis by Country, 2017-2032
Figure 103: Asia Pacific Protein Purification Resin Market Value Share (%) and BPS Analysis by Country, 2022-2032
Figure 104: Asia Pacific Protein Purification Resin Market Y-o-Y Growth (%) Projections by Country, 2022-2032
Figure 105: Asia Pacific Protein Purification Resin Market Value (US$ Mn) Analysis by Type, 2017-2032
Figure 106: Asia Pacific Protein Purification Resin Market Volume (Tons) Analysis by Type, 2017-2032
Figure 107: Asia Pacific Protein Purification Resin Market Value Share (%) and BPS Analysis by Type, 2022-2032
Figure 108: Asia Pacific Protein Purification Resin Market Y-o-Y Growth (%) Projections by Type, 2022-2032
Figure 109: Asia Pacific Protein Purification Resin Market Value (US$ Mn) Analysis by End Use, 2017-2032
Figure 110: Asia Pacific Protein Purification Resin Market Volume (Tons) Analysis by End Use, 2017-2032
Figure 111: Asia Pacific Protein Purification Resin Market Value Share (%) and BPS Analysis by End Use, 2022-2032
Figure 112: Asia Pacific Protein Purification Resin Market Y-o-Y Growth (%) Projections by End Use, 2022-2032
Figure 113: Asia Pacific Protein Purification Resin Market Value (US$ Mn) Analysis by Distribution Channel, 2017-2032
Figure 114: Asia Pacific Protein Purification Resin Market Volume (Tons) Analysis by Distribution Channel, 2017-2032
Figure 115: Asia Pacific Protein Purification Resin Market Value Share (%) and BPS Analysis by Distribution Channel, 2022-2032
Figure 116: Asia Pacific Protein Purification Resin Market Y-o-Y Growth (%) Projections by Distribution Channel, 2022-2032
Figure 117: Asia Pacific Protein Purification Resin Market Attractiveness by Type, 2022-2032
Figure 118: Asia Pacific Protein Purification Resin Market Attractiveness by End Use, 2022-2032
Figure 119: Asia Pacific Protein Purification Resin Market Attractiveness by Distribution Channel, 2022-2032
Figure 120: Asia Pacific Protein Purification Resin Market Attractiveness by Country, 2022-2032
Figure 121: MEA Protein Purification Resin Market Value (US$ Mn) by Type, 2022-2032
Figure 122: MEA Protein Purification Resin Market Value (US$ Mn) by End Use, 2022-2032
Figure 123: MEA Protein Purification Resin Market Value (US$ Mn) by Distribution Channel, 2022-2032
Figure 124: MEA Protein Purification Resin Market Value (US$ Mn) by Country, 2022-2032
Figure 125: MEA Protein Purification Resin Market Value (US$ Mn) Analysis by Country, 2017-2032
Figure 126: MEA Protein Purification Resin Market Volume (Tons) Analysis by Country, 2017-2032
Figure 127: MEA Protein Purification Resin Market Value Share (%) and BPS Analysis by Country, 2022-2032
Figure 128: MEA Protein Purification Resin Market Y-o-Y Growth (%) Projections by Country, 2022-2032
Figure 129: MEA Protein Purification Resin Market Value (US$ Mn) Analysis by Type, 2017-2032
Figure 130: MEA Protein Purification Resin Market Volume (Tons) Analysis by Type, 2017-2032
Figure 131: MEA Protein Purification Resin Market Value Share (%) and BPS Analysis by Type, 2022-2032
Figure 132: MEA Protein Purification Resin Market Y-o-Y Growth (%) Projections by Type, 2022-2032
Figure 133: MEA Protein Purification Resin Market Value (US$ Mn) Analysis by End Use, 2017-2032
Figure 134: MEA Protein Purification Resin Market Volume (Tons) Analysis by End Use, 2017-2032
Figure 135: MEA Protein Purification Resin Market Value Share (%) and BPS Analysis by End Use, 2022-2032
Figure 136: MEA Protein Purification Resin Market Y-o-Y Growth (%) Projections by End Use, 2022-2032
Figure 137: MEA Protein Purification Resin Market Value (US$ Mn) Analysis by Distribution Channel, 2017-2032
Figure 138: MEA Protein Purification Resin Market Volume (Tons) Analysis by Distribution Channel, 2017-2032
Figure 139: MEA Protein Purification Resin Market Value Share (%) and BPS Analysis by Distribution Channel, 2022-2032
Figure 140: MEA Protein Purification Resin Market Y-o-Y Growth (%) Projections by Distribution Channel, 2022-2032
Figure 141: MEA Protein Purification Resin Market Attractiveness by Type, 2022-2032
Figure 142: MEA Protein Purification Resin Market Attractiveness by End Use, 2022-2032
Figure 143: MEA Protein Purification Resin Market Attractiveness by Distribution Channel, 2022-2032
Figure 144: MEA Protein Purification Resin Market Attractiveness by Country, 2022-2032
Need specific information?
Request CustomizationExplore Packaging Insights
View Reports