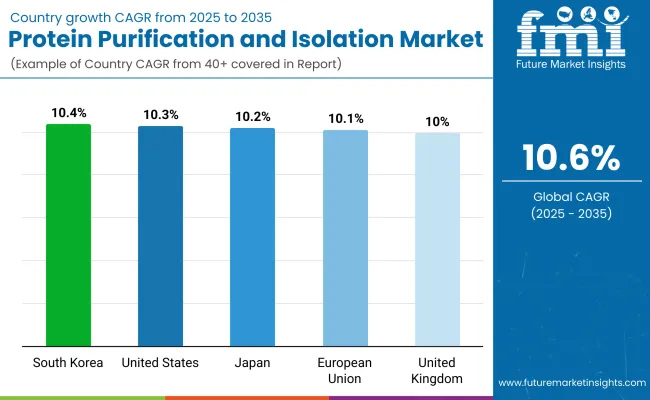
Protein Purification And Isolation Market
A look into the Trends Contributing to the Global Demand for Protein Purification and Isolation
Protein Purification and Isolation Market by Product, Application, End Use & Region - Forecast 2022 - 2032
Protein Purification and Isolation Market Outlook 2022-2032
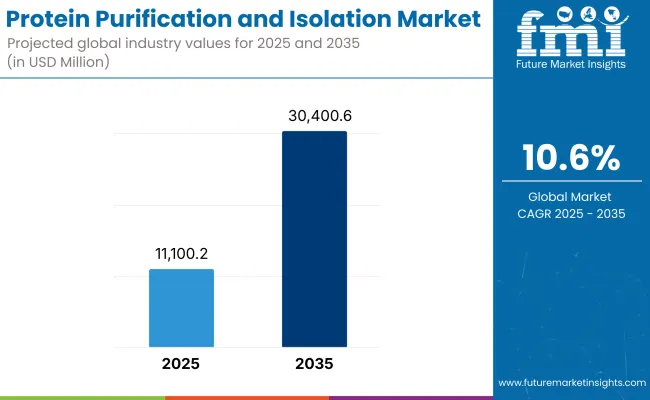
[342 Pages Report] The global protein purification and isolation market is expected to reach a market valuation of US$ 8.29 Billion by the year 2022, accelerating with a moderate CAGR of 10.6% by 2022-2032. Protein purification and isolation market size is anticipated to be valued at about US$ 17.41 Billion by 2032 end.
Increased governmental and private funding for protein research, growing interest in structure-based medication design, and innovations in technology, such as single-use technologies and automated purification instruments, all contribute to the growth of the global protein purification & isolation market.
Governments are increasing their support for the pharmaceutical and biotechnology industries by investing in R&D and launching initiatives to promote the protein purification and isolation sectors' growth and development. Plus, they've thrown in some extras like tax breaks, free money, and laws that are easy on investors.
The pharmaceutical sector in the protein purification and isolation market has made significant expenditures in the creation of biomarker-specific compounds, making it a profitable demand for protein purification and isolation solutions. Preclinical drug research relies heavily on the accurate separation of proteins using a high concentration of pure substrate. As a result of these elements, the demand for protein purification and isolation is expected to grow.
Attributes |
Value |
Protein Purification and Isolation Market Size (2022) |
10.6% |
Protein Purification and Isolation Market Projected Size (2032) |
US$ 17.41 Billion |
Protein Purification and Isolation Market Value CAGR (2022-2032) |
US$ 8.29 Billion |
The growth of the protein purification and isolation market is hindered, however, by factors such as poor acceptance rates for instruments, the difficulty of maintaining purifying kits that fulfil all demands, and the high cost of tools.
Let us know your requirement to get
100% FREE customization
What are the Drivers and Restraints Impacting the Global Protein Purification and Isolation Demand?
Drivers
R&D spending on drug discovery and development has increased.
The protein purification and isolation market has benefited from the increasing focus on medication research and development. Protein analysis is a crucial step in the discovery of new drug and biotech product candidates. Thus, the acceptance of novel medication therapy has provided a major boost to the motivation to discover new and sophisticated pharmaceuticals. As a result, the demand for protein purification and isolation is expected to benefit from the subsequent rise in R&D and associated spending.
Developments in technology
Ongoing technological advancements propel the protein purification and isolation solutions even further. Magnetic and protein beads, as well as ligand tagging systems, are replacing traditional methods such as agarose beads and other resins. Additionally, the increasing use of automated analyzers is expected to drive demand for protein purification and isolation.
Restraints
High tool prices, a lack of universally applicable purification kits, and a decrease in the adoption rate of new instruments are impediments to the protein purification and isolation market's development. Untapped growth areas and protein therapeutics are also helping in the development of protein purification and isolation market trends.
What are the Key Trends in the Protein Purification and Isolation Market?
Expanding economies
Protein purification and isolation market growth opportunities are anticipated in the Asia-Pacific region due to factors such as the region's increasing focus on protein analysis-based technologies for drug discovery, its expanding R&D initiatives to develop novel proteomic and genomic techniques, its diverse healthcare markets, and its improving research infrastructure.
For instance, Purolite and PharmNXT Biotech formed a strategic alliance in May 2021 so that Purolite could provide PharmNXT Biotech's Praesto mAb chromatographic resin platform to the markets of South Korea and Singapore.
Lack of Qualified Individuals
Sample preparation plays a crucial role in protein purification and isolation by separating the analyte of interest and removing any interferences. Users incur additional direct and indirect costs due to a lack of expertise in making the best technology selection and preparing samples.
Find your sweet spots for generating winning opportunities in this market.
Talk to AnalystComparative View of Adjacent Protein Purification and Isolation Market
Protein Purification and Isolation Market:
Attributes |
Protein Purification and Isolation Market |
CAGR (2022 to 2032) |
10.6% |
Market Value (2022) |
US$ 8.29 Billion |
Growth Factor |
The protein purification and isolation market is expected to benefit from the subsequent rise in R&D and associated spending. |
Future Opportunities |
There is a great deal of room for expansion in the business sector in emerging markets. |
Market Trends |
Increasing drug discovery and development efforts, widespread acceptance of customized treatment, and technological progress all contribute to this trend. |
Proteomics Market:
Attributes |
Proteomics Market |
CAGR (2022 to 2032) |
16.6% |
Market Value (2022) |
US$ 25.9 Billion |
Growth Factor |
Increase in the incidence of cancer and other genetic illnesses. |
Future Opportunities |
Because of the increasing interest in protein analysis-based technologies for drug discovery, the Asia-Pacific market is expected to provide growth prospects for participants. |
Market Trends |
Some of the major market challenges include data management and storage issues, high instrument costs, and the gap between biomarker discovery and subsequent approval. |
Protein Crystallization & Crystallography Market:
Attributes |
Protein Crystallization & Crystallography Market |
CAGR (2022 to 2032) |
8.9% |
Market Value (2022) |
US$ 1.1 Billion |
Growth Factor |
The development of protein therapies and the improvement of protein crystallisation equipment and supplies are driving this market upward. |
Future Opportunities |
The market should benefit from the increased emphasis on miniaturization. |
Market Trends |
It is anticipated that the high price of instruments is likely to limit the expansion of this market over the projection period. |
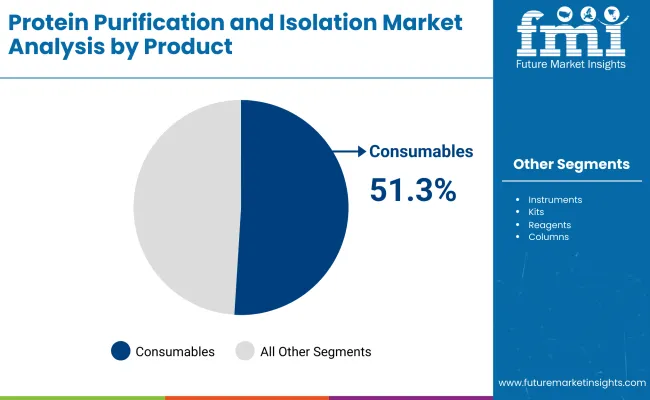
In 2021, consumables protein purification and isolation market segment had the highest revenue share of more than 60.0 percent. The most used consumables are columns, reagents, kits, resins, and magnetic beads. Kits dominated the consumables product segment in 2021 because they are convenient and provide numerous benefits. They can, for example, be used to effectively isolate GST-tagged protein from crude or cleared lysate.
The high usage and increased commercialization of advanced resins can be attributed to the growth of the reagent's protein purification and isolation market segment. Reagents also aid in the removal of ambiguity and the production of precise results. Because of the development of accurate, sensitive, and portable instruments, the instruments segment is expected to grow steadily over the forecast period.
Category-wise Insights for Global Protein Purification and Isolation Market
Which is the End Use Segment in the Market?
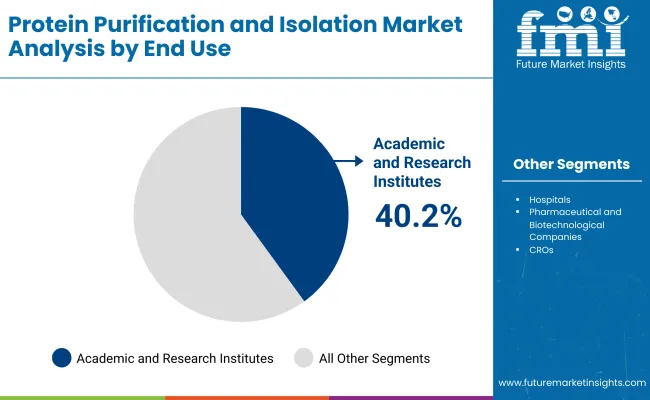
More than 35% of total 2021 sales of protein purification and isolation came from universities and other academic and research establishments. Demand for protein purification and isolation solutions is rising as a result of increased research into structural and functional proteomics, in-depth kinetic analysis, and protein-protein interaction at academic institutions. Protein purification and isolation services are used by a wide variety of industries, including pharmaceutical and biotech firms, contract research organizations (CROs), and universities and hospitals.
Which is the Key Application Segment in the Market?
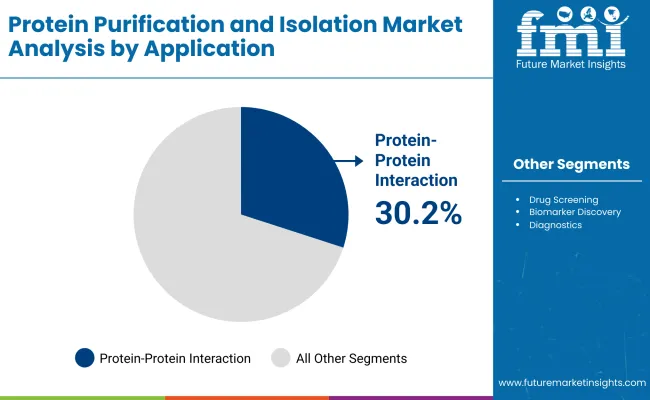
Over 30% of all sales of protein purification and isolation in 2021 came from research on protein-protein interactions, and that number is expected to expand significantly over the next few years. The increasing number of research based on structural proteins, as well as the widespread use of the procedures used to derive these proteins, are driving the expansion of protein purification and isolation market.

A unified Market Research Subscription Platform, built for today's disparate research needs.
Regional Analysis
What is the leading region in the Protein Purification and Isolation Market?
When it came to percentage of total sales of protein purification and isolation, North America took 47 percent in 2021. Sales of protein purification and isolation equipment are bolstered by the area's robust funding for life science research, well-established research infrastructure, and presence of other key elements.
The rise in biopharmaceutical medication development during the forecast period is also expected to boost the regional protein purification and isolation market.
Demand for technologically advanced protein isolation methods in North America is being driven by improvements in application areas such as protein-protein interaction investigations, target detection, drug screening, protein treatments, biomarker identification, sickness tracking, and diagnostic testing.
What is the Performance of Protein Purification and Isolation Market in Asia Pacific Region?
It is anticipated that the Asia Pacific protein purification and isolation market region would experience the most rapid expansion throughout the course of the projection period. The demand for protein purification and isolation solutions is expected to be driven in this area by initiatives done by the governments of developing nations such as India and China for the development of healthcare infrastructure. In addition, these governments are contributing money to the research and development of innovative strategies for purification and isolation.
Competitive Landscape for the Protein Purification and Isolation Market
Protein purification and isolation market participants are attempting to increase their foothold by implementing tactics like new product launches, geographic expansion, mergers, acquisitions, and partnerships. For instance, in September 2021, GE Healthcare Life Sciences agreed to purchase BK Medical from Altaris Capital Partners, LLC for USD 1.45 billion in cash. The deal was announced in December 2021.
Additionally, in March of 2022, Thermo Fisher Scientific and Symphogen announced that they would continue working together to supply biopharmaceutical R&D laboratories with platform workflows for quality monitoring and simplified characterization of complex therapeutic proteins. Thermo Fisher Scientific's dominance in the protein purification and separation market is expected to be preserved thanks to this.
Startup Ecosystem in the Global Protein Purification and Isolation Market
The leading companies in the protein purification and isolation market are investing heavily in R&D to create innovative products that would likely boost the industry.
There are more than 25 companies catering to the developed and extremely diverse protein purification and separation sector. As a result of recent developments in R&D, the demand for protein purification and isolation is anticipated to expand throughout the forecast period.
New entrants in the protein purification and isolation market are using a wide variety of tactics to enhance their market share, such as developing new products, expanding into new regions, merging with existing businesses, and forming partnerships.
Global Protein Purification and Isolation Market Key Players
- Merck KGaA
- Thermo Fischer Scientific, Inc.
- GE Healthcare Life Sciences
- Qiagen N.V.
- Sigma-Aldrich Corporation
- Agilent Technologies
- Bio-Rad Laboratories, Inc.
- Promega Corporation
Protein Purification and Isolation Market by Segmentation
By Product:
- Instruments
- Consumables
- Kits
- Reagents
- Columns
- Magnetic Beads
- Resins
- Others
By Technology:
- Ultrafiltration
- Precipitation
- Chromatography
- Ion Exchange Chromatography
- Affinity Chromatography
- Reversed-Phase Chromatography
- Size Exclusion Chromatography
- Hydrophobic Interaction Chromatography
- Electrophoresis
- Gel Electrophoresis
- Isoelectric Focusing
- Capillary Electrophoresis
- Western Blotting
- Others
By Application:
- Drug Screening
- Biomarker Discovery
- Protein-protein Interaction Studies
- Diagnostics
By End Use:
- Academic and Research Institutes
- Hospitals
- Pharmaceutical and Biotechnological Companies
- CROs
By Region:
- North America
- Latin America
- Europe
- East Asia
- South Asia
- Oceania
- Middle East and Africa
Frequently Asked Questions
At What Rate the Protein Purification and Isolation Market is Expected to Grow?
The protein purification and isolation market is expected to grow at 10.6% CAGR over 2022-2032.
What is the Net Worth of the Global Protein Purification and Isolation Market?
The protein purification and isolation market is estimated to be around US$ 8.29 Billion in 2022.
What is the Projected Value of the Protein Purification and Isolation Market?
The protein purification and isolation market is anticipated to reach a valuation of US$ 17.41 Billion by 2032.
Which is the Best Performing Application Type of the Protein Purification and Isolation Market?
The demand for protein purification and isolation is expected to grow rapidly in the coming years, with research into protein-protein interactions accounting for the largest revenue share at more than 29 percent in 2021.
Which is the Rapidly Growing Region for the Protein Purification and Isolation Market?
North America is the fastest growing region for the protein purification and isolation market.
Table of Content
1. Executive Summary 1.1. Global Market Outlook 1.2. Demand-side Trends 1.3. Supply-side Trends 1.4. Technology Roadmap Analysis 1.5. Analysis and Recommendations 2. Market Overview 2.1. Market Coverage / Taxonomy 2.2. Market Definition / Scope / Limitations 3. Market Background 3.1. Market Dynamics 3.1.1. Drivers 3.1.2. Restraints 3.1.3. Opportunity 3.1.4. Trends 3.2. Scenario Forecast 3.2.1. Demand in Optimistic Scenario 3.2.2. Demand in Likely Scenario 3.2.3. Demand in Conservative Scenario 3.3. Opportunity Map Analysis 3.4. Investment Feasibility Matrix 3.5. PESTLE and Porter’s Analysis 3.6. Regulatory Landscape 3.6.1. By Key Regions 3.6.2. By Key Countries 3.7. Regional Parent Market Outlook 4. Global Market Analysis 2017-2021 and Forecast, 2022-2032 4.1. Historical Market Size Value (US$ Mn) Analysis, 2017-2021 4.2. Current and Future Market Size Value (US$ Mn) Projections, 2022-2032 4.2.1. Y-o-Y Growth Trend Analysis 4.2.2. Absolute $ Opportunity Analysis 5. Global Market Analysis 2017-2021 and Forecast 2022-2032, By Product 5.1. Introduction / Key Findings 5.2. Historical Market Size Value (US$ Mn) Analysis By Product, 2017-2021 5.3. Current and Future Market Size Value (US$ Mn) Analysis and Forecast By Product, 2022-2032 5.3.1. Instruments 5.3.2. Consumables 5.3.2.1. Kits 5.3.2.2. Reagents 5.3.2.3. Columns 5.3.2.4. Magnetic Beads 5.3.2.5. Resins 5.3.2.6. Others 5.4. Y-o-Y Growth Trend Analysis By Product, 2017-2021 5.5. Absolute $ Opportunity Analysis By Product, 2022-2032 6. Global Market Analysis 2017-2021 and Forecast 2022-2032, By Technology 6.1. Introduction / Key Findings 6.2. Historical Market Size Value (US$ Mn) Analysis By Technology, 2017-2021 6.3. Current and Future Market Size Value (US$ Mn) Analysis and Forecast By Technology, 2022-2032 6.3.1. Ultrafiltration 6.3.2. Precipitation 6.3.3. Chromatography 6.3.3.1. Ion Exchange Chromatography 6.3.3.2. Affinity Chromatography 6.3.3.3. Reversed Phase Chromatography 6.3.3.4. Size Exclusion Chromatography 6.3.3.5. Hydrophobic Interaction Chromatography 6.3.4. Electrophoresis 6.3.4.1. Gel Electrophoresis 6.3.4.2. Isoelectric Focusing 6.3.4.3. Capillary Electrophoresis 6.3.5. Western Blotting 6.3.6. Others 6.4. Y-o-Y Growth Trend Analysis By Technology, 2017-2021 6.5. Absolute $ Opportunity Analysis By Technology, 2022-2032 7. Global Market Analysis 2017-2021 and Forecast 2022-2032, By Application 7.1. Introduction / Key Findings 7.2. Historical Market Size Value (US$ Mn) Analysis By Application, 2017-2021 7.3. Current and Future Market Size Value (US$ Mn) Analysis and Forecast By Application, 2022-2032 7.3.1. Drug Screening 7.3.2. Biomarker Discovery 7.3.3. Protein-protein Interaction Studies 7.3.4. Diagnostics 7.4. Y-o-Y Growth Trend Analysis By Application, 2017-2021 7.5. Absolute $ Opportunity Analysis By Application, 2022-2032 8. Global Market Analysis 2017-2021 and Forecast 2022-2032, By End Use 8.1. Introduction / Key Findings 8.2. Historical Market Size Value (US$ Mn) Analysis By End Use, 2017-2021 8.3. Current and Future Market Size Value (US$ Mn) Analysis and Forecast By End Use, 2022-2032 8.3.1. Academic and Research Institutes 8.3.2. Hospitals 8.3.3. Pharmaceutical and Biotechnological Companies 8.3.4. CROs 8.4. Y-o-Y Growth Trend Analysis By End Use, 2017-2021 8.5. Absolute $ Opportunity Analysis By End Use, 2022-2032 9. Global Market Analysis 2017-2021 and Forecast 2022-2032, By Region 9.1. Introduction 9.2. Historical Market Size Value (US$ Mn) Analysis By Region, 2017-2021 9.3. Current Market Size Value (US$ Mn) Analysis and Forecast By Region, 2022-2032 9.3.1. North America 9.3.2. Latin America 9.3.3. Europe 9.3.4. Asia Pacific 9.3.5. MEA 9.4. Market Attractiveness Analysis By Region 10. North America Market Analysis 2017-2021 and Forecast 2022-2032, By Country 10.1. Historical Market Size Value (US$ Mn) Trend Analysis By Market Taxonomy, 2017-2021 10.2. Market Size Value (US$ Mn) Forecast By Market Taxonomy, 2022-2032 10.2.1. By Country 10.2.1.1. US 10.2.1.2. Canada 10.2.2. By Product 10.2.3. By Technology 10.2.4. By Application 10.2.5. By End Use 10.3. Market Attractiveness Analysis 10.3.1. By Country 10.3.2. By Product 10.3.3. By Technology 10.3.4. By Application 10.3.5. By End Use 10.4. Key Takeaways 11. Latin America Market Analysis 2017-2021 and Forecast 2022-2032, By Country 11.1. Historical Market Size Value (US$ Mn) Trend Analysis By Market Taxonomy, 2017-2021 11.2. Market Size Value (US$ Mn) Forecast By Market Taxonomy, 2022-2032 11.2.1. By Country 11.2.1.1. Brazil 11.2.1.2. Mexico 11.2.1.3. Rest of Latin America 11.2.2. By Product 11.2.3. By Technology 11.2.4. By Application 11.2.5. By End Use 11.3. Market Attractiveness Analysis 11.3.1. By Country 11.3.2. By Product 11.3.3. By Technology 11.3.4. By Application 11.3.5. By End Use 11.4. Key Takeaways 12. Europe Market Analysis 2017-2021 and Forecast 2022-2032, By Country 12.1. Historical Market Size Value (US$ Mn) Trend Analysis By Market Taxonomy, 2017-2021 12.2. Market Size Value (US$ Mn) Forecast By Market Taxonomy, 2022-2032 12.2.1. By Country 12.2.1.1. Germany 12.2.1.2. U.K. 12.2.1.3. France 12.2.1.4. Spain 12.2.1.5. Italy 12.2.1.6. Rest of Europe 12.2.2. By Product 12.2.3. By Technology 12.2.4. By Application 12.2.5. By End Use 12.3. Market Attractiveness Analysis 12.3.1. By Country 12.3.2. By Product 12.3.3. By Technology 12.3.4. By Application 12.3.5. By End Use 12.4. Key Takeaways 13. Asia Pacific Market Analysis 2017-2021 and Forecast 2022-2032, By Country 13.1. Historical Market Size Value (US$ Mn) Trend Analysis By Market Taxonomy, 2017-2021 13.2. Market Size Value (US$ Mn) Forecast By Market Taxonomy, 2022-2032 13.2.1. By Country 13.2.1.1. China 13.2.1.2. Japan 13.2.1.3. South Korea 13.2.1.4. Rest of Asia Pacific 13.2.2. By Product 13.2.3. By Technology 13.2.4. By Application 13.2.5. By End Use 13.3. Market Attractiveness Analysis 13.3.1. By Country 13.3.2. By Product 13.3.3. By Technology 13.3.4. By Application 13.3.5. By End Use 13.4. Key Takeaways 14. MEA Market Analysis 2017-2021 and Forecast 2022-2032, By Country 14.1. Historical Market Size Value (US$ Mn) Trend Analysis By Market Taxonomy, 2017-2021 14.2. Market Size Value (US$ Mn) Forecast By Market Taxonomy, 2022-2032 14.2.1. By Country 14.2.1.1. GCC Countries 14.2.1.2. South Africa 14.2.1.3. Israel 14.2.1.4. Rest of MEA 14.2.2. By Product 14.2.3. By Technology 14.2.4. By Application 14.2.5. By End Use 14.3. Market Attractiveness Analysis 14.3.1. By Country 14.3.2. By Product 14.3.3. By Technology 14.3.4. By Application 14.3.5. By End Use 14.4. Key Takeaways 15. Key Countries Market Analysis 15.1. US 15.1.1. Pricing Analysis 15.1.2. Market Share Analysis, 2021 15.1.2.1. By Product 15.1.2.2. By Technology 15.1.2.3. By Application 15.1.2.4. By End Use 15.2. Canada 15.2.1. Pricing Analysis 15.2.2. Market Share Analysis, 2021 15.2.2.1. By Product 15.2.2.2. By Technology 15.2.2.3. By Application 15.2.2.4. By End Use 15.3. Brazil 15.3.1. Pricing Analysis 15.3.2. Market Share Analysis, 2021 15.3.2.1. By Product 15.3.2.2. By Technology 15.3.2.3. By Application 15.3.2.4. By End Use 15.4. Mexico 15.4.1. Pricing Analysis 15.4.2. Market Share Analysis, 2021 15.4.2.1. By Product 15.4.2.2. By Technology 15.4.2.3. By Application 15.4.2.4. By End Use 15.5. Germany 15.5.1. Pricing Analysis 15.5.2. Market Share Analysis, 2021 15.5.2.1. By Product 15.5.2.2. By Technology 15.5.2.3. By Application 15.5.2.4. By End Use 15.6. U.K. 15.6.1. Pricing Analysis 15.6.2. Market Share Analysis, 2021 15.6.2.1. By Product 15.6.2.2. By Technology 15.6.2.3. By Application 15.6.2.4. By End Use 15.7. France 15.7.1. Pricing Analysis 15.7.2. Market Share Analysis, 2021 15.7.2.1. By Product 15.7.2.2. By Technology 15.7.2.3. By Application 15.7.2.4. By End Use 15.8. Spain 15.8.1. Pricing Analysis 15.8.2. Market Share Analysis, 2021 15.8.2.1. By Product 15.8.2.2. By Technology 15.8.2.3. By Application 15.8.2.4. By End Use 15.9. Italy 15.9.1. Pricing Analysis 15.9.2. Market Share Analysis, 2021 15.9.2.1. By Product 15.9.2.2. By Technology 15.9.2.3. By Application 15.9.2.4. By End Use 15.10. China 15.10.1. Pricing Analysis 15.10.2. Market Share Analysis, 2021 15.10.2.1. By Product 15.10.2.2. By Technology 15.10.2.3. By Application 15.10.2.4. By End Use 15.11. Japan 15.11.1. Pricing Analysis 15.11.2. Market Share Analysis, 2021 15.11.2.1. By Product 15.11.2.2. By Technology 15.11.2.3. By Application 15.11.2.4. By End Use 15.12. South Korea 15.12.1. Pricing Analysis 15.12.2. Market Share Analysis, 2021 15.12.2.1. By Product 15.12.2.2. By Technology 15.12.2.3. By Application 15.12.2.4. By End Use 15.13. GCC Countries 15.13.1. Pricing Analysis 15.13.2. Market Share Analysis, 2021 15.13.2.1. By Product 15.13.2.2. By Technology 15.13.2.3. By Application 15.13.2.4. By End Use 15.14. South Africa 15.14.1. Pricing Analysis 15.14.2. Market Share Analysis, 2021 15.14.2.1. By Product 15.14.2.2. By Technology 15.14.2.3. By Application 15.14.2.4. By End Use 15.15. Israel 15.15.1. Pricing Analysis 15.15.2. Market Share Analysis, 2021 15.15.2.1. By Product 15.15.2.2. By Technology 15.15.2.3. By Application 15.15.2.4. By End Use 16. Market Structure Analysis 16.1. Competition Dashboard 16.2. Competition Benchmarking 16.3. Market Share Analysis of Top Players 16.3.1. By Regional 16.3.2. By Product 16.3.3. By Technology 16.3.4. By Application 16.3.5. By End Use 17. Competition Analysis 17.1. Competition Deep Dive 17.1.1. Thermo Fischer Scientific Inc. 17.1.1.1. Overview 17.1.1.2. Product Portfolio 17.1.1.3. Profitability by Market Segments 17.1.1.4. Sales Footprint 17.1.1.5. Strategy Overview 17.1.1.5.1. Marketing Strategy 17.1.2. Merck KGaA 17.1.2.1. Overview 17.1.2.2. Product Portfolio 17.1.2.3. Profitability by Market Segments 17.1.2.4. Sales Footprint 17.1.2.5. Strategy Overview 17.1.2.5.1. Marketing Strategy 17.1.3. Sigma-Aldrich Corporation 17.1.3.1. Overview 17.1.3.2. Product Portfolio 17.1.3.3. Profitability by Market Segments 17.1.3.4. Sales Footprint 17.1.3.5. Strategy Overview 17.1.3.5.1. Marketing Strategy 17.1.4. QIAGEN 17.1.4.1. Overview 17.1.4.2. Product Portfolio 17.1.4.3. Profitability by Market Segments 17.1.4.4. Sales Footprint 17.1.4.5. Strategy Overview 17.1.4.5.1. Marketing Strategy 17.1.5. Bio-Rad Laboratories, Inc. 17.1.5.1. Overview 17.1.5.2. Product Portfolio 17.1.5.3. Profitability by Market Segments 17.1.5.4. Sales Footprint 17.1.5.5. Strategy Overview 17.1.5.5.1. Marketing Strategy 17.1.6. Agilent Technologies 17.1.6.1. Overview 17.1.6.2. Product Portfolio 17.1.6.3. Profitability by Market Segments 17.1.6.4. Sales Footprint 17.1.6.5. Strategy Overview 17.1.6.5.1. Marketing Strategy 17.1.7. Promega Corporation 17.1.7.1. Overview 17.1.7.2. Product Portfolio 17.1.7.3. Profitability by Market Segments 17.1.7.4. Sales Footprint 17.1.7.5. Strategy Overview 17.1.7.5.1. Marketing Strategy 17.1.8. General Electric Company 17.1.8.1. Overview 17.1.8.2. Product Portfolio 17.1.8.3. Profitability by Market Segments 17.1.8.4. Sales Footprint 17.1.8.5. Strategy Overview 17.1.8.5.1. Marketing Strategy 17.1.9. Norgen Biotek Corp. 17.1.9.1. Overview 17.1.9.2. Product Portfolio 17.1.9.3. Profitability by Market Segments 17.1.9.4. Sales Footprint 17.1.9.5. Strategy Overview 17.1.9.5.1. Marketing Strategy 17.1.10. Abcam plc 17.1.10.1. Overview 17.1.10.2. Product Portfolio 17.1.10.3. Profitability by Market Segments 17.1.10.4. Sales Footprint 17.1.10.5. Strategy Overview 17.1.10.5.1. Marketing Strategy 18. Assumptions & Acronyms Used 19. Research Methodology
Let us know your requirement to get
100% FREE customization
List of Tables
Table 1: Global Market Value (US$ Mn) Forecast by Region, 2017-2032 Table 2: Global Market Value (US$ Mn) Forecast by Product, 2017-2032 Table 3: Global Market Value (US$ Mn) Forecast by Technology, 2017-2032 Table 4: Global Market Value (US$ Mn) Forecast by Application, 2017-2032 Table 5: Global Market Value (US$ Mn) Forecast by End Use, 2017-2032 Table 6: North America Market Value (US$ Mn) Forecast by Country, 2017-2032 Table 7: North America Market Value (US$ Mn) Forecast by Product, 2017-2032 Table 8: North America Market Value (US$ Mn) Forecast by Technology, 2017-2032 Table 9: North America Market Value (US$ Mn) Forecast by Application, 2017-2032 Table 10: North America Market Value (US$ Mn) Forecast by End Use, 2017-2032 Table 11: Latin America Market Value (US$ Mn) Forecast by Country, 2017-2032 Table 12: Latin America Market Value (US$ Mn) Forecast by Product, 2017-2032 Table 13: Latin America Market Value (US$ Mn) Forecast by Technology, 2017-2032 Table 14: Latin America Market Value (US$ Mn) Forecast by Application, 2017-2032 Table 15: Latin America Market Value (US$ Mn) Forecast by End Use, 2017-2032 Table 16: Europe Market Value (US$ Mn) Forecast by Country, 2017-2032 Table 17: Europe Market Value (US$ Mn) Forecast by Product, 2017-2032 Table 18: Europe Market Value (US$ Mn) Forecast by Technology, 2017-2032 Table 19: Europe Market Value (US$ Mn) Forecast by Application, 2017-2032 Table 20: Europe Market Value (US$ Mn) Forecast by End Use, 2017-2032 Table 21: Asia Pacific Market Value (US$ Mn) Forecast by Country, 2017-2032 Table 22: Asia Pacific Market Value (US$ Mn) Forecast by Product, 2017-2032 Table 23: Asia Pacific Market Value (US$ Mn) Forecast by Technology, 2017-2032 Table 24: Asia Pacific Market Value (US$ Mn) Forecast by Application, 2017-2032 Table 25: Asia Pacific Market Value (US$ Mn) Forecast by End Use, 2017-2032 Table 26: MEA Market Value (US$ Mn) Forecast by Country, 2017-2032 Table 27: MEA Market Value (US$ Mn) Forecast by Product, 2017-2032 Table 28: MEA Market Value (US$ Mn) Forecast by Technology, 2017-2032 Table 29: MEA Market Value (US$ Mn) Forecast by Application, 2017-2032 Table 30: MEA Market Value (US$ Mn) Forecast by End Use, 2017-2032
Find your sweet spots for generating winning opportunities in this market.
Talk to AnalystList of Charts
Figure 1: Global Market Value (US$ Mn) by Product, 2022-2032 Figure 2: Global Market Value (US$ Mn) by Technology, 2022-2032 Figure 3: Global Market Value (US$ Mn) by Application, 2022-2032 Figure 4: Global Market Value (US$ Mn) by End Use, 2022-2032 Figure 5: Global Market Value (US$ Mn) by Region, 2022-2032 Figure 6: Global Market Value (US$ Mn) Analysis by Region, 2017-2032 Figure 7: Global Market Value Share (%) and BPS Analysis by Region, 2022-2032 Figure 8: Global Market Y-o-Y Growth (%) Projections by Region, 2022-2032 Figure 9: Global Market Value (US$ Mn) Analysis by Product, 2017-2032 Figure 10: Global Market Value Share (%) and BPS Analysis by Product, 2022-2032 Figure 11: Global Market Y-o-Y Growth (%) Projections by Product, 2022-2032 Figure 12: Global Market Value (US$ Mn) Analysis by Technology, 2017-2032 Figure 13: Global Market Value Share (%) and BPS Analysis by Technology, 2022-2032 Figure 14: Global Market Y-o-Y Growth (%) Projections by Technology, 2022-2032 Figure 15: Global Market Value (US$ Mn) Analysis by Application, 2017-2032 Figure 16: Global Market Value Share (%) and BPS Analysis by Application, 2022-2032 Figure 17: Global Market Y-o-Y Growth (%) Projections by Application, 2022-2032 Figure 18: Global Market Value (US$ Mn) Analysis by End Use, 2017-2032 Figure 19: Global Market Value Share (%) and BPS Analysis by End Use, 2022-2032 Figure 20: Global Market Y-o-Y Growth (%) Projections by End Use, 2022-2032 Figure 21: Global Market Attractiveness by Product, 2022-2032 Figure 22: Global Market Attractiveness by Technology, 2022-2032 Figure 23: Global Market Attractiveness by Application, 2022-2032 Figure 24: Global Market Attractiveness by End Use, 2022-2032 Figure 25: Global Market Attractiveness by Region, 2022-2032 Figure 26: North America Market Value (US$ Mn) by Product, 2022-2032 Figure 27: North America Market Value (US$ Mn) by Technology, 2022-2032 Figure 28: North America Market Value (US$ Mn) by Application, 2022-2032 Figure 29: North America Market Value (US$ Mn) by End Use, 2022-2032 Figure 30: North America Market Value (US$ Mn) by Country, 2022-2032 Figure 31: North America Market Value (US$ Mn) Analysis by Country, 2017-2032 Figure 32: North America Market Value Share (%) and BPS Analysis by Country, 2022-2032 Figure 33: North America Market Y-o-Y Growth (%) Projections by Country, 2022-2032 Figure 34: North America Market Value (US$ Mn) Analysis by Product, 2017-2032 Figure 35: North America Market Value Share (%) and BPS Analysis by Product, 2022-2032 Figure 36: North America Market Y-o-Y Growth (%) Projections by Product, 2022-2032 Figure 37: North America Market Value (US$ Mn) Analysis by Technology, 2017-2032 Figure 38: North America Market Value Share (%) and BPS Analysis by Technology, 2022-2032 Figure 39: North America Market Y-o-Y Growth (%) Projections by Technology, 2022-2032 Figure 40: North America Market Value (US$ Mn) Analysis by Application, 2017-2032 Figure 41: North America Market Value Share (%) and BPS Analysis by Application, 2022-2032 Figure 42: North America Market Y-o-Y Growth (%) Projections by Application, 2022-2032 Figure 43: North America Market Value (US$ Mn) Analysis by End Use, 2017-2032 Figure 44: North America Market Value Share (%) and BPS Analysis by End Use, 2022-2032 Figure 45: North America Market Y-o-Y Growth (%) Projections by End Use, 2022-2032 Figure 46: North America Market Attractiveness by Product, 2022-2032 Figure 47: North America Market Attractiveness by Technology, 2022-2032 Figure 48: North America Market Attractiveness by Application, 2022-2032 Figure 49: North America Market Attractiveness by End Use, 2022-2032 Figure 50: North America Market Attractiveness by Country, 2022-2032 Figure 51: Latin America Market Value (US$ Mn) by Product, 2022-2032 Figure 52: Latin America Market Value (US$ Mn) by Technology, 2022-2032 Figure 53: Latin America Market Value (US$ Mn) by Application, 2022-2032 Figure 54: Latin America Market Value (US$ Mn) by End Use, 2022-2032 Figure 55: Latin America Market Value (US$ Mn) by Country, 2022-2032 Figure 56: Latin America Market Value (US$ Mn) Analysis by Country, 2017-2032 Figure 57: Latin America Market Value Share (%) and BPS Analysis by Country, 2022-2032 Figure 58: Latin America Market Y-o-Y Growth (%) Projections by Country, 2022-2032 Figure 59: Latin America Market Value (US$ Mn) Analysis by Product, 2017-2032 Figure 60: Latin America Market Value Share (%) and BPS Analysis by Product, 2022-2032 Figure 61: Latin America Market Y-o-Y Growth (%) Projections by Product, 2022-2032 Figure 62: Latin America Market Value (US$ Mn) Analysis by Technology, 2017-2032 Figure 63: Latin America Market Value Share (%) and BPS Analysis by Technology, 2022-2032 Figure 64: Latin America Market Y-o-Y Growth (%) Projections by Technology, 2022-2032 Figure 65: Latin America Market Value (US$ Mn) Analysis by Application, 2017-2032 Figure 66: Latin America Market Value Share (%) and BPS Analysis by Application, 2022-2032 Figure 67: Latin America Market Y-o-Y Growth (%) Projections by Application, 2022-2032 Figure 68: Latin America Market Value (US$ Mn) Analysis by End Use, 2017-2032 Figure 69: Latin America Market Value Share (%) and BPS Analysis by End Use, 2022-2032 Figure 70: Latin America Market Y-o-Y Growth (%) Projections by End Use, 2022-2032 Figure 71: Latin America Market Attractiveness by Product, 2022-2032 Figure 72: Latin America Market Attractiveness by Technology, 2022-2032 Figure 73: Latin America Market Attractiveness by Application, 2022-2032 Figure 74: Latin America Market Attractiveness by End Use, 2022-2032 Figure 75: Latin America Market Attractiveness by Country, 2022-2032 Figure 76: Europe Market Value (US$ Mn) by Product, 2022-2032 Figure 77: Europe Market Value (US$ Mn) by Technology, 2022-2032 Figure 78: Europe Market Value (US$ Mn) by Application, 2022-2032 Figure 79: Europe Market Value (US$ Mn) by End Use, 2022-2032 Figure 80: Europe Market Value (US$ Mn) by Country, 2022-2032 Figure 81: Europe Market Value (US$ Mn) Analysis by Country, 2017-2032 Figure 82: Europe Market Value Share (%) and BPS Analysis by Country, 2022-2032 Figure 83: Europe Market Y-o-Y Growth (%) Projections by Country, 2022-2032 Figure 84: Europe Market Value (US$ Mn) Analysis by Product, 2017-2032 Figure 85: Europe Market Value Share (%) and BPS Analysis by Product, 2022-2032 Figure 86: Europe Market Y-o-Y Growth (%) Projections by Product, 2022-2032 Figure 87: Europe Market Value (US$ Mn) Analysis by Technology, 2017-2032 Figure 88: Europe Market Value Share (%) and BPS Analysis by Technology, 2022-2032 Figure 89: Europe Market Y-o-Y Growth (%) Projections by Technology, 2022-2032 Figure 90: Europe Market Value (US$ Mn) Analysis by Application, 2017-2032 Figure 91: Europe Market Value Share (%) and BPS Analysis by Application, 2022-2032 Figure 92: Europe Market Y-o-Y Growth (%) Projections by Application, 2022-2032 Figure 93: Europe Market Value (US$ Mn) Analysis by End Use, 2017-2032 Figure 94: Europe Market Value Share (%) and BPS Analysis by End Use, 2022-2032 Figure 95: Europe Market Y-o-Y Growth (%) Projections by End Use, 2022-2032 Figure 96: Europe Market Attractiveness by Product, 2022-2032 Figure 97: Europe Market Attractiveness by Technology, 2022-2032 Figure 98: Europe Market Attractiveness by Application, 2022-2032 Figure 99: Europe Market Attractiveness by End Use, 2022-2032 Figure 100: Europe Market Attractiveness by Country, 2022-2032 Figure 101: Asia Pacific Market Value (US$ Mn) by Product, 2022-2032 Figure 102: Asia Pacific Market Value (US$ Mn) by Technology, 2022-2032 Figure 103: Asia Pacific Market Value (US$ Mn) by Application, 2022-2032 Figure 104: Asia Pacific Market Value (US$ Mn) by End Use, 2022-2032 Figure 105: Asia Pacific Market Value (US$ Mn) by Country, 2022-2032 Figure 106: Asia Pacific Market Value (US$ Mn) Analysis by Country, 2017-2032 Figure 107: Asia Pacific Market Value Share (%) and BPS Analysis by Country, 2022-2032 Figure 108: Asia Pacific Market Y-o-Y Growth (%) Projections by Country, 2022-2032 Figure 109: Asia Pacific Market Value (US$ Mn) Analysis by Product, 2017-2032 Figure 110: Asia Pacific Market Value Share (%) and BPS Analysis by Product, 2022-2032 Figure 111: Asia Pacific Market Y-o-Y Growth (%) Projections by Product, 2022-2032 Figure 112: Asia Pacific Market Value (US$ Mn) Analysis by Technology, 2017-2032 Figure 113: Asia Pacific Market Value Share (%) and BPS Analysis by Technology, 2022-2032 Figure 114: Asia Pacific Market Y-o-Y Growth (%) Projections by Technology, 2022-2032 Figure 115: Asia Pacific Market Value (US$ Mn) Analysis by Application, 2017-2032 Figure 116: Asia Pacific Market Value Share (%) and BPS Analysis by Application, 2022-2032 Figure 117: Asia Pacific Market Y-o-Y Growth (%) Projections by Application, 2022-2032 Figure 118: Asia Pacific Market Value (US$ Mn) Analysis by End Use, 2017-2032 Figure 119: Asia Pacific Market Value Share (%) and BPS Analysis by End Use, 2022-2032 Figure 120: Asia Pacific Market Y-o-Y Growth (%) Projections by End Use, 2022-2032 Figure 121: Asia Pacific Market Attractiveness by Product, 2022-2032 Figure 122: Asia Pacific Market Attractiveness by Technology, 2022-2032 Figure 123: Asia Pacific Market Attractiveness by Application, 2022-2032 Figure 124: Asia Pacific Market Attractiveness by End Use, 2022-2032 Figure 125: Asia Pacific Market Attractiveness by Country, 2022-2032 Figure 126: MEA Market Value (US$ Mn) by Product, 2022-2032 Figure 127: MEA Market Value (US$ Mn) by Technology, 2022-2032 Figure 128: MEA Market Value (US$ Mn) by Application, 2022-2032 Figure 129: MEA Market Value (US$ Mn) by End Use, 2022-2032 Figure 130: MEA Market Value (US$ Mn) by Country, 2022-2032 Figure 131: MEA Market Value (US$ Mn) Analysis by Country, 2017-2032 Figure 132: MEA Market Value Share (%) and BPS Analysis by Country, 2022-2032 Figure 133: MEA Market Y-o-Y Growth (%) Projections by Country, 2022-2032 Figure 134: MEA Market Value (US$ Mn) Analysis by Product, 2017-2032 Figure 135: MEA Market Value Share (%) and BPS Analysis by Product, 2022-2032 Figure 136: MEA Market Y-o-Y Growth (%) Projections by Product, 2022-2032 Figure 137: MEA Market Value (US$ Mn) Analysis by Technology, 2017-2032 Figure 138: MEA Market Value Share (%) and BPS Analysis by Technology, 2022-2032 Figure 139: MEA Market Y-o-Y Growth (%) Projections by Technology, 2022-2032 Figure 140: MEA Market Value (US$ Mn) Analysis by Application, 2017-2032 Figure 141: MEA Market Value Share (%) and BPS Analysis by Application, 2022-2032 Figure 142: MEA Market Y-o-Y Growth (%) Projections by Application, 2022-2032 Figure 143: MEA Market Value (US$ Mn) Analysis by End Use, 2017-2032 Figure 144: MEA Market Value Share (%) and BPS Analysis by End Use, 2022-2032 Figure 145: MEA Market Y-o-Y Growth (%) Projections by End Use, 2022-2032 Figure 146: MEA Market Attractiveness by Product, 2022-2032 Figure 147: MEA Market Attractiveness by Technology, 2022-2032 Figure 148: MEA Market Attractiveness by Application, 2022-2032 Figure 149: MEA Market Attractiveness by End Use, 2022-2032 Figure 150: MEA Market Attractiveness by Country, 2022-2032
Need specific information?
Request CustomizationExplore Healthcare Insights
View Reports