Lupine Peptides Market Size and Share Forecast Outlook 2025 to 2035

The market is estimated to be valued at USD 1.1 billion in 2025 and is projected to reach USD 1.8 billion by 2035, registering a compound annual growth rate (CAGR) of 5.0% over the forecast period. The market is projected to add an absolute dollar opportunity of USD 0.7 billion over the forecast period. This reflects 1.63 times growth at a compound annual growth rate of 5.0%. The market's evolution is expected to be shaped by rising demand for natural cosmetic ingredients, anti-aging formulations, and sustainable alternatives to synthetic peptides in personal care applications.
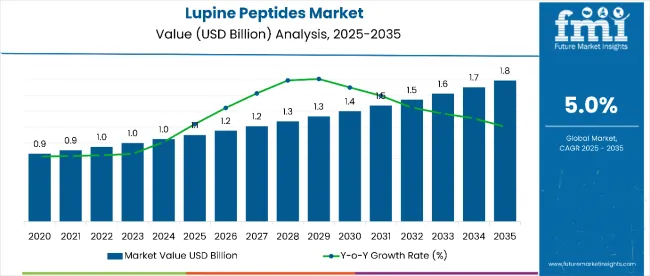
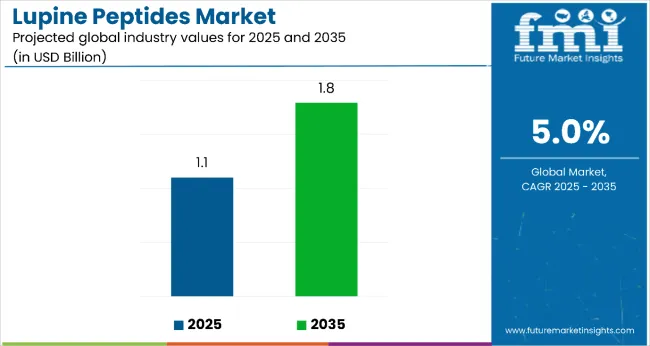
Lupine Peptides Market Value Analysis

Quick Stats for Lupine Peptides Market

  • Lupine Peptides Market Value (2025): USD 1.1 billion
  • Lupine Peptides Market Forecast Value (2035): USD 1.8 billion
  • Lupine Peptides Market Forecast CAGR: 5.0%
  • Leading Nature Segment in Lupine Peptides Market in 2025: Conventional (87%)
  • Leading Powder Segment in Lupine Peptides Market in 2025: Powder (68%)
  • Key Growth Regions in Lupine Peptides Market: East Asia, North America, Western Europe
  • Top Key Players in Lupine Peptides Market: Celsie Limited, Ceapro Inc., Austrade Inc., Lupina LLC, Inveja SAS - lup'ingredients

Lupine Peptides Market

By 2030, the market is likely to reach approximately USD 1.4 billion, accounting for USD 0.3 billion in incremental value over the first half of the decade. The remaining USD 0.4 billion is expected during the second half, suggesting a moderately back-loaded growth pattern. Product innovation around collagen synthesis enhancement and matrix metalloproteinase inhibition is gaining traction due to lupine peptides' favorable bioactivity profile and clean-label appeal.

Companies such as Celsie Limited and Ceapro Inc. are advancing their competitive positions through investment in extraction technologies and scalable peptide production systems. Certification-led procurement models are supporting expansion into organic cosmetics, anti-aging formulations, and premium personal care products. Market performance will remain anchored in regulatory compliance, bioactivity validation, and sustainable sourcing benchmarks.

The market holds around 38% of the plant-based peptides market, driven by its bioactive properties and ability to inhibit matrix metalloproteinase, making it ideal for anti-aging products. It captures 28% of the cosmetic peptides market due to its role in collagen synthesis and clean-label appeal. Additionally, it contributes 22% to the natural cosmetic ingredients segment and 18% to the botanical extracts market, with a 25% share in organic cosmetics, especially for premium skincare and anti-aging formulations.

The market is experiencing a structural transformation, fueled by increasing demand for natural and sustainable cosmetic ingredients. Advanced techniques like enzyme hydrolysis and membrane filtration have improved peptide purity and effectiveness, enhancing their application in anti-aging skincare. Manufacturers are launching standardized extracts and functional blends for both cosmetic and nutraceutical use. Strategic partnerships between suppliers and formulators have driven growth, while online retail channels have expanded consumer reach, compelling conventional peptide producers to shift toward more innovative and eco-conscious solutions.

Why is the Lupine Peptides Market Growing?

Lupine peptides’ proven matrix metalloproteinase inhibition properties, collagen synthesis enhancement, and natural origin make them an attractive alternative to synthetic anti-aging ingredients in premium cosmetic formulations.

Growing awareness of clean-label cosmetics and natural skincare solutions is further propelling adoption, especially in organic personal care products and anti-aging treatments. Consumer demand for sustainable ingredients, along with innovations in extraction technology, are also enhancing product quality and bioactivity profiles.

As the global cosmetics industry continues to prioritize natural ingredients and anti-aging efficacy, the market outlook remains favorable. With consumers and manufacturers prioritizing sustainability, ingredient transparency, and proven bioactivity, lupine peptides are well-positioned to expand across various cosmetic and nutraceutical applications.

Lupine Peptides Market Analysis by Top Investment Segments

The market is segmented by nature, form, source, end use, and region. By nature, the market includes organic and conventional. Based on form, the market is divided into powder and liquid. Based on source, the market covers flower-derived and seed-derived extracts. In terms of end use, the market includes cosmetics and personal care, hair care, skin care, cosmetics, nutraceuticals, and pharmaceuticals. Regionally, the market is analyzed across North America, Latin America, Europe, East Asia, South Asia and Pacific, Oceania, and the Middle East and Africa.
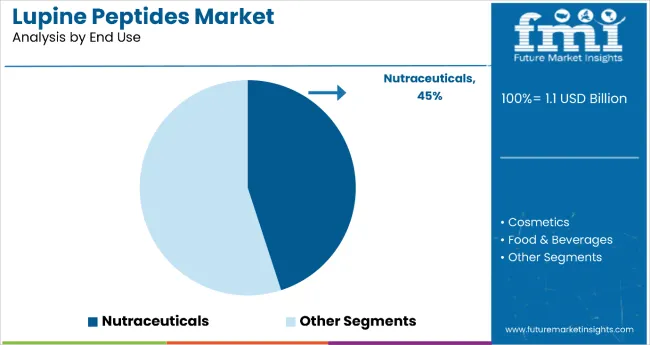
By End Use, Nutraceuticals Segment Accounts for 45% of the Market Share

Lupine Peptides Market By End Use

The nutraceuticals segment leads with 45% of the market share, making it the most prominent application area for lupine peptides. This dominance is attributed to their growing use in dietary supplements, protein powders, and wellness-enhancing formulations that support preventive health strategies.

Key functional benefits such as appetite regulation, muscle recovery, and blood sugar control position lupine peptides as a valuable ingredient in plant-based sports nutrition and general wellness supplements. Demand is especially strong in North America and Europe, where consumers are actively seeking natural, plant-sourced health solutions.

Manufacturers are focusing on improving bioavailability and clinical efficacy through advanced research and formulation innovation. The segment continues to expand as clean-label trends and proactive healthcare consumption drive the integration of functional plant proteins into everyday nutrition.
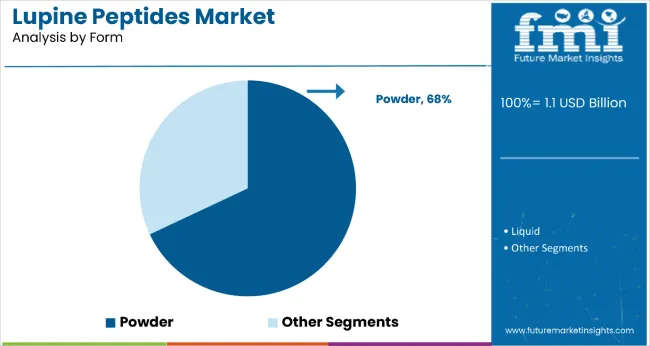
By Form, Powder Segment Accounts for 68% of the Market Share

Lupine Peptides Market By Form

The powder segment holds a leading 68% share in the form category, reflecting its wide adoption in both cosmetic and nutraceutical formulations due to superior stability, shelf life, and formulation flexibility. Powdered lupine peptides minimize moisture-related degradation, allowing for greater control during product development and storage.

Advanced processing techniques such as spray drying and freeze drying are being employed to improve peptide integrity and solubility, making powder an ideal format for diverse application needs.

Its compatibility with various delivery systems, such as capsules, sachets, and dry blends, supports the segment’s continued dominance. As demand rises for stable, cost-effective, and bioactive ingredients, the powder form is expected to remain the format of choice across expanding health and beauty product portfolios.

What are the Drivers, Restraints, and Key Trends of the Lupine Peptides Market?

In 2024, the global lupine peptides market experienced steady growth, driven by their expanding application in anti-aging skincare and functional cosmetic formulations. Rising demand for sustainable, plant-based bioactives and growing consumer preference for clean-label beauty products are positioning lupine peptides as a highly desirable ingredient.

While growth is being supported by strong efficacy validation and sustainability trends, challenges remain in terms of consistent sourcing and production scalability. Key trends include organic certification integration, traceable sourcing, and advanced peptide refinement technologies that enhance formulation effectiveness. These developments are helping cosmetic brands differentiate their offerings, meet environmental standards, and strengthen consumer trust in naturally derived anti-aging solutions.

Key Drivers Fueling Lupine Peptides Market Expansion

The primary driver of market growth is the increasing demand for anti-aging cosmetic products, fueled by the aging global population and rising consumer awareness around skin health. In 2024, dermatological research validating the efficacy of lupine peptides in inhibiting matrix metalloproteinase enzymes elevated their status as a trusted bioactive in premium skincare. As a result, cosmetic manufacturers are incorporating high-purity lupine peptides into anti-wrinkle, firming, and collagen-boosting formulations.

The market is also benefitting from broader industry adoption of sustainable ingredient sourcing strategies. From 2025 onward, manufacturers began prioritizing organic certification and traceability in response to rising consumer demand for environmentally responsible and ethically sourced ingredients. Suppliers offering certified organic lupine peptides with sustainable production practices are becoming strategic partners for brands looking to align with global sustainability commitments.

These combined factors are positioning lupine peptides as a core ingredient in future-facing cosmetic innovation, particularly within the premium and clean beauty segments.

Major Restraints Challenging Lupine Peptides Market Development

Despite positive momentum, the market faces several restraints related to ingredient sourcing, processing costs, and production scalability. Producing high-purity bioactive lupine peptides requires specialized extraction and refinement techniques, which can increase cost and limit output capacity. As cosmetic brands demand verified sustainable and organic sourcing, suppliers must invest in certification processes and traceable infrastructure, adding complexity to the supply chain.

Additionally, consistent raw material availability is dependent on agricultural factors and regional harvesting conditions, which may affect long-term supply planning. Emerging brands may also struggle with access to premium lupine peptide suppliers, as large-scale manufacturers secure exclusive partnerships for high-performance ingredients. These factors create adoption barriers for smaller companies and could limit rapid market penetration.

Emerging Key Trends Influencing Lupine Peptides Market Direction

The integration of sustainability into ingredient sourcing strategies is emerging as a key trend in the lupine peptides market. Cosmetic brands are embedding certification systems and traceability platforms directly into procurement operations, enabling real-time verification of sustainable practices and boosting transparency throughout the supply chain. These developments are enhancing brand equity and providing competitive advantages in the clean beauty space.

Formulation innovation is another critical trend, with manufacturers investing in bioactive peptide enhancement technologies to increase solubility, skin penetration, and efficacy. As consumers prioritize both performance and sustainability, clean-label, plant-based anti-aging solutions are gaining traction globally.

Regionally, Europe is leading in sustainable cosmetic ingredient adoption, while Asia Pacific is showing strong potential due to increasing skincare awareness and demand for plant-based formulations. These shifts indicate a growing market opportunity for lupine peptide suppliers who can deliver both clinical efficacy and sustainable sourcing credentials.
Analysis of Lupine Peptides Market by Key Countries

Country Wise Analysis Of Lupine Peptides Market

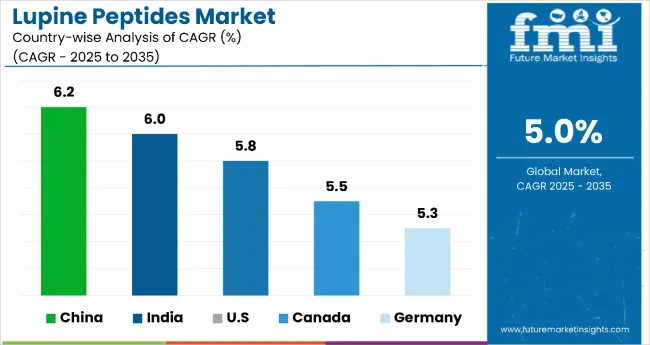
In the lupine peptides market, China leads with the highest projected CAGR of 6.2%, driven by rapid growth in premium cosmetics and sustainable sourcing. India follows at 6.0%, fueled by Ayurvedic integration and rising urban demand. The USA, the largest market, is expected to grow at 5.8% due to strong clean-label and nutraceutical trends. Canada shows steady growth at 5.5%, supported by organic product demand. Germany and France both forecast 5.3% CAGR, backed by strict organic standards, while the UK grows at 4.9%, driven by clean beauty preferences and regulatory shifts post-Brexit.

The report covers an in-depth analysis of 40+ countries; five top-performing OECD countries are highlighted below.

Future Outlook for Lupine Peptides in China

Sales of lupine peptides in China are expected to lead with a CAGR of 6.2%, fueled by rapid expansion in domestic cosmetics manufacturing and increasing consumer preference for natural anti-aging ingredients. Premium skincare brands are incorporating lupine peptides into anti-aging formulations targeting urban consumers. Local manufacturers are focusing on sustainable extraction technologies and organic certification to meet both domestic and export requirements.

  • Organic lupine peptides prioritized in premium cosmetic formulations.
  • Advanced extraction technologies reduce production costs and improve purity.
  • Local brands scale production for domestic use and international exports.

Lupine Peptides Market Growth Outlook in India

In India, lupine peptides revenue is projected to grow at 6.0% CAGR, supported by traditional medicine integration and rising demand for natural cosmetic ingredients. Adoption of lupine peptides in Ayurvedic skincare formulations is increasing among domestic brands. Growing middle-class disposable income and awareness of anti-aging solutions are driving market expansion in metro and tier-2 cities.

  • Ayurvedic cosmetic brands integrate lupine peptides into traditional formulations.
  • Urban consumer awareness drives demand for natural anti-aging solutions.
  • Domestic extraction facilities focus on sustainable and cost-effective production.

Demand Forecast for Lupine Peptides in Germany

Sales of lupine peptides in Germany are forecast to expand at a 5.3% CAGR, driven by stringent organic cosmetic regulations and consumer preference for certified natural ingredients. Advanced biotechnology companies are developing standardized lupine peptide extracts for premium skincare applications. Strong regulatory framework supports quality assurance and sustainable sourcing practices.

  • Organic certification standards drive adoption in premium cosmetic brands.
  • Biotechnology innovations enhance peptide purity and bioactivity profiles.
  • Regulatory compliance ensures quality standards for export markets.

Demand Analysis for Lupine Peptides Market in USA

The USA lupine peptides demand is expected to remain the largest market, driven by rising demand for plant-based proteins, functional foods, and advanced skincare formulations. A projected CAGR of 5.8% is anticipated over the forecast period, supported by the country's mature nutraceutical industry and strong clean-label movement. USA manufacturers are increasingly incorporating lupine peptides in anti-aging, sports nutrition, and vegan-friendly products to cater to health-conscious and sustainability-driven consumers.

  • Robust demand for plant-based and clean-label ingredients in functional nutrition.
  • Advanced cosmetic brands integrating lupine peptides in clinical-grade anti-aging lines.
  • Strong retail and e-commerce infrastructure supports mass and premium market adoption.

In-depth Analysis of Lupine Peptide Market in Canada

The Canada lupine peptides revenue is projected to grow at a CAGR of 5.5%, underpinned by the country’s emphasis on organic, non-GMO, and sustainable product development. Canadian cosmetic and nutraceutical brands are incorporating lupine peptides into holistic wellness and skincare offerings. Government support for clean technology and sustainable agriculture further enhances the appeal of lupine-based ingredients among manufacturers and consumers.

  • Consumer demand for certified organic and natural health products boosts peptide adoption.
  • Focus on sustainable supply chains aligns with eco-conscious consumer behavior.
  • Domestic brands explore peptide-enriched solutions for aging, immunity, and metabolic health.

Competitive Landscape of Lupine Peptides Market

The market is moderately fragmented, featuring specialized ingredient suppliers with varying degrees of extraction expertise and market positioning. Celsie Limited and Ceapro Inc. lead the biotechnology-focused segment, supplying high-purity peptides for premium cosmetic applications and pharmaceutical research. Their strength lies in advanced extraction technologies and regulatory compliance capabilities.

Austrade Inc. differentiates through sustainable sourcing solutions, including organic certification and traceability systems that cater to premium cosmetic brands seeking verified natural ingredients. Lupina LLC and Inveja SAS - lup'ingredients focus on commercial-scale production and cost-effective extraction methods, addressing growing demand for affordable natural peptides in mainstream cosmetic formulations.

Regional players emphasize local sourcing advantages and specialized extraction techniques, ensuring quality consistency and supply chain reliability for domestic markets. Meanwhile, established ingredient suppliers are investing in lupine peptide production capabilities to diversify their natural ingredient portfolios.

Scope of the Report - Lupine Peptides Market

Item Value
Quantitative Units USD 1.1 Billion
Nature Organic and Conventional
Form Powder and Liquid
Source Flower and Seed
End Use Cosmetics and Personal Care, Hair Care, Skin Care, Cosmetics, Nutraceuticals, and Pharmaceuticals
Regions Covered North America, Europe, Asia-Pacific, Latin America, Middle East & Africa
Country Covered United States, Canada, Germany, France, United Kingdom, China, Japan, India, Brazil, South Africa , Australia, and 40+ countries
Key Companies Profiled Celsie Limited, Ceapro Inc., Austrade Inc., Lupina LLC, Inveja SAS - lup'ingredients , Botaneco Inc., Croda International Plc, Symrise AG, Givaudan Active Beauty, Bioiberica S.A.U.
Additional Attributes Dollar sales by nature and end-use sector, growing usage in anti-aging and cosmetic applications for premium skincare products, stable demand in nutraceutical and pharmaceutical applications, innovations in extraction technology and bioactivity enhancement improve purity, efficacy, and regulatory compliance

Key Segmentation

By Nature:

  • Organic
  • Conventional

By Form:

  • Powder
  • Liquid

By Source:

  • Flower
  • Seed

By End Use:

  • Cosmetics and Personal Care
  • Hair Care
  • Skin Care
  • Cosmetics
  • Nutraceuticals
  • Pharmaceuticals

Table of Content

  1. Executive Summary
    • Global Market Outlook
    • Demand-side Trends
    • Supply-side Trends
    • Technology Roadmap Analysis
    • Analysis and Recommendations
  2. Market Overview
    • Market Coverage / Taxonomy
    • Market Definition / Scope / Limitations
  3. Market Background
    • Market Dynamics
      • Drivers
      • Restraints
      • Opportunity
      • Trends
    • Scenario Forecast
      • Demand in Optimistic Scenario
      • Demand in Likely Scenario
      • Demand in Conservative Scenario
    • Opportunity Map Analysis
    • Product Life Cycle Analysis
    • Supply Chain Analysis
      • Supply Side Participants and their Roles
        • Producers
        • Mid-Level Participants (Traders/ Agents/ Brokers)
        • Wholesalers and Distributors
      • Value Added and Value Created at Node in the Supply Chain
      • List of Raw Material Suppliers
      • List of Existing and Potential Buyer’s
    • Investment Feasibility Matrix
    • Value Chain Analysis
      • Profit Margin Analysis
      • Wholesalers and Distributors
      • Retailers
    • PESTLE and Porter’s Analysis
    • Regulatory Landscape
      • By Key Regions
      • By Key Countries
    • Regional Parent Market Outlook
    • Production and Consumption Statistics
    • Import and Export Statistics
  4. Global Market Analysis 2020 to 2024 and Forecast, 2025 to 2035
    • Historical Market Size Value (USD Billion) & Volume (Metric Tons) Analysis, 2020 to 2024
    • Current and Future Market Size Value (USD Billion) & Volume (Metric Tons) Projections, 2025 to 2035
      • Y-o-Y Growth Trend Analysis
      • Absolute $ Opportunity Analysis
  5. Global Market Pricing Analysis 2020 to 2024 and Forecast 2025 to 2035
  6. Global Market Analysis 2020 to 2024 and Forecast 2025 to 2035, By Nature
    • Introduction / Key Findings
    • Historical Market Size Value (USD Billion) & Volume (Metric Tons) Analysis By Nature, 2020 to 2024
    • Current and Future Market Size Value (USD Billion) & Volume (Metric Tons) Analysis and Forecast By Nature, 2025 to 2035
      • Organic
      • Conventional
    • Y-o-Y Growth Trend Analysis By Nature, 2020 to 2024
    • Absolute $ Opportunity Analysis By Nature, 2025 to 2035
  7. Global Market Analysis 2020 to 2024 and Forecast 2025 to 2035, By Form
    • Introduction / Key Findings
    • Historical Market Size Value (USD Billion) & Volume (Metric Tons) Analysis By Form, 2020 to 2024
    • Current and Future Market Size Value (USD Billion) & Volume (Metric Tons) Analysis and Forecast By Form, 2025 to 2035
      • Powder
      • Liquid
    • Y-o-Y Growth Trend Analysis By Form, 2020 to 2024
    • Absolute $ Opportunity Analysis By Form, 2025 to 2035
  8. Global Market Analysis 2020 to 2024 and Forecast 2025 to 2035, By Source
    • Introduction / Key Findings
    • Historical Market Size Value (USD Billion) & Volume (Metric Tons) Analysis By Source, 2020 to 2024
    • Current and Future Market Size Value (USD Billion) & Volume (Metric Tons) Analysis and Forecast By Source, 2025 to 2035
      • Flower
      • Seed
    • Y-o-Y Growth Trend Analysis By Source, 2020 to 2024
    • Absolute $ Opportunity Analysis By Source, 2025 to 2035
  9. Global Market Analysis 2020 to 2024 and Forecast 2025 to 2035, By End Use
    • Introduction / Key Findings
    • Historical Market Size Value (USD Billion) & Volume (Metric Tons) Analysis By End Use, 2020 to 2024
    • Current and Future Market Size Value (USD Billion) & Volume (Metric Tons) Analysis and Forecast By End Use, 2025 to 2035
      • Cosmetics and Personal Care
      • Hair Care
      • Skin Care
      • Cosmetics
      • Nutraceuticals
      • Pharmaceuticals
    • Y-o-Y Growth Trend Analysis By End Use, 2020 to 2024
    • Absolute $ Opportunity Analysis By End Use, 2025 to 2035
  10. Global Market Analysis 2020 to 2024 and Forecast 2025 to 2035, By Region
    • Introduction
    • Historical Market Size Value (USD Billion) & Volume (Metric Tons) Analysis By Region, 2020 to 2024
    • Current Market Size Value (USD Billion) & Volume (Metric Tons) Analysis and Forecast By Region, 2025 to 2035
      • North America
      • Latin America
      • Western Europe
      • Eastern Europe
      • East Asia
      • South Asia & Pacific
      • Middle East and Africa
    • Market Attractiveness Analysis By Region
  11. North America Market Analysis 2020 to 2024 and Forecast 2025 to 2035, By Country
    • Historical Market Size Value (USD Billion) & Volume (Metric Tons) Trend Analysis By Market Taxonomy, 2020 to 2024
    • Market Size Value (USD Billion) & Volume (Metric Tons) Forecast By Market Taxonomy, 2025 to 2035
      • By Country
        • USA
        • Canada
        • Mexico
      • By Nature
      • By Form
      • By Source
      • By End Use
    • Market Attractiveness Analysis
      • By Country
      • By Nature
      • By Form
      • By Source
      • By End Use
    • Key Takeaways
  12. Latin America Market Analysis 2020 to 2024 and Forecast 2025 to 2035, By Country
    • Historical Market Size Value (USD Billion) & Volume (Metric Tons) Trend Analysis By Market Taxonomy, 2020 to 2024
    • Market Size Value (USD Billion) & Volume (Metric Tons) Forecast By Market Taxonomy, 2025 to 2035
      • By Country
        • Brazil
        • Argentina
        • Rest of LATAM
      • By Nature
      • By Form
      • By Source
      • By End Use
    • Market Attractiveness Analysis
      • By Country
      • By Nature
      • By Form
      • By Source
      • By End Use
    • Key Takeaways
  13. Western Europe Market Analysis 2020 to 2024 and Forecast 2025 to 2035, By Country
    • Historical Market Size Value (USD Billion) & Volume (Metric Tons) Trend Analysis By Market Taxonomy, 2020 to 2024
    • Market Size Value (USD Billion) & Volume (Metric Tons) Forecast By Market Taxonomy, 2025 to 2035
      • By Country
        • Germany
        • Italy
        • France
        • UK
        • Spain
        • BENELUX
        • Nordic
        • Rest of W.Europe
      • By Nature
      • By Form
      • By Source
      • By End Use
    • Market Attractiveness Analysis
      • By Country
      • By Nature
      • By Form
      • By Source
      • By End Use
    • Key Takeaways
  14. Eastern Europe Market Analysis 2020 to 2024 and Forecast 2025 to 2035, By Country
    • Historical Market Size Value (USD Billion) & Volume (Metric Tons) Trend Analysis By Market Taxonomy, 2020 to 2024
    • Market Size Value (USD Billion) & Volume (Metric Tons) Forecast By Market Taxonomy, 2025 to 2035
      • By Country
        • Russia
        • Hungary
        • Poland
        • Balkan & Baltics
        • Rest of E. Europe
      • By Nature
      • By Form
      • By Source
      • By End Use
    • Market Attractiveness Analysis
      • By Country
      • By Nature
      • By Form
      • By Source
      • By End Use
    • Key Takeaways
  15. East Asia Market Analysis 2020 to 2024 and Forecast 2025 to 2035, By Country
    • Historical Market Size Value (USD Billion) & Volume (Metric Tons) Trend Analysis By Market Taxonomy, 2020 to 2024
    • Market Size Value (USD Billion) & Volume (Metric Tons) Forecast By Market Taxonomy, 2025 to 2035
      • By Country
        • China
        • Japan
        • South Korea
      • By Nature
      • By Form
      • By Source
      • By End Use
    • Market Attractiveness Analysis
      • By Country
      • By Nature
      • By Form
      • By Source
      • By End Use
    • Key Takeaways
  16. South Asia & Pacific Market Analysis 2020 to 2024 and Forecast 2025 to 2035, By Country
    • Historical Market Size Value (USD Billion) & Volume (Metric Tons) Trend Analysis By Market Taxonomy, 2020 to 2024
    • Market Size Value (USD Billion) & Volume (Metric Tons) Forecast By Market Taxonomy, 2025 to 2035
      • By Country
        • India
        • Australia & New Zealand
        • ASEAN
        • Rest of SAP
      • By Nature
      • By Form
      • By Source
      • By End Use
    • Market Attractiveness Analysis
      • By Country
      • By Nature
      • By Form
      • By Source
      • By End Use
    • Key Takeaways
  17. Middle East and Africa Market Analysis 2020 to 2024 and Forecast 2025 to 2035, By Country
    • Historical Market Size Value (USD Billion) & Volume (Metric Tons) Trend Analysis By Market Taxonomy, 2020 to 2024
    • Market Size Value (USD Billion) & Volume (Metric Tons) Forecast By Market Taxonomy, 2025 to 2035
      • By Country
        • GCC Countries
        • Northern Africa
        • South Africa
        • Turkiye
        • Rest of MEA
      • By Nature
      • By Form
      • By Source
      • By End Use
    • Market Attractiveness Analysis
      • By Country
      • By Nature
      • By Form
      • By Source
      • By End Use
    • Key Takeaways
  18. Key Countries Market Analysis
    • USA
      • Pricing Analysis
      • Market Share Analysis, 2024
        • By Nature
        • By Form
        • By Source
        • By End Use
    • Canada
      • Pricing Analysis
      • Market Share Analysis, 2024
        • By Nature
        • By Form
        • By Source
        • By End Use
    • Brazil
      • Pricing Analysis
      • Market Share Analysis, 2024
        • By Nature
        • By Form
        • By Source
        • By End Use
    • Mexico
      • Pricing Analysis
      • Market Share Analysis, 2024
        • By Nature
        • By Form
        • By Source
        • By End Use
    • Argentina
      • Pricing Analysis
      • Market Share Analysis, 2024
        • By Nature
        • By Form
        • By Source
        • By End Use
  19. Market Structure Analysis
    • Competition Dashboard
    • Competition Benchmarking
    • Market Share Analysis of Top Players
      • By Regional
      • By Nature
      • By Form
      • By Source
      • By End Use
  20. Competition Analysis
    • Competition Deep Dive
      • Celsie Limited
        • Overview
        • Product Portfolio
        • Profitability by Market Segments (Product/Age /Sales Channel/Region)
        • Sales Footprint
        • Strategy Overview
          • Marketing Strategy
          • Product Strategy
          • Channel Strategy
      • Ceapro Inc.
        • Overview
        • Product Portfolio
        • Profitability by Market Segments (Product/Age /Sales Channel/Region)
        • Sales Footprint
        • Strategy Overview
          • Marketing Strategy
          • Product Strategy
          • Channel Strategy
      • Austrade Inc.
        • Overview
        • Product Portfolio
        • Profitability by Market Segments (Product/Age /Sales Channel/Region)
        • Sales Footprint
        • Strategy Overview
          • Marketing Strategy
          • Product Strategy
          • Channel Strategy
      • Lupina LLC
        • Overview
        • Product Portfolio
        • Profitability by Market Segments (Product/Age /Sales Channel/Region)
        • Sales Footprint
        • Strategy Overview
          • Marketing Strategy
          • Product Strategy
          • Channel Strategy
      • Inveja SAS - lup'ingredients
        • Overview
        • Product Portfolio
        • Profitability by Market Segments (Product/Age /Sales Channel/Region)
        • Sales Footprint
        • Strategy Overview
          • Marketing Strategy
          • Product Strategy
          • Channel Strategy
      • Botaneco Inc.
        • Overview
        • Product Portfolio
        • Profitability by Market Segments (Product/Age /Sales Channel/Region)
        • Sales Footprint
        • Strategy Overview
          • Marketing Strategy
          • Product Strategy
          • Channel Strategy
      • Croda International Plc
        • Overview
        • Product Portfolio
        • Profitability by Market Segments (Product/Age /Sales Channel/Region)
        • Sales Footprint
        • Strategy Overview
          • Marketing Strategy
          • Product Strategy
          • Channel Strategy
      • Symrise AG
        • Overview
        • Product Portfolio
        • Profitability by Market Segments (Product/Age /Sales Channel/Region)
        • Sales Footprint
        • Strategy Overview
          • Marketing Strategy
          • Product Strategy
          • Channel Strategy
      • Givaudan Active Beauty
        • Overview
        • Product Portfolio
        • Profitability by Market Segments (Product/Age /Sales Channel/Region)
        • Sales Footprint
        • Strategy Overview
          • Marketing Strategy
          • Product Strategy
          • Channel Strategy
      • Bioiberica S.A.U.
        • Overview
        • Product Portfolio
        • Profitability by Market Segments (Product/Age /Sales Channel/Region)
        • Sales Footprint
        • Strategy Overview
          • Marketing Strategy
          • Product Strategy
          • Channel Strategy
  21. Assumptions & Acronyms Used
  22. Research Methodology

List of Tables

  • Table 1: Global Market Value (USD Billion) Forecast by Region, 2020 to 2035
  • Table 2: Global Market Volume (Metric Tons) Forecast by Region, 2020 to 2035
  • Table 3: Global Market Value (USD Billion) Forecast by Nature, 2020 to 2035
  • Table 4: Global Market Volume (Metric Tons) Forecast by Nature, 2020 to 2035
  • Table 5: Global Market Value (USD Billion) Forecast by Form, 2020 to 2035
  • Table 6: Global Market Volume (Metric Tons) Forecast by Form, 2020 to 2035
  • Table 7: Global Market Value (USD Billion) Forecast by Source, 2020 to 2035
  • Table 8: Global Market Volume (Metric Tons) Forecast by Source, 2020 to 2035
  • Table 9: Global Market Value (USD Billion) Forecast by End Use, 2020 to 2035
  • Table 10: Global Market Volume (Metric Tons) Forecast by End Use, 2020 to 2035
  • Table 11: North America Market Value (USD Billion) Forecast by Country, 2020 to 2035
  • Table 12: North America Market Volume (Metric Tons) Forecast by Country, 2020 to 2035
  • Table 13: North America Market Value (USD Billion) Forecast by Nature, 2020 to 2035
  • Table 14: North America Market Volume (Metric Tons) Forecast by Nature, 2020 to 2035
  • Table 15: North America Market Value (USD Billion) Forecast by Form, 2020 to 2035
  • Table 16: North America Market Volume (Metric Tons) Forecast by Form, 2020 to 2035
  • Table 17: North America Market Value (USD Billion) Forecast by Source, 2020 to 2035
  • Table 18: North America Market Volume (Metric Tons) Forecast by Source, 2020 to 2035
  • Table 19: North America Market Value (USD Billion) Forecast by End Use, 2020 to 2035
  • Table 20: North America Market Volume (Metric Tons) Forecast by End Use, 2020 to 2035
  • Table 21: Latin America Market Value (USD Billion) Forecast by Country, 2020 to 2035
  • Table 22: Latin America Market Volume (Metric Tons) Forecast by Country, 2020 to 2035
  • Table 23: Latin America Market Value (USD Billion) Forecast by Nature, 2020 to 2035
  • Table 24: Latin America Market Volume (Metric Tons) Forecast by Nature, 2020 to 2035
  • Table 25: Latin America Market Value (USD Billion) Forecast by Form, 2020 to 2035
  • Table 26: Latin America Market Volume (Metric Tons) Forecast by Form, 2020 to 2035
  • Table 27: Latin America Market Value (USD Billion) Forecast by Source, 2020 to 2035
  • Table 28: Latin America Market Volume (Metric Tons) Forecast by Source, 2020 to 2035
  • Table 29: Latin America Market Value (USD Billion) Forecast by End Use, 2020 to 2035
  • Table 30: Latin America Market Volume (Metric Tons) Forecast by End Use, 2020 to 2035
  • Table 31: Western Europe Market Value (USD Billion) Forecast by Country, 2020 to 2035
  • Table 32: Western Europe Market Volume (Metric Tons) Forecast by Country, 2020 to 2035
  • Table 33: Western Europe Market Value (USD Billion) Forecast by Nature, 2020 to 2035
  • Table 34: Western Europe Market Volume (Metric Tons) Forecast by Nature, 2020 to 2035
  • Table 35: Western Europe Market Value (USD Billion) Forecast by Form, 2020 to 2035
  • Table 36: Western Europe Market Volume (Metric Tons) Forecast by Form, 2020 to 2035
  • Table 37: Western Europe Market Value (USD Billion) Forecast by Source, 2020 to 2035
  • Table 38: Western Europe Market Volume (Metric Tons) Forecast by Source, 2020 to 2035
  • Table 39: Western Europe Market Value (USD Billion) Forecast by End Use, 2020 to 2035
  • Table 40: Western Europe Market Volume (Metric Tons) Forecast by End Use, 2020 to 2035
  • Table 41: Eastern Europe Market Value (USD Billion) Forecast by Country, 2020 to 2035
  • Table 42: Eastern Europe Market Volume (Metric Tons) Forecast by Country, 2020 to 2035
  • Table 43: Eastern Europe Market Value (USD Billion) Forecast by Nature, 2020 to 2035
  • Table 44: Eastern Europe Market Volume (Metric Tons) Forecast by Nature, 2020 to 2035
  • Table 45: Eastern Europe Market Value (USD Billion) Forecast by Form, 2020 to 2035
  • Table 46: Eastern Europe Market Volume (Metric Tons) Forecast by Form, 2020 to 2035
  • Table 47: Eastern Europe Market Value (USD Billion) Forecast by Source, 2020 to 2035
  • Table 48: Eastern Europe Market Volume (Metric Tons) Forecast by Source, 2020 to 2035
  • Table 49: Eastern Europe Market Value (USD Billion) Forecast by End Use, 2020 to 2035
  • Table 50: Eastern Europe Market Volume (Metric Tons) Forecast by End Use, 2020 to 2035
  • Table 51: East Asia Market Value (USD Billion) Forecast by Country, 2020 to 2035
  • Table 52: East Asia Market Volume (Metric Tons) Forecast by Country, 2020 to 2035
  • Table 53: East Asia Market Value (USD Billion) Forecast by Nature, 2020 to 2035
  • Table 54: East Asia Market Volume (Metric Tons) Forecast by Nature, 2020 to 2035
  • Table 55: East Asia Market Value (USD Billion) Forecast by Form, 2020 to 2035
  • Table 56: East Asia Market Volume (Metric Tons) Forecast by Form, 2020 to 2035
  • Table 57: East Asia Market Value (USD Billion) Forecast by Source, 2020 to 2035
  • Table 58: East Asia Market Volume (Metric Tons) Forecast by Source, 2020 to 2035
  • Table 59: East Asia Market Value (USD Billion) Forecast by End Use, 2020 to 2035
  • Table 60: East Asia Market Volume (Metric Tons) Forecast by End Use, 2020 to 2035
  • Table 61: South Asia & Pacific Market Value (USD Billion) Forecast by Country, 2020 to 2035
  • Table 62: South Asia & Pacific Market Volume (Metric Tons) Forecast by Country, 2020 to 2035
  • Table 63: South Asia & Pacific Market Value (USD Billion) Forecast by Nature, 2020 to 2035
  • Table 64: South Asia & Pacific Market Volume (Metric Tons) Forecast by Nature, 2020 to 2035
  • Table 65: South Asia & Pacific Market Value (USD Billion) Forecast by Form, 2020 to 2035
  • Table 66: South Asia & Pacific Market Volume (Metric Tons) Forecast by Form, 2020 to 2035
  • Table 67: South Asia & Pacific Market Value (USD Billion) Forecast by Source, 2020 to 2035
  • Table 68: South Asia & Pacific Market Volume (Metric Tons) Forecast by Source, 2020 to 2035
  • Table 69: South Asia & Pacific Market Value (USD Billion) Forecast by End Use, 2020 to 2035
  • Table 70: South Asia & Pacific Market Volume (Metric Tons) Forecast by End Use, 2020 to 2035
  • Table 71: Middle East and Africa Market Value (USD Billion) Forecast by Country, 2020 to 2035
  • Table 72: Middle East and Africa Market Volume (Metric Tons) Forecast by Country, 2020 to 2035
  • Table 73: Middle East and Africa Market Value (USD Billion) Forecast by Nature, 2020 to 2035
  • Table 74: Middle East and Africa Market Volume (Metric Tons) Forecast by Nature, 2020 to 2035
  • Table 75: Middle East and Africa Market Value (USD Billion) Forecast by Form, 2020 to 2035
  • Table 76: Middle East and Africa Market Volume (Metric Tons) Forecast by Form, 2020 to 2035
  • Table 77: Middle East and Africa Market Value (USD Billion) Forecast by Source, 2020 to 2035
  • Table 78: Middle East and Africa Market Volume (Metric Tons) Forecast by Source, 2020 to 2035
  • Table 79: Middle East and Africa Market Value (USD Billion) Forecast by End Use, 2020 to 2035
  • Table 80: Middle East and Africa Market Volume (Metric Tons) Forecast by End Use, 2020 to 2035

List of Figures

  • Figure 1: Global Market Volume (Metric Tons) Forecast 2020 to 2035
  • Figure 2: Global Market Pricing Analysis
  • Figure 3: Global Market Value (USD Billion) Forecast 2020 to 2035
  • Figure 4: Global Market Value Share and BPS Analysis by Nature, 2025 and 2035
  • Figure 5: Global Market Y-o-Y Growth Comparison by Nature, 2025 to 2035
  • Figure 6: Global Market Attractiveness Analysis by Nature
  • Figure 7: Global Market Value Share and BPS Analysis by Form, 2025 and 2035
  • Figure 8: Global Market Y-o-Y Growth Comparison by Form, 2025 to 2035
  • Figure 9: Global Market Attractiveness Analysis by Form
  • Figure 10: Global Market Value Share and BPS Analysis by Source, 2025 and 2035
  • Figure 11: Global Market Y-o-Y Growth Comparison by Source, 2025 to 2035
  • Figure 12: Global Market Attractiveness Analysis by Source
  • Figure 13: Global Market Value Share and BPS Analysis by End Use, 2025 and 2035
  • Figure 14: Global Market Y-o-Y Growth Comparison by End Use, 2025 to 2035
  • Figure 15: Global Market Attractiveness Analysis by End Use
  • Figure 16: Global Market Value (USD Billion) Share and BPS Analysis by Region, 2025 and 2035
  • Figure 17: Global Market Y-o-Y Growth Comparison by Region, 2025 to 2035
  • Figure 18: Global Market Attractiveness Analysis by Region
  • Figure 19: North America Market Incremental $ Opportunity, 2025 to 2035
  • Figure 20: Latin America Market Incremental $ Opportunity, 2025 to 2035
  • Figure 21: Western Europe Market Incremental $ Opportunity, 2025 to 2035
  • Figure 22: Eastern Europe Market Incremental $ Opportunity, 2025 to 2035
  • Figure 23: East Asia Market Incremental $ Opportunity, 2025 to 2035
  • Figure 24: South Asia & Pacific Market Incremental $ Opportunity, 2025 to 2035
  • Figure 25: Middle East and Africa Market Incremental $ Opportunity, 2025 to 2035
  • Figure 26: North America Market Value Share and BPS Analysis by Country, 2025 and 2035
  • Figure 27: North America Market Value Share and BPS Analysis by Nature, 2025 and 2035
  • Figure 28: North America Market Y-o-Y Growth Comparison by Nature, 2025 to 2035
  • Figure 29: North America Market Attractiveness Analysis by Nature
  • Figure 30: North America Market Value Share and BPS Analysis by Form, 2025 and 2035
  • Figure 31: North America Market Y-o-Y Growth Comparison by Form, 2025 to 2035
  • Figure 32: North America Market Attractiveness Analysis by Form
  • Figure 33: North America Market Value Share and BPS Analysis by Source, 2025 and 2035
  • Figure 34: North America Market Y-o-Y Growth Comparison by Source, 2025 to 2035
  • Figure 35: North America Market Attractiveness Analysis by Source
  • Figure 36: North America Market Value Share and BPS Analysis by End Use, 2025 and 2035
  • Figure 37: North America Market Y-o-Y Growth Comparison by End Use, 2025 to 2035
  • Figure 38: North America Market Attractiveness Analysis by End Use
  • Figure 39: Latin America Market Value Share and BPS Analysis by Country, 2025 and 2035
  • Figure 40: Latin America Market Value Share and BPS Analysis by Nature, 2025 and 2035
  • Figure 41: Latin America Market Y-o-Y Growth Comparison by Nature, 2025 to 2035
  • Figure 42: Latin America Market Attractiveness Analysis by Nature
  • Figure 43: Latin America Market Value Share and BPS Analysis by Form, 2025 and 2035
  • Figure 44: Latin America Market Y-o-Y Growth Comparison by Form, 2025 to 2035
  • Figure 45: Latin America Market Attractiveness Analysis by Form
  • Figure 46: Latin America Market Value Share and BPS Analysis by Source, 2025 and 2035
  • Figure 47: Latin America Market Y-o-Y Growth Comparison by Source, 2025 to 2035
  • Figure 48: Latin America Market Attractiveness Analysis by Source
  • Figure 49: Latin America Market Value Share and BPS Analysis by End Use, 2025 and 2035
  • Figure 50: Latin America Market Y-o-Y Growth Comparison by End Use, 2025 to 2035
  • Figure 51: Latin America Market Attractiveness Analysis by End Use
  • Figure 52: Western Europe Market Value Share and BPS Analysis by Country, 2025 and 2035
  • Figure 53: Western Europe Market Value Share and BPS Analysis by Nature, 2025 and 2035
  • Figure 54: Western Europe Market Y-o-Y Growth Comparison by Nature, 2025 to 2035
  • Figure 55: Western Europe Market Attractiveness Analysis by Nature
  • Figure 56: Western Europe Market Value Share and BPS Analysis by Form, 2025 and 2035
  • Figure 57: Western Europe Market Y-o-Y Growth Comparison by Form, 2025 to 2035
  • Figure 58: Western Europe Market Attractiveness Analysis by Form
  • Figure 59: Western Europe Market Value Share and BPS Analysis by Source, 2025 and 2035
  • Figure 60: Western Europe Market Y-o-Y Growth Comparison by Source, 2025 to 2035
  • Figure 61: Western Europe Market Attractiveness Analysis by Source
  • Figure 62: Western Europe Market Value Share and BPS Analysis by End Use, 2025 and 2035
  • Figure 63: Western Europe Market Y-o-Y Growth Comparison by End Use, 2025 to 2035
  • Figure 64: Western Europe Market Attractiveness Analysis by End Use
  • Figure 65: Eastern Europe Market Value Share and BPS Analysis by Country, 2025 and 2035
  • Figure 66: Eastern Europe Market Value Share and BPS Analysis by Nature, 2025 and 2035
  • Figure 67: Eastern Europe Market Y-o-Y Growth Comparison by Nature, 2025 to 2035
  • Figure 68: Eastern Europe Market Attractiveness Analysis by Nature
  • Figure 69: Eastern Europe Market Value Share and BPS Analysis by Form, 2025 and 2035
  • Figure 70: Eastern Europe Market Y-o-Y Growth Comparison by Form, 2025 to 2035
  • Figure 71: Eastern Europe Market Attractiveness Analysis by Form
  • Figure 72: Eastern Europe Market Value Share and BPS Analysis by Source, 2025 and 2035
  • Figure 73: Eastern Europe Market Y-o-Y Growth Comparison by Source, 2025 to 2035
  • Figure 74: Eastern Europe Market Attractiveness Analysis by Source
  • Figure 75: Eastern Europe Market Value Share and BPS Analysis by End Use, 2025 and 2035
  • Figure 76: Eastern Europe Market Y-o-Y Growth Comparison by End Use, 2025 to 2035
  • Figure 77: Eastern Europe Market Attractiveness Analysis by End Use
  • Figure 78: East Asia Market Value Share and BPS Analysis by Country, 2025 and 2035
  • Figure 79: East Asia Market Value Share and BPS Analysis by Nature, 2025 and 2035
  • Figure 80: East Asia Market Y-o-Y Growth Comparison by Nature, 2025 to 2035
  • Figure 81: East Asia Market Attractiveness Analysis by Nature
  • Figure 82: East Asia Market Value Share and BPS Analysis by Form, 2025 and 2035
  • Figure 83: East Asia Market Y-o-Y Growth Comparison by Form, 2025 to 2035
  • Figure 84: East Asia Market Attractiveness Analysis by Form
  • Figure 85: East Asia Market Value Share and BPS Analysis by Source, 2025 and 2035
  • Figure 86: East Asia Market Y-o-Y Growth Comparison by Source, 2025 to 2035
  • Figure 87: East Asia Market Attractiveness Analysis by Source
  • Figure 88: East Asia Market Value Share and BPS Analysis by End Use, 2025 and 2035
  • Figure 89: East Asia Market Y-o-Y Growth Comparison by End Use, 2025 to 2035
  • Figure 90: East Asia Market Attractiveness Analysis by End Use
  • Figure 91: South Asia & Pacific Market Value Share and BPS Analysis by Country, 2025 and 2035
  • Figure 92: South Asia & Pacific Market Value Share and BPS Analysis by Nature, 2025 and 2035
  • Figure 93: South Asia & Pacific Market Y-o-Y Growth Comparison by Nature, 2025 to 2035
  • Figure 94: South Asia & Pacific Market Attractiveness Analysis by Nature
  • Figure 95: South Asia & Pacific Market Value Share and BPS Analysis by Form, 2025 and 2035
  • Figure 96: South Asia & Pacific Market Y-o-Y Growth Comparison by Form, 2025 to 2035
  • Figure 97: South Asia & Pacific Market Attractiveness Analysis by Form
  • Figure 98: South Asia & Pacific Market Value Share and BPS Analysis by Source, 2025 and 2035
  • Figure 99: South Asia & Pacific Market Y-o-Y Growth Comparison by Source, 2025 to 2035
  • Figure 100: South Asia & Pacific Market Attractiveness Analysis by Source
  • Figure 101: South Asia & Pacific Market Value Share and BPS Analysis by End Use, 2025 and 2035
  • Figure 102: South Asia & Pacific Market Y-o-Y Growth Comparison by End Use, 2025 to 2035
  • Figure 103: South Asia & Pacific Market Attractiveness Analysis by End Use
  • Figure 104: Middle East and Africa Market Value Share and BPS Analysis by Country, 2025 and 2035
  • Figure 105: Middle East and Africa Market Value Share and BPS Analysis by Nature, 2025 and 2035
  • Figure 106: Middle East and Africa Market Y-o-Y Growth Comparison by Nature, 2025 to 2035
  • Figure 107: Middle East and Africa Market Attractiveness Analysis by Nature
  • Figure 108: Middle East and Africa Market Value Share and BPS Analysis by Form, 2025 and 2035
  • Figure 109: Middle East and Africa Market Y-o-Y Growth Comparison by Form, 2025 to 2035
  • Figure 110: Middle East and Africa Market Attractiveness Analysis by Form
  • Figure 111: Middle East and Africa Market Value Share and BPS Analysis by Source, 2025 and 2035
  • Figure 112: Middle East and Africa Market Y-o-Y Growth Comparison by Source, 2025 to 2035
  • Figure 113: Middle East and Africa Market Attractiveness Analysis by Source
  • Figure 114: Middle East and Africa Market Value Share and BPS Analysis by End Use, 2025 and 2035
  • Figure 115: Middle East and Africa Market Y-o-Y Growth Comparison by End Use, 2025 to 2035
  • Figure 116: Middle East and Africa Market Attractiveness Analysis by End Use
  • Figure 117: Global Market - Tier Structure Analysis
  • Figure 118: Global Market - Company Share Analysis

Frequently Asked Questions

How big is the lupine peptides market in 2025?

The global market is estimated to be valued at USD 1.1 billion in 2025.

What will be the size of lupine peptides market in 2035?

The market size for the market is projected to reach USD 1.8 billion by 2035.

How much will be the lupine peptides market growth between 2025 and 2035?

The market is expected to grow at a 5.0% CAGR between 2025 and 2035.

Which end-use segment is expected to contribute a significant share in the lupine peptides market in 2025?

In terms of end use, the cosmetics and personal care segment is projected to hold a 52.8% share of the market in 2025.

What is the expected revenue contribution of the powder form segment in the lupine peptides market by 2025?

By 2025, the powder form segment is expected to account for 68% of the market share, driven by its stability, versatility, and preference in nutraceutical and cosmetic applications.

Explore Similar Insights

Future Market Insights

Lupine Peptides Market