Vegan Collagen Peptides Market Size and Share Forecast Outlook 2025 to 2035

The global vegan collagen peptides market is expected to record a valuation of USD 2,253.6 million in 2025 and USD 7,102.5 million in 2035, with an increase of USD 4,848.9 million, which equals a growth of more than 193% over the decade. The overall expansion represents a CAGR of 12.2% and a more than 3X increase in market size.
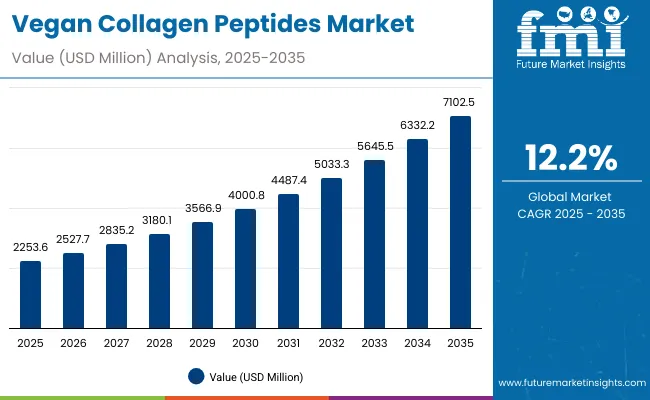
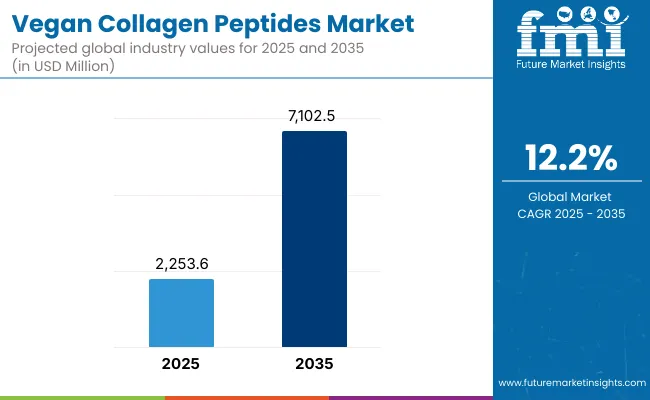
Vegan Collagen Peptides Market Value Analysis

Quick Stats for Global Vegan Collagen Peptides Market

  • Global Vegan Collagen Peptides Market Value (2025): USD 2,253.6 million
  • Global Vegan Collagen Peptides Market Forecast Value (2035): USD 7,102.5 million
  • Global Vegan Collagen Peptides Market Forecast CAGR: 12.2%
  • Leading Segment in Global Vegan Collagen Peptides Market in 2025: Serums (48.5%) and Anti-aging function (53.5%)
  • Key Growth Regions in the Global Vegan Collagen Peptides Market: Asia-Pacific (China, India, Japan), North America (USA), and Europe (UK, Germany)
  • Top Key Players in Global Vegan Collagen Peptides Market: Geltor, Evonik, Croda, Ashland, DSM-Firmenich, Amyris, BASF, Lubrizol, Roquette, Givaudan

Vegan Collagen Peptides Market

Global Vegan Collagen Peptides Market Key Takeaways

Metric Value
Global Vegan Collagen Peptides Market Estimated Value in (2025E) USD 2,253.6 million
Global Vegan Collagen Peptides Market Forecast Value in (2035F) USD 7,102.5 million
Forecast CAGR (2025 to 2035) 12.2%

During the first five-year period from 2025 to 2030, the market increases from USD 2,253.6 million to USD 4,000.8 million, adding USD 1,747.2 million, which accounts for around 36% of the total decade growth. This phase records steady adoption in anti-aging skincare, masstige-tier beauty products, and wellness-focused capsules and powders, driven by demand for cruelty-free alternatives to animal collagen. Serums dominate this period as they cater to over 48% of product demand, particularly in beauty and dermatology applications where quick absorption and targeted performance are critical.

The second half from 2030 to 2035 contributes USD 3,101.7 million, equal to nearly 64% of total growth, as the market jumps from USD 4,000.8 million to USD 7,102.5 million. This acceleration is powered by widespread adoption of recombinant collagen peptides, algae-based innovations, and AI-driven personalization in direct-to-consumer (D2C) brand offerings.

Plant-based peptide formulations gain stronger regulatory acceptance, while premium-tier skincare and ingestibles capture rising consumer spending. By the end of the decade, e-commerce and D2C together account for the majority of channel value. Cloud-enabled traceability and biotech-driven fermentation methods also scale, enhancing transparency and sustainable positioning.

From 2020 to 2024, the global vegan collagen peptides market grew rapidly as biotech-driven innovation shifted focus toward cruelty-free alternatives. During this period, the competitive landscape was dominated by biotech manufacturers and ingredient suppliers controlling nearly all revenue, with leaders such as Geltor and DSM-Firmenich focusing on precision fermentation platforms. Competitive differentiation relied on purity, sustainability credentials, and claims such as vegan-certified and animal-free, while capsules and powders were marketed as supplements but less emphasized in premium skincare.

Demand for vegan collagen peptides will expand to USD 2,253.6 million in 2025, and the revenue mix will shift as skincare and wellness converge. Traditional biotech leaders face rising competition from cosmetic giants integrating vegan peptides into serums and creams. Major suppliers are pivoting to hybrid models, offering both B2B supply of raw peptides and branded B2C launches.

New entrants specializing in algae-based and recombinant platforms are gaining traction, and the competitive advantage is moving away from biotech process alone to ecosystem partnerships, brand trust, and regulatory approvals.

Why the Global Vegan Collagen Peptides Market is Growing?

Advances in fermentation-derived biotech have improved purity, scalability, and affordability of vegan collagen peptides, allowing broader use across skincare, nutraceuticals, and healthcare applications. Anti-aging formulations have gained popularity due to their suitability for improving elasticity and wrinkle reduction without animal-derived collagen.

The rise of recombinant and algae-based technologies has contributed to enhanced functional properties and sustainable sourcing. Industries such as cosmetics, dermatology, and functional nutrition are driving demand for solutions that integrate seamlessly into existing product lines.

Expansion of D2C brands, masstige-tier skincare, and premium vegan beauty offerings has fueled market growth. Innovations in serums and capsules, alongside e-commerce and subscription-based retail models, are expected to open new application areas. Segment growth is expected to be led by anti-aging function, serums in product types, and masstige tier offerings, due to their precision, adaptability, and balance of affordability with luxury appeal.

Segmental Analysis

The market is segmented by source, function, product type, channel, tier, and region. Sources include fermentation-derived, plant peptides, algae-based, and recombinant, highlighting the diverse biotech pathways driving adoption. Function classification covers anti-aging, firming/elasticity, wound repair, and hydration to cater to varied consumer needs. Based on product type, the segmentation includes serums, creams/lotions, masks, and capsules/powders, which together define both skincare and ingestible applications.

In terms of channel, categories encompass e-commerce, D2C brands, specialty retail, and pharmacies, aligning with consumer access preferences. Tier segmentation spans mass, masstige, and premium, illustrating the market’s evolution across affordability and positioning. Regionally, the scope spans North America, Europe, Asia-Pacific, Latin America, and Middle East & Africa, with key countries such as USA, China, India, Japan, UK, and Germany leading growth.
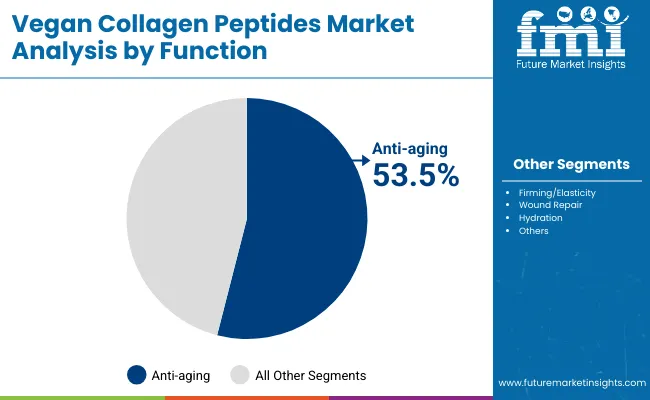
Insights into the Function Segment with Anti-aging Leading in Market Share

Vegan Collagen Peptides Market By Function

Function Value Share % 2025
Anti-aging 53.5%
Others 46.5%

The anti-aging segment is projected to contribute over USD 1,204.4 million in 2025, maintaining its lead as the dominant functional category. This is driven by ongoing consumer demand for wrinkle reduction, elasticity improvement, and preventative skincare in both mass and premium categories. The segment’s growth is also supported by its adoption in capsules and powders as consumers increasingly view anti-aging as both a topical and ingestible solution.
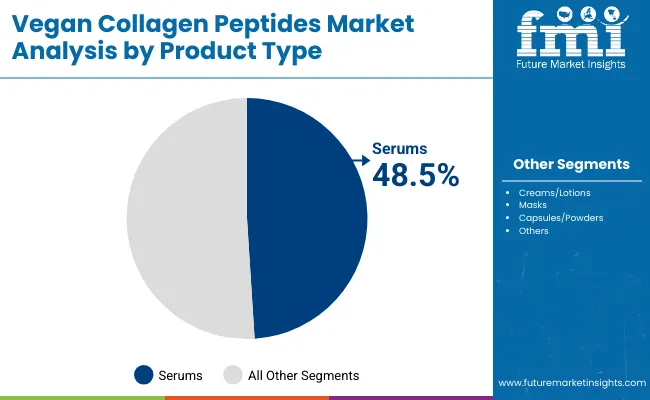
Insights into the Product Type Segment with Serums Dominating the Demand

Vegan Collagen Peptides Market By Prodct Type

Product Type Value Share % 2025
Serums 48.5%
Others 51.5%

The serums segment is forecasted to hold nearly USD 1,090.9 million in 2025, led by its application in targeted skincare. Serums are favored for their high concentration of active peptides and ability to deliver quick results, making them ideal for premium and masstige-tier positioning. Their lightweight format and efficacy-driven marketing have facilitated widespread adoption in online and specialty retail channels.
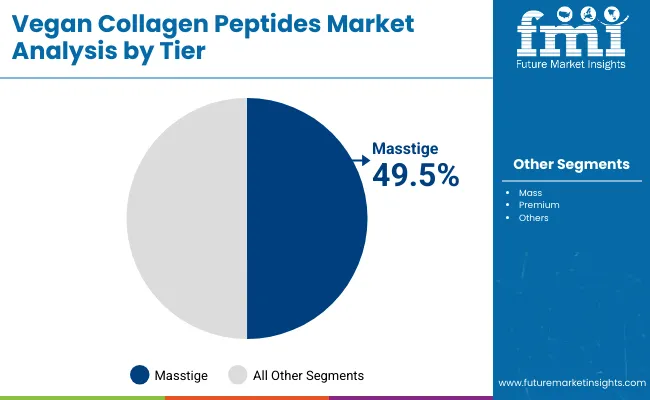
Insights into the Tier Segment with Masstige Capturing the Mid-Market

Vegan Collagen Peptides Market By Tier

Tier Value Share % 2025
Masstige 49.5%
Others 50.5%

The masstige tier is projected to account for USD 1,114.1 million in 2025, striking a balance between affordability and aspirational branding. This segment caters to a wide consumer base seeking cruelty-free, effective vegan collagen without premium-level pricing. Growth is fueled by the rise of D2C labels and celebrity-backed skincare lines positioning themselves in this bracket.

What are the Drivers, Restraints, and Key Trends of the Global Vegan Collagen Peptides Market?

Drivers

Rising Consumer Shift Toward Vegan and Animal-Free Alternatives

One of the strongest drivers is the consumer rejection of animal-derived collagen due to ethical, environmental, and religious concerns. Millennials and Gen Z, who dominate beauty and wellness consumption, are increasingly vocal about cruelty-free, clean-label choices.

Traditional bovine and marine collagen markets face scrutiny because of animal-sourcing practices, creating a direct pull for biotech-driven vegan collagen peptides. In markets like the USA and Europe, ethical consumerism is reshaping skincare and nutraceutical categories, while in China and India, the preference aligns with cultural sensitivities around animal products. This shift ensures a consistent demand base for vegan peptides, especially in anti-aging serums and ingestible powders.

Biotech Advancements in Fermentation and Recombinant Production

A second critical driver is the scalability of fermentation-derived and recombinant collagen peptides. Companies like Geltor, DSM-Firmenich, and Evonik are not only improving yields but also enabling custom-designed collagen sequences that mimic or even outperform animal collagen in elasticity and hydration. These advancements reduce costs, enhance purity, and improve consistency compared to natural sources.

As costs decline with economies of scale, biotech collagen becomes accessible to both premium-tier brands and masstige D2C labels, fueling growth in skincare and wellness markets. The ability to design collagen with targeted bioactivity (for wound repair, hydration, elasticity) offers brands a strong differentiation strategy.

Restraints

High Production Costs and Price Sensitivity in Mass Market

Despite strong demand, production costs remain significantly higher than traditional bovine or marine collagen. Fermentation and recombinant platforms require specialized facilities, high R&D investment, and strict regulatory compliance. This translates into premium product pricing, limiting accessibility in mass-market channels.

In countries like India and Southeast Asia, where affordability heavily influences buying decisions, penetration of vegan collagen peptides in everyday skincare remains low. This could delay adoption outside premium and masstige categories, especially for ingestible powders where alternatives are priced more competitively.

Limited Clinical Evidence Compared to Traditional Collagen

Another restraint lies in the comparatively limited clinical validation of vegan collagen peptides. While animal-based collagen has decades of published studies linking ingestion to skin, joint, and hair benefits, vegan versions are newer to the market.

Regulatory agencies, dermatologists, and even cautious consumers may hesitate until larger-scale, peer-reviewed human trials demonstrate equal or superior efficacy. This evidence gap slows acceptance in pharmacies and clinical-grade skincare lines, restraining growth in the short to mid-term, especially in regions like Europe where clinical substantiation is critical for consumer trust.

Key Trends

E-commerce and D2C Brands as Primary Growth Channels

The market is rapidly shifting toward online-first distribution. In 2025, e-commerce already represents nearly half of channel value, and D2C brands are scaling quickly. This trend is fueled by younger consumers who prefer subscription-based skincare and wellness solutions, often bundled with personalized recommendations.

In China, platforms like Tmall and Douyin are amplifying vegan collagen launches, while in the USA and Europe, indie D2C brands use social media and influencer campaigns to promote clean-label peptides. Over the next decade, subscription and refill models are expected to dominate, reducing reliance on traditional specialty retail.

Cross-Over of Skincare and Ingestible Collagen Solutions

A defining trend is the convergence of beauty-from-within and topical applications. Serums dominate today with nearly 48.5% market share, but capsules and powders are catching up, driven by consumer belief in holistic skin health. Brands are launching dual-format offerings (e.g., serum + powder kits) marketed as complete anti-aging solutions.

This cross-over trend is especially visible in Japan and Korea, where functional foods and nutricosmetics are culturally ingrained, and it is now spreading into Western markets. By 2035, ingestibles are projected to capture a much higher share, expanding beyond beauty into joint repair, post-surgery wound healing, and hydration supplements.
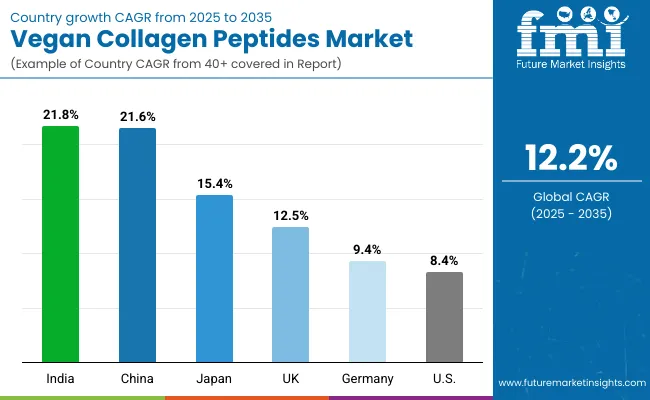
Analysis of Global Vegan Collagen Peptides MarketBy Key Countries

Vegan Collagen Peptides Market Country Wise Analysis

Country Estimated CAGR (2025 to 2035)
China 21.6%
USA 8.4%
India 21.8%
UK 12.5%
Germany 9.4%
Japan 15.4%

The country-wise CAGR analysis for the global vegan collagen peptides market (2025 to 2035) highlights a clear divide between emerging Asia-Pacific economies and mature Western markets. India (21.8%) and China (21.6%) are expected to record the highest growth rates, driven by rising middle-class consumer bases, cultural preference for plant-based and vegetarian solutions, and rapid expansion of e-commerce platforms that allow D2C beauty and wellness brands to scale quickly.

In these markets, affordability in the masstige tier will be critical, with consumers showing strong willingness to experiment with cruelty-free, anti-aging serums and functional powders. Japan (15.4%) follows as another high-growth market, where nutricosmetics and beauty-from-within products are deeply entrenched, and biotech-driven collagen aligns well with the country’s focus on advanced functional skincare and holistic health.

In contrast, Western markets show moderate yet steady growth trajectories. The USA (8.4%) is already the largest market in absolute value, where adoption is led by anti-aging and premium serums, supported by clinical positioning and dermatology-backed branding. However, saturation of the beauty market and price sensitivity in mass categories temper growth compared to Asia.

The UK (12.5%) and Germany (9.4%) reflect strong European interest in sustainable, vegan-certified skincare, but regulatory scrutiny and slower expansion of ingestibles hold back higher CAGR levels. Collectively, this country-level data suggests that Asia-Pacific will be the engine of growth, while North America and Europe will continue to anchor the market with size and stability, especially in premium and clinically validated product formats.
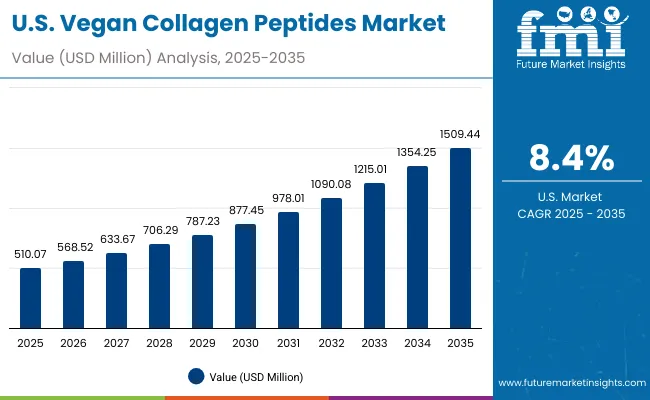
Sales Outlook for Vegan Collagen Peptides in the United States

Usa Vegan Collagen Peptides Market

Year USA Vegan Collagen Peptides Market (USD Million)
2025 510.1
2026 568.5
2027 633.7
2028 706.3
2029 787.2
2030 877.4
2031 978.0
2032 1090.1
2033 1215.0
2034 1354.2
2035 1509.4

The vegan collagen peptides market in the United States is projected to grow at a CAGR of 8.4%, led by the rising demand for anti-aging serums and premium skincare formats. Functional ingestibles such as capsules and powders are also gaining popularity, particularly in the wellness and nutricosmetics space. Dermatology clinics and pharmacies have increasingly introduced vegan-certified options, reflecting higher consumer trust in animal-free peptides.

Growth is further accelerated by the expansion of D2C brands and the strong role of online subscription platforms. High clinical validation requirements in the USA also position biotechnology-driven collagen as a premium, science-backed solution.

  • Anti-aging serums are leading the market, supported by strong consumer focus on wrinkle reduction and elasticity.
  • Capsules and powders are rising in pharmacies and wellness retail, combining topical and ingestible routines.
  • D2C subscription brands are reshaping distribution with recurring revenue models.

Growth and Expansion Outlook for Vegan Collagen Peptides in the United Kingdom

The vegan collagen peptides market in the United Kingdom is expected to grow at a CAGR of 12.5%, supported by applications across skincare, wellness, and nutricosmetics. Clean-label and sustainable positioning play a decisive role in consumer adoption, with masstige-tier skincare brands capturing significant traction.

Heritage beauty retailers and e-commerce platforms are expanding offerings of vegan-certified serums and creams. In addition, ingestible powders are marketed as part of holistic beauty-from-within regimes. Government-backed sustainability commitments, coupled with strong regulatory frameworks on ingredient labeling, continue to drive adoption and consumer trust.

  • Masstige-tier beauty brands are expanding vegan collagen-based serums in skincare ranges.
  • Retailers are promoting ingestible powders as beauty-from-within solutions.
  • Strict EU/UK labeling rules boost consumer trust in vegan-certified peptides.

Growth and Expansion Outlook for Vegan Collagen Peptides in India

India is witnessing rapid growth in the vegan collagen peptides market, forecast to expand at a CAGR of 21.8% through 2035. Rising disposable incomes and the growing preference for plant-based solutions are driving demand in both tier-1 and tier-2 cities. Affordable masstige skincare, supported by e-commerce and D2C channels, has accelerated adoption.

Ayurvedic and herbal beauty brands are integrating vegan peptides into anti-aging serums and hydration products, aligning with cultural acceptance of natural solutions. Educational outreach and influencer-driven marketing are further boosting awareness of vegan collagen as a safe, ethical, and effective alternative.

  • Masstige skincare products dominate, particularly among urban millennials.
  • Ayurvedic and herbal players are integrating vegan peptides into traditional beauty regimes.
  • E-commerce and influencer-led D2C launches drive strong adoption across cities.

Sales Outlook for Vegan Collagen Peptides in China

The vegan collagen peptides market in China is expected to grow at a CAGR of 21.6%, the highest among leading economies. This momentum is driven by biotech innovation, masstige-tier launches, and strong uptake of ingestible collagen supplements. Local brands are aggressively rolling out vegan collagen capsules and powders through Tmall, Douyin, and JD.com, enabling mass consumer access.

Municipal wellness initiatives and younger consumer preferences for sustainable products further enhance growth. Competitive pricing from domestic biotech firms is supporting expansion across skincare, wellness, and e-commerce sectors, creating a powerful base for long-term growth.
  • E-commerce platforms such as Tmall and Douyin dominate vegan collagen distribution.
  • Domestic biotech firms offer affordable capsules and powders, boosting accessibility.
  • Younger consumers are fueling rapid uptake of anti-aging and hydration-focused peptides.

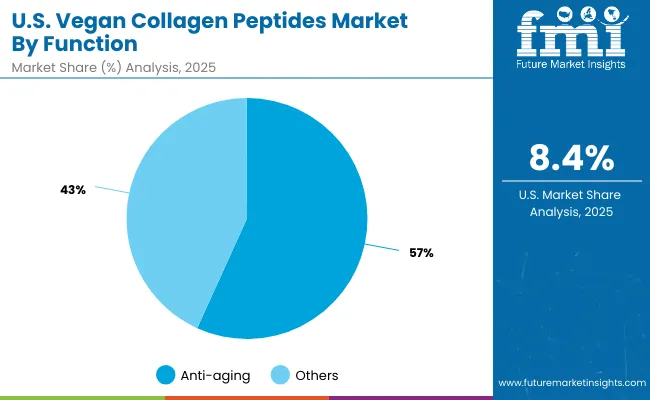
Opportunity Analysis of USA Vegan Collagen Peptides Market

Usa Vegan Collagen Peptides Market By Function

USA by Function Value Share % 2025
Anti-aging 56.8%
Others 43.2%

The vegan collagen peptides market in the USA is valued at USD 510.1 million in 2025, with anti-aging applications leading at 56.8%, translating to a market value of USD 290 million. This dominance reflects the maturity of the USA skincare sector, where anti-aging products are positioned as essential across both premium and masstige categories.

Dermatology-backed brands are actively integrating vegan-certified collagen into serums, supported by claims of elasticity restoration and wrinkle reduction. Ingestible capsules and powders are gaining traction, particularly in wellness and pharmacy retail, but topical anti-aging formulations remain the anchor of the market.

The strength of anti-aging formats in the USA positions this segment as a foundation for innovation, with biotech-derived vegan collagen peptides offering enhanced purity and consistent efficacy compared to animal-based collagen. E-commerce-driven D2C models, coupled with influencer endorsements, continue to amplify awareness. While hydration and wound repair functions contribute to the overall growth, their value remains secondary to anti-aging in the USA market landscape.
  • Market size for the USA in 2025 is USD 510.1 million
  • Global market share is approximately 22.6%
  • Anti-aging leads at 56.8%, driven by dermatology and premium skincare demand

Opportunity Analysis of China Vegan Collagen Peptides Market

China Vegan Collagen Peptides Market By Tier

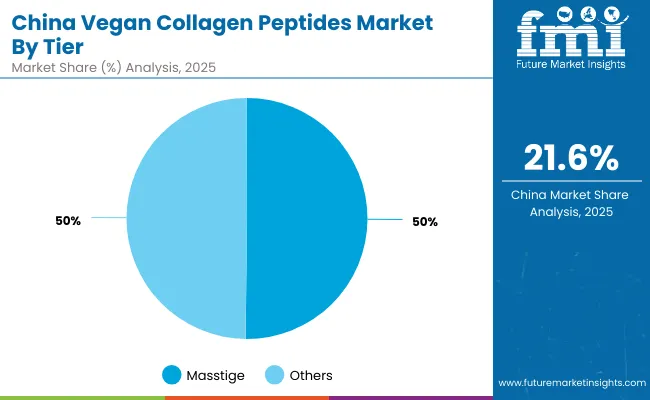
China by Tier Value Share % 2025
Masstige 50.2%
Others 49.8%

The vegan collagen peptides market in China is valued at USD 278.9 million in 2025, with the masstige tier leading at 50.2%, representing USD 140 million in sales. This leadership is closely tied to China’s consumer demographics, where younger, urban middle-class buyers prioritize affordable yet aspirational beauty solutions. Masstige-positioned brands dominate on Tmall, JD.com, and Douyin, offering vegan collagen serums and ingestibles at accessible price points.

The dominance of masstige reflects China’s e-commerce-driven retail ecosystem, where celebrity-endorsed and influencer-led campaigns rapidly scale new product formats. Premium-tier adoption is increasing, especially in tier-1 cities, but the wider middle-income consumer base ensures masstige retains majority share. By 2035, recombinant and algae-based vegan collagen formats are expected to accelerate uptake further, particularly in ingestible powders marketed for beauty-from-within and hydration.
  • Market size for China in 2025 is USD 278.9 million
  • Global market share is approximately 12.4%
  • Masstige leads at 50.2%, reflecting aspirational yet affordable positioning

Competitive Landscape of Global Vegan Collagen Peptides Market

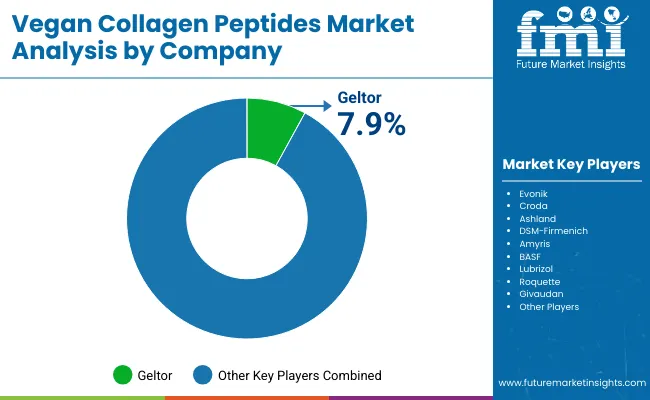
Vegan Collagen Peptides Market By Company

Company Global Value Share 2025
Geltor 7.9%
Others 92.1%

The global vegan collagen peptides market is moderately fragmented, with biotech pioneers, chemical giants, and specialty ingredient suppliers competing across skincare and wellness categories. Leading players such as Geltor, DSM-Firmenich, Evonik, and Croda hold notable market positions, driven by their capabilities in precision fermentation, recombinant technology, and scalable peptide production.

Their strategies emphasize clinical validation, sustainability certification, and integration into both B2B ingredient supply and B2C skincare brands.Established chemical majors, including BASF, Ashland, Lubrizol, and Givaudan, cater to the cosmetics and personal care sectors by supplying versatile collagen peptide formulations for creams, lotions, and serums. These companies leverage strong downstream partnerships with global cosmetic brands, enabling rapid commercialization across both premium and masstige tiers.

Specialized biotech innovators such as Amyris and Roquette focus on plant- and algae-derived peptide platforms, targeting wellness supplements and vegan ingestible formats. Their strength lies in customization and the ability to serve niche applications like hydration capsules and wound repair formulations.

Competitive differentiation is shifting away from traditional collagen claims toward holistic ecosystems that include sustainability positioning, AR/VR-enabled consumer education, subscription-based D2C skincare bundles, and cross-category offerings that combine topical and ingestible collagen.

Scope of the Report

Item Value
Quantitative Units USD USD 2,253.6 million
Component Hardware, 3D Scanners, Accessories, and Software
Range Short-range scanners, Medium-range scanners, and Long-range scanners
Technology Laser triangulation, Time-of-Flight ( ToF ), Structured light, Photogrammetry, and Laser pulse
Type Laser scanners, Handheld, Stationary, Mobile, Structured light scanners, Optical scanners, Contact scanners, and Non-contact scanners
End-use Industry Automotive, Aerospace & defense, Consumer electronics, Healthcare, Oil & gas, Energy and power, and Others
Regions Covered North America, Europe, Asia-Pacific, Latin America, Middle East & Africa
Country Covered United States, Canada, Germany, France, United Kingdom, China, Japan, India, Brazil, South Africa
Key Companies Profiled FARO Technologies, Inc., 3D Digital Corporation, 3D Systems, Inc., Autodesk, Inc., Artec 3D, Automated Precision, Inc. (API), Carl Zeiss Optotechnik GmbH, Creaform Inc., Direct Dimensions Inc., GOM GmbH, Hexagon AB, Konica Minolta, Inc., NextEngine Inc., Nikon Corporation, OGI Systems Ltd, and ShapeGrabber
Additional Attributes Dollar sales by scanner type and end-use industry, adoption trends in reverse engineering and quality control, rising demand for handheld and portable 3D scanners, sector-specific growth in aerospace, automotive, and healthcare, software and services revenue segmentation, integration with AR/VR and digital twin technologies, regional trends influenced by digitization initiatives, and innovations in laser triangulation, structured light, and photogrammetry methods.

Key Segments

By Function:

  • Firming/elasticity
  • Wound repair
  • Hydration
  • Anti-aging

By Product Type:

  • Serums
  • Creams & lotions
  • Oils
  • Masks

By Channel:

  • E-commerce
  • Pharmacies
  • Mass retail
  • Specialty retail

By Source:

  • Fermentation-derived
  • Plant peptides
  • Algae-based
  • Recombinant

By Tier:

  • Mass
  • Masstige
  • Premium

By Region:

  • North America
  • Latin America
  • Europe
  • East Asia
  • South Asia & Pacific
  • Middle East and Africa

Table of Content

  1. Executive Summary
    • Global Market Outlook
    • Demand-side Trends
    • Supply-side Trends
    • Technology Roadmap Analysis
    • Analysis and Recommendations
  2. Market Overview
    • Market Coverage / Taxonomy
    • Market Definition / Scope / Limitations
  3. Market Background
    • Market Dynamics
      • Drivers
      • Restraints
      • Opportunity
      • Trends
    • Scenario Forecast
      • Demand in Optimistic Scenario
      • Demand in Likely Scenario
      • Demand in Conservative Scenario
    • Opportunity Map Analysis
    • Product Life Cycle Analysis
    • Supply Chain Analysis
      • Supply Side Participants and their Roles
        • Producers
        • Mid-Level Participants (Traders/ Agents/ Brokers)
        • Wholesalers and Distributors
      • Value Added and Value Created at Node in the Supply Chain
      • List of Raw Material Suppliers
      • List of Existing and Potential Buyer’s
    • Investment Feasibility Matrix
    • Value Chain Analysis
      • Profit Margin Analysis
      • Wholesalers and Distributors
      • Retailers
    • PESTLE and Porter’s Analysis
    • Regulatory Landscape
      • By Key Regions
      • By Key Countries
    • Regional Parent Market Outlook
    • Production and Consumption Statistics
    • Import and Export Statistics
  4. Global Market Analysis 2020 to 2024 and Forecast, 2025 to 2035
    • Historical Market Size Value (USD Million) & Volume (Units) Analysis, 2020 to 2024
    • Current and Future Market Size Value (USD Million) & Volume (Units) Projections, 2025 to 2035
      • Y-o-Y Growth Trend Analysis
      • Absolute $ Opportunity Analysis
  5. Global Market Analysis 2020 to 2024 and Forecast 2025 to 2035, By Function
    • Introduction / Key Findings
    • Historical Market Size Value (USD Million) & Volume (Units) Analysis By Function, 2020 to 2024
    • Current and Future Market Size Value (USD Million) & Volume (Units) Analysis and Forecast By Function, 2025 to 2035
      • Firming/elasticity
      • Wound repair
      • Hydration
      • Anti-aging
    • Y-o-Y Growth Trend Analysis By Function, 2020 to 2024
    • Absolute $ Opportunity Analysis By Function, 2025 to 2035
  6. Global Market Analysis 2020 to 2024 and Forecast 2025 to 2035, By Product Type
    • Introduction / Key Findings
    • Historical Market Size Value (USD Million) & Volume (Units) Analysis By Product Type, 2020 to 2024
    • Current and Future Market Size Value (USD Million) & Volume (Units) Analysis and Forecast By Product Type, 2025 to 2035
      • Serums
      • Creams & lotions
      • Oils
      • Masks
    • Y-o-Y Growth Trend Analysis By Product Type, 2020 to 2024
    • Absolute $ Opportunity Analysis By Product Type, 2025 to 2035
  7. Global Market Analysis 2020 to 2024 and Forecast 2025 to 2035, By Channel
    • Introduction / Key Findings
    • Historical Market Size Value (USD Million) & Volume (Units) Analysis By Channel, 2020 to 2024
    • Current and Future Market Size Value (USD Million) & Volume (Units) Analysis and Forecast By Channel, 2025 to 2035
      • E-commerce
      • Pharmacies
      • Mass retail
      • Specialty retail
    • Y-o-Y Growth Trend Analysis By Channel, 2020 to 2024
    • Absolute $ Opportunity Analysis By Channel, 2025 to 2035
  8. Global Market Analysis 2020 to 2024 and Forecast 2025 to 2035, By Source
    • Introduction / Key Findings
    • Historical Market Size Value (USD Million) & Volume (Units) Analysis By Source, 2020 to 2024
    • Current and Future Market Size Value (USD Million) & Volume (Units) Analysis and Forecast By Source, 2025 to 2035
      • Fermentation-derived
      • Plant peptides
      • Algae-based
      • Recombinant
    • Y-o-Y Growth Trend Analysis By Source, 2020 to 2024
    • Absolute $ Opportunity Analysis By Source, 2025 to 2035
  9. Global Market Analysis 2020 to 2024 and Forecast 2025 to 2035, By Tier
    • Introduction / Key Findings
    • Historical Market Size Value (USD Million) & Volume (Units) Analysis By Tier, 2020 to 2024
    • Current and Future Market Size Value (USD Million) & Volume (Units) Analysis and Forecast By Tier, 2025 to 2035
      • Mass
      • Masstige
      • Premium
    • Y-o-Y Growth Trend Analysis By Tier, 2020 to 2024
    • Absolute $ Opportunity Analysis By Tier, 2025 to 2035
  10. Global Market Analysis 2020 to 2024 and Forecast 2025 to 2035, By Region
    • Introduction
    • Historical Market Size Value (USD Million) & Volume (Units) Analysis By Region, 2020 to 2024
    • Current Market Size Value (USD Million) & Volume (Units) Analysis and Forecast By Region, 2025 to 2035
      • North America
      • Latin America
      • Europe
      • East Asia
      • South Asia & Pacific
      • Middle East and Africa
    • Market Attractiveness Analysis By Region
  11. North America Market Analysis 2020 to 2024 and Forecast 2025 to 2035, By Country
    • Historical Market Size Value (USD Million) & Volume (Units) Trend Analysis By Market Taxonomy, 2020 to 2024
    • Market Size Value (USD Million) & Volume (Units) Forecast By Market Taxonomy, 2025 to 2035
      • By Country
        • USA
        • Canada
      • By Function
      • By Product Type
      • By Channel
      • By Source
      • By Tier
    • Market Attractiveness Analysis
      • By Country
      • By Function
      • By Product Type
      • By Channel
      • By Source
      • By Tier
    • Key Takeaways
  12. Latin America Market Analysis 2020 to 2024 and Forecast 2025 to 2035, By Country
    • Historical Market Size Value (USD Million) & Volume (Units) Trend Analysis By Market Taxonomy, 2020 to 2024
    • Market Size Value (USD Million) & Volume (Units) Forecast By Market Taxonomy, 2025 to 2035
      • By Country
        • Brazil
        • Mexico
        • Colombia
        • Rest of Latin America
      • By Function
      • By Product Type
      • By Channel
      • By Source
      • By Tier
    • Market Attractiveness Analysis
      • By Country
      • By Function
      • By Product Type
      • By Channel
      • By Source
      • By Tier
    • Key Takeaways
  13. Europe Market Analysis 2020 to 2024 and Forecast 2025 to 2035, By Country
    • Historical Market Size Value (USD Million) & Volume (Units) Trend Analysis By Market Taxonomy, 2020 to 2024
    • Market Size Value (USD Million) & Volume (Units) Forecast By Market Taxonomy, 2025 to 2035
      • By Country
        • Germany
        • UK
        • France
        • Italy
        • Spain
        • Belgium
        • Netherlands
        • Nordic
        • Switzerland
        • Russia
        • Poland
        • Rest of Europe
      • By Function
      • By Product Type
      • By Channel
      • By Source
      • By Tier
    • Market Attractiveness Analysis
      • By Country
      • By Function
      • By Product Type
      • By Channel
      • By Source
      • By Tier
    • Key Takeaways
  14. East Asia Market Analysis 2020 to 2024 and Forecast 2025 to 2035, By Country
    • Historical Market Size Value (USD Million) & Volume (Units) Trend Analysis By Market Taxonomy, 2020 to 2024
    • Market Size Value (USD Million) & Volume (Units) Forecast By Market Taxonomy, 2025 to 2035
      • By Country
        • China
        • Japan
        • South Korea
      • By Function
      • By Product Type
      • By Channel
      • By Source
      • By Tier
    • Market Attractiveness Analysis
      • By Country
      • By Function
      • By Product Type
      • By Channel
      • By Source
      • By Tier
    • Key Takeaways
  15. South Asia & Pacific Market Analysis 2020 to 2024 and Forecast 2025 to 2035, By Country
    • Historical Market Size Value (USD Million) & Volume (Units) Trend Analysis By Market Taxonomy, 2020 to 2024
    • Market Size Value (USD Million) & Volume (Units) Forecast By Market Taxonomy, 2025 to 2035
      • By Country
        • India
        • Thailand
        • Malaysia
        • Indonesia
        • Singapore
        • Vietnam
        • Australia
        • New Zealand
        • Rest of South Asia
      • By Function
      • By Product Type
      • By Channel
      • By Source
      • By Tier
    • Market Attractiveness Analysis
      • By Country
      • By Function
      • By Product Type
      • By Channel
      • By Source
      • By Tier
    • Key Takeaways
  16. Middle East and Africa Market Analysis 2020 to 2024 and Forecast 2025 to 2035, By Country
    • Historical Market Size Value (USD Million) & Volume (Units) Trend Analysis By Market Taxonomy, 2020 to 2024
    • Market Size Value (USD Million) & Volume (Units) Forecast By Market Taxonomy, 2025 to 2035
      • By Country
        • Turkey
        • UAE
        • Saudi Arabia
        • Israel
        • Other GCC Countries
        • North Africa
        • South Africa
      • By Function
      • By Product Type
      • By Channel
      • By Source
      • By Tier
    • Market Attractiveness Analysis
      • By Country
      • By Function
      • By Product Type
      • By Channel
      • By Source
      • By Tier
    • Key Takeaways
  17. Key Countries Market Analysis
    • USA
      • Pricing Analysis
      • Market Share Analysis, 2024
        • By Function
        • By Product Type
        • By Channel
        • By Source
        • By Tier
    • Canada
      • Pricing Analysis
      • Market Share Analysis, 2024
        • By Function
        • By Product Type
        • By Channel
        • By Source
        • By Tier
    • Brazil
      • Pricing Analysis
      • Market Share Analysis, 2024
        • By Function
        • By Product Type
        • By Channel
        • By Source
        • By Tier
    • Mexico
      • Pricing Analysis
      • Market Share Analysis, 2024
        • By Function
        • By Product Type
        • By Channel
        • By Source
        • By Tier
    • Colombia
      • Pricing Analysis
      • Market Share Analysis, 2024
        • By Function
        • By Product Type
        • By Channel
        • By Source
        • By Tier
    • Germany
      • Pricing Analysis
      • Market Share Analysis, 2024
        • By Function
        • By Product Type
        • By Channel
        • By Source
        • By Tier
    • UK
      • Pricing Analysis
      • Market Share Analysis, 2024
        • By Function
        • By Product Type
        • By Channel
        • By Source
        • By Tier
    • France
      • Pricing Analysis
      • Market Share Analysis, 2024
        • By Function
        • By Product Type
        • By Channel
        • By Source
        • By Tier
    • Italy
      • Pricing Analysis
      • Market Share Analysis, 2024
        • By Function
        • By Product Type
        • By Channel
        • By Source
        • By Tier
    • Spain
      • Pricing Analysis
      • Market Share Analysis, 2024
        • By Function
        • By Product Type
        • By Channel
        • By Source
        • By Tier
    • Belgium
      • Pricing Analysis
      • Market Share Analysis, 2024
        • By Function
        • By Product Type
        • By Channel
        • By Source
        • By Tier
    • Netherlands
      • Pricing Analysis
      • Market Share Analysis, 2024
        • By Function
        • By Product Type
        • By Channel
        • By Source
        • By Tier
    • Nordic
      • Pricing Analysis
      • Market Share Analysis, 2024
        • By Function
        • By Product Type
        • By Channel
        • By Source
        • By Tier
    • Switzerland
      • Pricing Analysis
      • Market Share Analysis, 2024
        • By Function
        • By Product Type
        • By Channel
        • By Source
        • By Tier
    • Russia
      • Pricing Analysis
      • Market Share Analysis, 2024
        • By Function
        • By Product Type
        • By Channel
        • By Source
        • By Tier
    • Poland
      • Pricing Analysis
      • Market Share Analysis, 2024
        • By Function
        • By Product Type
        • By Channel
        • By Source
        • By Tier
    • China
      • Pricing Analysis
      • Market Share Analysis, 2024
        • By Function
        • By Product Type
        • By Channel
        • By Source
        • By Tier
    • Japan
      • Pricing Analysis
      • Market Share Analysis, 2024
        • By Function
        • By Product Type
        • By Channel
        • By Source
        • By Tier
    • South Korea
      • Pricing Analysis
      • Market Share Analysis, 2024
        • By Function
        • By Product Type
        • By Channel
        • By Source
        • By Tier
    • India
      • Pricing Analysis
      • Market Share Analysis, 2024
        • By Function
        • By Product Type
        • By Channel
        • By Source
        • By Tier
    • Thailand
      • Pricing Analysis
      • Market Share Analysis, 2024
        • By Function
        • By Product Type
        • By Channel
        • By Source
        • By Tier
    • Indonesia
      • Pricing Analysis
      • Market Share Analysis, 2024
        • By Function
        • By Product Type
        • By Channel
        • By Source
        • By Tier
    • Australia
      • Pricing Analysis
      • Market Share Analysis, 2024
        • By Function
        • By Product Type
        • By Channel
        • By Source
        • By Tier
    • New Zealand
      • Pricing Analysis
      • Market Share Analysis, 2024
        • By Function
        • By Product Type
        • By Channel
        • By Source
        • By Tier
    • Turkey
      • Pricing Analysis
      • Market Share Analysis, 2024
        • By Function
        • By Product Type
        • By Channel
        • By Source
        • By Tier
    • UAE
      • Pricing Analysis
      • Market Share Analysis, 2024
        • By Function
        • By Product Type
        • By Channel
        • By Source
        • By Tier
    • Saudi Arabia
      • Pricing Analysis
      • Market Share Analysis, 2024
        • By Function
        • By Product Type
        • By Channel
        • By Source
        • By Tier
    • Israel
      • Pricing Analysis
      • Market Share Analysis, 2024
        • By Function
        • By Product Type
        • By Channel
        • By Source
        • By Tier
    • North Africa
      • Pricing Analysis
      • Market Share Analysis, 2024
        • By Function
        • By Product Type
        • By Channel
        • By Source
        • By Tier
    • South Africa
      • Pricing Analysis
      • Market Share Analysis, 2024
        • By Function
        • By Product Type
        • By Channel
        • By Source
        • By Tier
  18. Market Structure Analysis
    • Competition Dashboard
    • Competition Benchmarking
    • Market Share Analysis of Top Players
      • By Regional
      • By Function
      • By Product Type
      • By Channel
      • By Source
      • By Tier
  19. Competition Analysis
    • Competition Deep Dive
      • Geltor
        • Overview
        • Product Portfolio
        • Profitability by Market Segments (Product/Age /Sales Channel/Region)
        • Sales Footprint
        • Strategy Overview
          • Marketing Strategy
          • Product Strategy
          • Channel Strategy
      • Evonik
        • Overview
        • Product Portfolio
        • Profitability by Market Segments (Product/Age /Sales Channel/Region)
        • Sales Footprint
        • Strategy Overview
          • Marketing Strategy
          • Product Strategy
          • Channel Strategy
      • Croda
        • Overview
        • Product Portfolio
        • Profitability by Market Segments (Product/Age /Sales Channel/Region)
        • Sales Footprint
        • Strategy Overview
          • Marketing Strategy
          • Product Strategy
          • Channel Strategy
      • Ashland
        • Overview
        • Product Portfolio
        • Profitability by Market Segments (Product/Age /Sales Channel/Region)
        • Sales Footprint
        • Strategy Overview
          • Marketing Strategy
          • Product Strategy
          • Channel Strategy
      • DSM-Firmenich
        • Overview
        • Product Portfolio
        • Profitability by Market Segments (Product/Age /Sales Channel/Region)
        • Sales Footprint
        • Strategy Overview
          • Marketing Strategy
          • Product Strategy
          • Channel Strategy
      • Amyris
        • Overview
        • Product Portfolio
        • Profitability by Market Segments (Product/Age /Sales Channel/Region)
        • Sales Footprint
        • Strategy Overview
          • Marketing Strategy
          • Product Strategy
          • Channel Strategy
      • BASF
        • Overview
        • Product Portfolio
        • Profitability by Market Segments (Product/Age /Sales Channel/Region)
        • Sales Footprint
        • Strategy Overview
          • Marketing Strategy
          • Product Strategy
          • Channel Strategy
      • Lubrizol
        • Overview
        • Product Portfolio
        • Profitability by Market Segments (Product/Age /Sales Channel/Region)
        • Sales Footprint
        • Strategy Overview
          • Marketing Strategy
          • Product Strategy
          • Channel Strategy
      • Roquette
        • Overview
        • Product Portfolio
        • Profitability by Market Segments (Product/Age /Sales Channel/Region)
        • Sales Footprint
        • Strategy Overview
          • Marketing Strategy
          • Product Strategy
          • Channel Strategy
      • Givaudan
        • Overview
        • Product Portfolio
        • Profitability by Market Segments (Product/Age /Sales Channel/Region)
        • Sales Footprint
        • Strategy Overview
          • Marketing Strategy
          • Product Strategy
          • Channel Strategy
  20. Assumptions & Acronyms Used
  21. Research Methodology

List of Tables

  • Table 1: Global Market Value (USD Million) Forecast by Region, 2020-2035
  • Table 2: Global Market Volume (Units) Forecast by Region, 2020-2035
  • Table 3: Global Market Value (USD Million) Forecast by Function, 2020-2035
  • Table 4: Global Market Volume (Units) Forecast by Function, 2020-2035
  • Table 5: Global Market Value (USD Million) Forecast by Product Type, 2020-2035
  • Table 6: Global Market Volume (Units) Forecast by Product Type, 2020-2035
  • Table 7: Global Market Value (USD Million) Forecast by Channel, 2020-2035
  • Table 8: Global Market Volume (Units) Forecast by Channel, 2020-2035
  • Table 9: Global Market Value (USD Million) Forecast by Source, 2020-2035
  • Table 10: Global Market Volume (Units) Forecast by Source, 2020-2035
  • Table 11: Global Market Value (USD Million) Forecast by Tier, 2020-2035
  • Table 12: Global Market Volume (Units) Forecast by Tier, 2020-2035
  • Table 13: North America Market Value (USD Million) Forecast by Country, 2020-2035
  • Table 14: North America Market Volume (Units) Forecast by Country, 2020-2035
  • Table 15: North America Market Value (USD Million) Forecast by Function, 2020-2035
  • Table 16: North America Market Volume (Units) Forecast by Function, 2020-2035
  • Table 17: North America Market Value (USD Million) Forecast by Product Type, 2020-2035
  • Table 18: North America Market Volume (Units) Forecast by Product Type, 2020-2035
  • Table 19: North America Market Value (USD Million) Forecast by Channel, 2020-2035
  • Table 20: North America Market Volume (Units) Forecast by Channel, 2020-2035
  • Table 21: North America Market Value (USD Million) Forecast by Source, 2020-2035
  • Table 22: North America Market Volume (Units) Forecast by Source, 2020-2035
  • Table 23: North America Market Value (USD Million) Forecast by Tier, 2020-2035
  • Table 24: North America Market Volume (Units) Forecast by Tier, 2020-2035
  • Table 25: Latin America Market Value (USD Million) Forecast by Country, 2020-2035
  • Table 26: Latin America Market Volume (Units) Forecast by Country, 2020-2035
  • Table 27: Latin America Market Value (USD Million) Forecast by Function, 2020-2035
  • Table 28: Latin America Market Volume (Units) Forecast by Function, 2020-2035
  • Table 29: Latin America Market Value (USD Million) Forecast by Product Type, 2020-2035
  • Table 30: Latin America Market Volume (Units) Forecast by Product Type, 2020-2035
  • Table 31: Latin America Market Value (USD Million) Forecast by Channel, 2020-2035
  • Table 32: Latin America Market Volume (Units) Forecast by Channel, 2020-2035
  • Table 33: Latin America Market Value (USD Million) Forecast by Source, 2020-2035
  • Table 34: Latin America Market Volume (Units) Forecast by Source, 2020-2035
  • Table 35: Latin America Market Value (USD Million) Forecast by Tier, 2020-2035
  • Table 36: Latin America Market Volume (Units) Forecast by Tier, 2020-2035
  • Table 37: Europe Market Value (USD Million) Forecast by Country, 2020-2035
  • Table 38: Europe Market Volume (Units) Forecast by Country, 2020-2035
  • Table 39: Europe Market Value (USD Million) Forecast by Function, 2020-2035
  • Table 40: Europe Market Volume (Units) Forecast by Function, 2020-2035
  • Table 41: Europe Market Value (USD Million) Forecast by Product Type, 2020-2035
  • Table 42: Europe Market Volume (Units) Forecast by Product Type, 2020-2035
  • Table 43: Europe Market Value (USD Million) Forecast by Channel, 2020-2035
  • Table 44: Europe Market Volume (Units) Forecast by Channel, 2020-2035
  • Table 45: Europe Market Value (USD Million) Forecast by Source, 2020-2035
  • Table 46: Europe Market Volume (Units) Forecast by Source, 2020-2035
  • Table 47: Europe Market Value (USD Million) Forecast by Tier, 2020-2035
  • Table 48: Europe Market Volume (Units) Forecast by Tier, 2020-2035
  • Table 49: East Asia Market Value (USD Million) Forecast by Country, 2020-2035
  • Table 50: East Asia Market Volume (Units) Forecast by Country, 2020-2035
  • Table 51: East Asia Market Value (USD Million) Forecast by Function, 2020-2035
  • Table 52: East Asia Market Volume (Units) Forecast by Function, 2020-2035
  • Table 53: East Asia Market Value (USD Million) Forecast by Product Type, 2020-2035
  • Table 54: East Asia Market Volume (Units) Forecast by Product Type, 2020-2035
  • Table 55: East Asia Market Value (USD Million) Forecast by Channel, 2020-2035
  • Table 56: East Asia Market Volume (Units) Forecast by Channel, 2020-2035
  • Table 57: East Asia Market Value (USD Million) Forecast by Source, 2020-2035
  • Table 58: East Asia Market Volume (Units) Forecast by Source, 2020-2035
  • Table 59: East Asia Market Value (USD Million) Forecast by Tier, 2020-2035
  • Table 60: East Asia Market Volume (Units) Forecast by Tier, 2020-2035
  • Table 61: South Asia & Pacific Market Value (USD Million) Forecast by Country, 2020-2035
  • Table 62: South Asia & Pacific Market Volume (Units) Forecast by Country, 2020-2035
  • Table 63: South Asia & Pacific Market Value (USD Million) Forecast by Function, 2020-2035
  • Table 64: South Asia & Pacific Market Volume (Units) Forecast by Function, 2020-2035
  • Table 65: South Asia & Pacific Market Value (USD Million) Forecast by Product Type, 2020-2035
  • Table 66: South Asia & Pacific Market Volume (Units) Forecast by Product Type, 2020-2035
  • Table 67: South Asia & Pacific Market Value (USD Million) Forecast by Channel, 2020-2035
  • Table 68: South Asia & Pacific Market Volume (Units) Forecast by Channel, 2020-2035
  • Table 69: South Asia & Pacific Market Value (USD Million) Forecast by Source, 2020-2035
  • Table 70: South Asia & Pacific Market Volume (Units) Forecast by Source, 2020-2035
  • Table 71: South Asia & Pacific Market Value (USD Million) Forecast by Tier, 2020-2035
  • Table 72: South Asia & Pacific Market Volume (Units) Forecast by Tier, 2020-2035
  • Table 73: Middle East and Africa Market Value (USD Million) Forecast by Country, 2020-2035
  • Table 74: Middle East and Africa Market Volume (Units) Forecast by Country, 2020-2035
  • Table 75: Middle East and Africa Market Value (USD Million) Forecast by Function, 2020-2035
  • Table 76: Middle East and Africa Market Volume (Units) Forecast by Function, 2020-2035
  • Table 77: Middle East and Africa Market Value (USD Million) Forecast by Product Type, 2020-2035
  • Table 78: Middle East and Africa Market Volume (Units) Forecast by Product Type, 2020-2035
  • Table 79: Middle East and Africa Market Value (USD Million) Forecast by Channel, 2020-2035
  • Table 80: Middle East and Africa Market Volume (Units) Forecast by Channel, 2020-2035
  • Table 81: Middle East and Africa Market Value (USD Million) Forecast by Source, 2020-2035
  • Table 82: Middle East and Africa Market Volume (Units) Forecast by Source, 2020-2035
  • Table 83: Middle East and Africa Market Value (USD Million) Forecast by Tier, 2020-2035
  • Table 84: Middle East and Africa Market Volume (Units) Forecast by Tier, 2020-2035

List of Figures

  • Figure 1: Global Market Value (USD Million) by Function, 2025-2035
  • Figure 2: Global Market Value (USD Million) by Product Type, 2025-2035
  • Figure 3: Global Market Value (USD Million) by Channel, 2025-2035
  • Figure 4: Global Market Value (USD Million) by Source, 2025-2035
  • Figure 5: Global Market Value (USD Million) by Tier, 2025-2035
  • Figure 6: Global Market Value (USD Million) by Region, 2025-2035
  • Figure 7: Global Market Value (USD Million) Analysis by Region, 2020-2035
  • Figure 8: Global Market Volume (Units) Analysis by Region, 2020-2035
  • Figure 9: Global Market Value Share (%) and BPS Analysis by Region, 2025-2035
  • Figure 10: Global Market Y-o-Y Growth (%) Projections by Region, 2025-2035
  • Figure 11: Global Market Value (USD Million) Analysis by Function, 2020-2035
  • Figure 12: Global Market Volume (Units) Analysis by Function, 2020-2035
  • Figure 13: Global Market Value Share (%) and BPS Analysis by Function, 2025-2035
  • Figure 14: Global Market Y-o-Y Growth (%) Projections by Function, 2025-2035
  • Figure 15: Global Market Value (USD Million) Analysis by Product Type, 2020-2035
  • Figure 16: Global Market Volume (Units) Analysis by Product Type, 2020-2035
  • Figure 17: Global Market Value Share (%) and BPS Analysis by Product Type, 2025-2035
  • Figure 18: Global Market Y-o-Y Growth (%) Projections by Product Type, 2025-2035
  • Figure 19: Global Market Value (USD Million) Analysis by Channel, 2020-2035
  • Figure 20: Global Market Volume (Units) Analysis by Channel, 2020-2035
  • Figure 21: Global Market Value Share (%) and BPS Analysis by Channel, 2025-2035
  • Figure 22: Global Market Y-o-Y Growth (%) Projections by Channel, 2025-2035
  • Figure 23: Global Market Value (USD Million) Analysis by Source, 2020-2035
  • Figure 24: Global Market Volume (Units) Analysis by Source, 2020-2035
  • Figure 25: Global Market Value Share (%) and BPS Analysis by Source, 2025-2035
  • Figure 26: Global Market Y-o-Y Growth (%) Projections by Source, 2025-2035
  • Figure 27: Global Market Value (USD Million) Analysis by Tier, 2020-2035
  • Figure 28: Global Market Volume (Units) Analysis by Tier, 2020-2035
  • Figure 29: Global Market Value Share (%) and BPS Analysis by Tier, 2025-2035
  • Figure 30: Global Market Y-o-Y Growth (%) Projections by Tier, 2025-2035
  • Figure 31: Global Market Attractiveness by Function, 2025-2035
  • Figure 32: Global Market Attractiveness by Product Type, 2025-2035
  • Figure 33: Global Market Attractiveness by Channel, 2025-2035
  • Figure 34: Global Market Attractiveness by Source, 2025-2035
  • Figure 35: Global Market Attractiveness by Tier, 2025-2035
  • Figure 36: Global Market Attractiveness by Region, 2025-2035
  • Figure 37: North America Market Value (USD Million) by Function, 2025-2035
  • Figure 38: North America Market Value (USD Million) by Product Type, 2025-2035
  • Figure 39: North America Market Value (USD Million) by Channel, 2025-2035
  • Figure 40: North America Market Value (USD Million) by Source, 2025-2035
  • Figure 41: North America Market Value (USD Million) by Tier, 2025-2035
  • Figure 42: North America Market Value (USD Million) by Country, 2025-2035
  • Figure 43: North America Market Value (USD Million) Analysis by Country, 2020-2035
  • Figure 44: North America Market Volume (Units) Analysis by Country, 2020-2035
  • Figure 45: North America Market Value Share (%) and BPS Analysis by Country, 2025-2035
  • Figure 46: North America Market Y-o-Y Growth (%) Projections by Country, 2025-2035
  • Figure 47: North America Market Value (USD Million) Analysis by Function, 2020-2035
  • Figure 48: North America Market Volume (Units) Analysis by Function, 2020-2035
  • Figure 49: North America Market Value Share (%) and BPS Analysis by Function, 2025-2035
  • Figure 50: North America Market Y-o-Y Growth (%) Projections by Function, 2025-2035
  • Figure 51: North America Market Value (USD Million) Analysis by Product Type, 2020-2035
  • Figure 52: North America Market Volume (Units) Analysis by Product Type, 2020-2035
  • Figure 53: North America Market Value Share (%) and BPS Analysis by Product Type, 2025-2035
  • Figure 54: North America Market Y-o-Y Growth (%) Projections by Product Type, 2025-2035
  • Figure 55: North America Market Value (USD Million) Analysis by Channel, 2020-2035
  • Figure 56: North America Market Volume (Units) Analysis by Channel, 2020-2035
  • Figure 57: North America Market Value Share (%) and BPS Analysis by Channel, 2025-2035
  • Figure 58: North America Market Y-o-Y Growth (%) Projections by Channel, 2025-2035
  • Figure 59: North America Market Value (USD Million) Analysis by Source, 2020-2035
  • Figure 60: North America Market Volume (Units) Analysis by Source, 2020-2035
  • Figure 61: North America Market Value Share (%) and BPS Analysis by Source, 2025-2035
  • Figure 62: North America Market Y-o-Y Growth (%) Projections by Source, 2025-2035
  • Figure 63: North America Market Value (USD Million) Analysis by Tier, 2020-2035
  • Figure 64: North America Market Volume (Units) Analysis by Tier, 2020-2035
  • Figure 65: North America Market Value Share (%) and BPS Analysis by Tier, 2025-2035
  • Figure 66: North America Market Y-o-Y Growth (%) Projections by Tier, 2025-2035
  • Figure 67: North America Market Attractiveness by Function, 2025-2035
  • Figure 68: North America Market Attractiveness by Product Type, 2025-2035
  • Figure 69: North America Market Attractiveness by Channel, 2025-2035
  • Figure 70: North America Market Attractiveness by Source, 2025-2035
  • Figure 71: North America Market Attractiveness by Tier, 2025-2035
  • Figure 72: North America Market Attractiveness by Country, 2025-2035
  • Figure 73: Latin America Market Value (USD Million) by Function, 2025-2035
  • Figure 74: Latin America Market Value (USD Million) by Product Type, 2025-2035
  • Figure 75: Latin America Market Value (USD Million) by Channel, 2025-2035
  • Figure 76: Latin America Market Value (USD Million) by Source, 2025-2035
  • Figure 77: Latin America Market Value (USD Million) by Tier, 2025-2035
  • Figure 78: Latin America Market Value (USD Million) by Country, 2025-2035
  • Figure 79: Latin America Market Value (USD Million) Analysis by Country, 2020-2035
  • Figure 80: Latin America Market Volume (Units) Analysis by Country, 2020-2035
  • Figure 81: Latin America Market Value Share (%) and BPS Analysis by Country, 2025-2035
  • Figure 82: Latin America Market Y-o-Y Growth (%) Projections by Country, 2025-2035
  • Figure 83: Latin America Market Value (USD Million) Analysis by Function, 2020-2035
  • Figure 84: Latin America Market Volume (Units) Analysis by Function, 2020-2035
  • Figure 85: Latin America Market Value Share (%) and BPS Analysis by Function, 2025-2035
  • Figure 86: Latin America Market Y-o-Y Growth (%) Projections by Function, 2025-2035
  • Figure 87: Latin America Market Value (USD Million) Analysis by Product Type, 2020-2035
  • Figure 88: Latin America Market Volume (Units) Analysis by Product Type, 2020-2035
  • Figure 89: Latin America Market Value Share (%) and BPS Analysis by Product Type, 2025-2035
  • Figure 90: Latin America Market Y-o-Y Growth (%) Projections by Product Type, 2025-2035
  • Figure 91: Latin America Market Value (USD Million) Analysis by Channel, 2020-2035
  • Figure 92: Latin America Market Volume (Units) Analysis by Channel, 2020-2035
  • Figure 93: Latin America Market Value Share (%) and BPS Analysis by Channel, 2025-2035
  • Figure 94: Latin America Market Y-o-Y Growth (%) Projections by Channel, 2025-2035
  • Figure 95: Latin America Market Value (USD Million) Analysis by Source, 2020-2035
  • Figure 96: Latin America Market Volume (Units) Analysis by Source, 2020-2035
  • Figure 97: Latin America Market Value Share (%) and BPS Analysis by Source, 2025-2035
  • Figure 98: Latin America Market Y-o-Y Growth (%) Projections by Source, 2025-2035
  • Figure 99: Latin America Market Value (USD Million) Analysis by Tier, 2020-2035
  • Figure 100: Latin America Market Volume (Units) Analysis by Tier, 2020-2035
  • Figure 101: Latin America Market Value Share (%) and BPS Analysis by Tier, 2025-2035
  • Figure 102: Latin America Market Y-o-Y Growth (%) Projections by Tier, 2025-2035
  • Figure 103: Latin America Market Attractiveness by Function, 2025-2035
  • Figure 104: Latin America Market Attractiveness by Product Type, 2025-2035
  • Figure 105: Latin America Market Attractiveness by Channel, 2025-2035
  • Figure 106: Latin America Market Attractiveness by Source, 2025-2035
  • Figure 107: Latin America Market Attractiveness by Tier, 2025-2035
  • Figure 108: Latin America Market Attractiveness by Country, 2025-2035
  • Figure 109: Europe Market Value (USD Million) by Function, 2025-2035
  • Figure 110: Europe Market Value (USD Million) by Product Type, 2025-2035
  • Figure 111: Europe Market Value (USD Million) by Channel, 2025-2035
  • Figure 112: Europe Market Value (USD Million) by Source, 2025-2035
  • Figure 113: Europe Market Value (USD Million) by Tier, 2025-2035
  • Figure 114: Europe Market Value (USD Million) by Country, 2025-2035
  • Figure 115: Europe Market Value (USD Million) Analysis by Country, 2020-2035
  • Figure 116: Europe Market Volume (Units) Analysis by Country, 2020-2035
  • Figure 117: Europe Market Value Share (%) and BPS Analysis by Country, 2025-2035
  • Figure 118: Europe Market Y-o-Y Growth (%) Projections by Country, 2025-2035
  • Figure 119: Europe Market Value (USD Million) Analysis by Function, 2020-2035
  • Figure 120: Europe Market Volume (Units) Analysis by Function, 2020-2035
  • Figure 121: Europe Market Value Share (%) and BPS Analysis by Function, 2025-2035
  • Figure 122: Europe Market Y-o-Y Growth (%) Projections by Function, 2025-2035
  • Figure 123: Europe Market Value (USD Million) Analysis by Product Type, 2020-2035
  • Figure 124: Europe Market Volume (Units) Analysis by Product Type, 2020-2035
  • Figure 125: Europe Market Value Share (%) and BPS Analysis by Product Type, 2025-2035
  • Figure 126: Europe Market Y-o-Y Growth (%) Projections by Product Type, 2025-2035
  • Figure 127: Europe Market Value (USD Million) Analysis by Channel, 2020-2035
  • Figure 128: Europe Market Volume (Units) Analysis by Channel, 2020-2035
  • Figure 129: Europe Market Value Share (%) and BPS Analysis by Channel, 2025-2035
  • Figure 130: Europe Market Y-o-Y Growth (%) Projections by Channel, 2025-2035
  • Figure 131: Europe Market Value (USD Million) Analysis by Source, 2020-2035
  • Figure 132: Europe Market Volume (Units) Analysis by Source, 2020-2035
  • Figure 133: Europe Market Value Share (%) and BPS Analysis by Source, 2025-2035
  • Figure 134: Europe Market Y-o-Y Growth (%) Projections by Source, 2025-2035
  • Figure 135: Europe Market Value (USD Million) Analysis by Tier, 2020-2035
  • Figure 136: Europe Market Volume (Units) Analysis by Tier, 2020-2035
  • Figure 137: Europe Market Value Share (%) and BPS Analysis by Tier, 2025-2035
  • Figure 138: Europe Market Y-o-Y Growth (%) Projections by Tier, 2025-2035
  • Figure 139: Europe Market Attractiveness by Function, 2025-2035
  • Figure 140: Europe Market Attractiveness by Product Type, 2025-2035
  • Figure 141: Europe Market Attractiveness by Channel, 2025-2035
  • Figure 142: Europe Market Attractiveness by Source, 2025-2035
  • Figure 143: Europe Market Attractiveness by Tier, 2025-2035
  • Figure 144: Europe Market Attractiveness by Country, 2025-2035
  • Figure 145: East Asia Market Value (USD Million) by Function, 2025-2035
  • Figure 146: East Asia Market Value (USD Million) by Product Type, 2025-2035
  • Figure 147: East Asia Market Value (USD Million) by Channel, 2025-2035
  • Figure 148: East Asia Market Value (USD Million) by Source, 2025-2035
  • Figure 149: East Asia Market Value (USD Million) by Tier, 2025-2035
  • Figure 150: East Asia Market Value (USD Million) by Country, 2025-2035
  • Figure 151: East Asia Market Value (USD Million) Analysis by Country, 2020-2035
  • Figure 152: East Asia Market Volume (Units) Analysis by Country, 2020-2035
  • Figure 153: East Asia Market Value Share (%) and BPS Analysis by Country, 2025-2035
  • Figure 154: East Asia Market Y-o-Y Growth (%) Projections by Country, 2025-2035
  • Figure 155: East Asia Market Value (USD Million) Analysis by Function, 2020-2035
  • Figure 156: East Asia Market Volume (Units) Analysis by Function, 2020-2035
  • Figure 157: East Asia Market Value Share (%) and BPS Analysis by Function, 2025-2035
  • Figure 158: East Asia Market Y-o-Y Growth (%) Projections by Function, 2025-2035
  • Figure 159: East Asia Market Value (USD Million) Analysis by Product Type, 2020-2035
  • Figure 160: East Asia Market Volume (Units) Analysis by Product Type, 2020-2035
  • Figure 161: East Asia Market Value Share (%) and BPS Analysis by Product Type, 2025-2035
  • Figure 162: East Asia Market Y-o-Y Growth (%) Projections by Product Type, 2025-2035
  • Figure 163: East Asia Market Value (USD Million) Analysis by Channel, 2020-2035
  • Figure 164: East Asia Market Volume (Units) Analysis by Channel, 2020-2035
  • Figure 165: East Asia Market Value Share (%) and BPS Analysis by Channel, 2025-2035
  • Figure 166: East Asia Market Y-o-Y Growth (%) Projections by Channel, 2025-2035
  • Figure 167: East Asia Market Value (USD Million) Analysis by Source, 2020-2035
  • Figure 168: East Asia Market Volume (Units) Analysis by Source, 2020-2035
  • Figure 169: East Asia Market Value Share (%) and BPS Analysis by Source, 2025-2035
  • Figure 170: East Asia Market Y-o-Y Growth (%) Projections by Source, 2025-2035
  • Figure 171: East Asia Market Value (USD Million) Analysis by Tier, 2020-2035
  • Figure 172: East Asia Market Volume (Units) Analysis by Tier, 2020-2035
  • Figure 173: East Asia Market Value Share (%) and BPS Analysis by Tier, 2025-2035
  • Figure 174: East Asia Market Y-o-Y Growth (%) Projections by Tier, 2025-2035
  • Figure 175: East Asia Market Attractiveness by Function, 2025-2035
  • Figure 176: East Asia Market Attractiveness by Product Type, 2025-2035
  • Figure 177: East Asia Market Attractiveness by Channel, 2025-2035
  • Figure 178: East Asia Market Attractiveness by Source, 2025-2035
  • Figure 179: East Asia Market Attractiveness by Tier, 2025-2035
  • Figure 180: East Asia Market Attractiveness by Country, 2025-2035
  • Figure 181: South Asia & Pacific Market Value (USD Million) by Function, 2025-2035
  • Figure 182: South Asia & Pacific Market Value (USD Million) by Product Type, 2025-2035
  • Figure 183: South Asia & Pacific Market Value (USD Million) by Channel, 2025-2035
  • Figure 184: South Asia & Pacific Market Value (USD Million) by Source, 2025-2035
  • Figure 185: South Asia & Pacific Market Value (USD Million) by Tier, 2025-2035
  • Figure 186: South Asia & Pacific Market Value (USD Million) by Country, 2025-2035
  • Figure 187: South Asia & Pacific Market Value (USD Million) Analysis by Country, 2020-2035
  • Figure 188: South Asia & Pacific Market Volume (Units) Analysis by Country, 2020-2035
  • Figure 189: South Asia & Pacific Market Value Share (%) and BPS Analysis by Country, 2025-2035
  • Figure 190: South Asia & Pacific Market Y-o-Y Growth (%) Projections by Country, 2025-2035
  • Figure 191: South Asia & Pacific Market Value (USD Million) Analysis by Function, 2020-2035
  • Figure 192: South Asia & Pacific Market Volume (Units) Analysis by Function, 2020-2035
  • Figure 193: South Asia & Pacific Market Value Share (%) and BPS Analysis by Function, 2025-2035
  • Figure 194: South Asia & Pacific Market Y-o-Y Growth (%) Projections by Function, 2025-2035
  • Figure 195: South Asia & Pacific Market Value (USD Million) Analysis by Product Type, 2020-2035
  • Figure 196: South Asia & Pacific Market Volume (Units) Analysis by Product Type, 2020-2035
  • Figure 197: South Asia & Pacific Market Value Share (%) and BPS Analysis by Product Type, 2025-2035
  • Figure 198: South Asia & Pacific Market Y-o-Y Growth (%) Projections by Product Type, 2025-2035
  • Figure 199: South Asia & Pacific Market Value (USD Million) Analysis by Channel, 2020-2035
  • Figure 200: South Asia & Pacific Market Volume (Units) Analysis by Channel, 2020-2035
  • Figure 201: South Asia & Pacific Market Value Share (%) and BPS Analysis by Channel, 2025-2035
  • Figure 202: South Asia & Pacific Market Y-o-Y Growth (%) Projections by Channel, 2025-2035
  • Figure 203: South Asia & Pacific Market Value (USD Million) Analysis by Source, 2020-2035
  • Figure 204: South Asia & Pacific Market Volume (Units) Analysis by Source, 2020-2035
  • Figure 205: South Asia & Pacific Market Value Share (%) and BPS Analysis by Source, 2025-2035
  • Figure 206: South Asia & Pacific Market Y-o-Y Growth (%) Projections by Source, 2025-2035
  • Figure 207: South Asia & Pacific Market Value (USD Million) Analysis by Tier, 2020-2035
  • Figure 208: South Asia & Pacific Market Volume (Units) Analysis by Tier, 2020-2035
  • Figure 209: South Asia & Pacific Market Value Share (%) and BPS Analysis by Tier, 2025-2035
  • Figure 210: South Asia & Pacific Market Y-o-Y Growth (%) Projections by Tier, 2025-2035
  • Figure 211: South Asia & Pacific Market Attractiveness by Function, 2025-2035
  • Figure 212: South Asia & Pacific Market Attractiveness by Product Type, 2025-2035
  • Figure 213: South Asia & Pacific Market Attractiveness by Channel, 2025-2035
  • Figure 214: South Asia & Pacific Market Attractiveness by Source, 2025-2035
  • Figure 215: South Asia & Pacific Market Attractiveness by Tier, 2025-2035
  • Figure 216: South Asia & Pacific Market Attractiveness by Country, 2025-2035
  • Figure 217: Middle East and Africa Market Value (USD Million) by Function, 2025-2035
  • Figure 218: Middle East and Africa Market Value (USD Million) by Product Type, 2025-2035
  • Figure 219: Middle East and Africa Market Value (USD Million) by Channel, 2025-2035
  • Figure 220: Middle East and Africa Market Value (USD Million) by Source, 2025-2035
  • Figure 221: Middle East and Africa Market Value (USD Million) by Tier, 2025-2035
  • Figure 222: Middle East and Africa Market Value (USD Million) by Country, 2025-2035
  • Figure 223: Middle East and Africa Market Value (USD Million) Analysis by Country, 2020-2035
  • Figure 224: Middle East and Africa Market Volume (Units) Analysis by Country, 2020-2035
  • Figure 225: Middle East and Africa Market Value Share (%) and BPS Analysis by Country, 2025-2035
  • Figure 226: Middle East and Africa Market Y-o-Y Growth (%) Projections by Country, 2025-2035
  • Figure 227: Middle East and Africa Market Value (USD Million) Analysis by Function, 2020-2035
  • Figure 228: Middle East and Africa Market Volume (Units) Analysis by Function, 2020-2035
  • Figure 229: Middle East and Africa Market Value Share (%) and BPS Analysis by Function, 2025-2035
  • Figure 230: Middle East and Africa Market Y-o-Y Growth (%) Projections by Function, 2025-2035
  • Figure 231: Middle East and Africa Market Value (USD Million) Analysis by Product Type, 2020-2035
  • Figure 232: Middle East and Africa Market Volume (Units) Analysis by Product Type, 2020-2035
  • Figure 233: Middle East and Africa Market Value Share (%) and BPS Analysis by Product Type, 2025-2035
  • Figure 234: Middle East and Africa Market Y-o-Y Growth (%) Projections by Product Type, 2025-2035
  • Figure 235: Middle East and Africa Market Value (USD Million) Analysis by Channel, 2020-2035
  • Figure 236: Middle East and Africa Market Volume (Units) Analysis by Channel, 2020-2035
  • Figure 237: Middle East and Africa Market Value Share (%) and BPS Analysis by Channel, 2025-2035
  • Figure 238: Middle East and Africa Market Y-o-Y Growth (%) Projections by Channel, 2025-2035
  • Figure 239: Middle East and Africa Market Value (USD Million) Analysis by Source, 2020-2035
  • Figure 240: Middle East and Africa Market Volume (Units) Analysis by Source, 2020-2035
  • Figure 241: Middle East and Africa Market Value Share (%) and BPS Analysis by Source, 2025-2035
  • Figure 242: Middle East and Africa Market Y-o-Y Growth (%) Projections by Source, 2025-2035
  • Figure 243: Middle East and Africa Market Value (USD Million) Analysis by Tier, 2020-2035
  • Figure 244: Middle East and Africa Market Volume (Units) Analysis by Tier, 2020-2035
  • Figure 245: Middle East and Africa Market Value Share (%) and BPS Analysis by Tier, 2025-2035
  • Figure 246: Middle East and Africa Market Y-o-Y Growth (%) Projections by Tier, 2025-2035
  • Figure 247: Middle East and Africa Market Attractiveness by Function, 2025-2035
  • Figure 248: Middle East and Africa Market Attractiveness by Product Type, 2025-2035
  • Figure 249: Middle East and Africa Market Attractiveness by Channel, 2025-2035
  • Figure 250: Middle East and Africa Market Attractiveness by Source, 2025-2035
  • Figure 251: Middle East and Africa Market Attractiveness by Tier, 2025-2035
  • Figure 252: Middle East and Africa Market Attractiveness by Country, 2025-2035

Frequently Asked Questions

How big is the VEGAN COLLAGEN PEPTIDES Market in 2025?

The global Vegan Collagen Peptides Market is estimated to be valued at USD 2,253.6 million in 2025.

What will be the size of Vegan Collagen Peptides Market in 2035?

The market size for the Vegan Collagen Peptides Market is projected to reach USD 7,102.5 million by 2035.

How much will be the Vegan Collagen Peptides Market growth between 2025 and 2035?

The Vegan Collagen Peptides Market is expected to grow at a 12.2% CAGR between 2025 and 2035.

What are the key product types in the Vegan Collagen Peptides Market?

The key product types in Vegan Collagen Peptides Market are hardware, 3D scanners, accessories and software.

Which range segment to contribute significant share in the Vegan Collagen Peptides Market in 2025?

In terms of range, short-range scanners segment to command 48.5% share in the Vegan Collagen Peptides Market in 2025.

Explore Similar Insights

Future Market Insights

Vegan Collagen Peptides Market

Chat With

MaRIA

Hi There, I am MaRIA, Your Market Research Intelligence Assistant. How may I help you?