This site uses cookies, including third-party cookies, that help us to provide and improve our services.

Privacy Policy
- Global Locations -
Headquarters
Future Market Insights, Inc.
Christiana Corporate, 200 Continental Drive, Suite 401, Newark, Delaware - 19713, United States
T: +1-845-579-5705
MEA
Market Access DMCC

1602-6 Jumeirah Bay X2 Tower, Plot No: JLT-PH2-X2A,

Jumeirah Lakes Towers, Dubai,

United Arab Emirates

Americas
Future Market Insights
616 Corporate Way, Suite 2-9018,
Valley Cottage, NY 10989,
United States
T: +1-347-918-3531
Europe
Future Market Insights
3rd Floor, 207 Regent Street,
London W1B 3HH
United Kingdom
T: + 44 (0) 20 8123 9659
D: +44 (0) 20 3287 4268
APAC
Future Market Insights
Office No. 401-A, 4th Floor,
VANTAGE 9, S.No. 36/1/1,
Baner, Pune 411045 India

Vegan Pasta Market

Market Insights on Vegan Pasta covering sales outlook, demand forecast & up-to-date key trends

Vegan Pasta Market by Category (Fresh Vegan Pasta, Dried Vegan Pasta), Nature (Organic Vegan Pasta, Conventional Vegan Pasta), Source (Wheat, Rice) & Region - Forecast 2022 - 2032

Vegan Pasta Market Overview

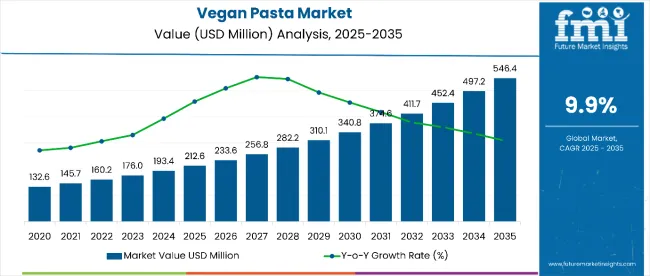
[350 Pages Report] The Vegan Pasta Market is estimated to be valued at USD 176 Mn in 2022. As per Future Market Insights (FMI), the overall market value is expected to reach a valuation of USD 416.7 Mn by 2032, rising at a CAGR of 9% for 2022-32.

Attribute

Details

Market Size Value in 2021

USD 161.5 Million

Market Forecast Value in 2032

USD 416.7 Million

Global Growth Rate

9%

Forecast Period

2022-2032

The increase is due to the population's acceptance of veganism, which has spread like wildfire over the world. As a result, traditional pasta manufacturers have begun to produce plant-based pasta or vegan pasta in order to cater to vegan customers. The desire for healthy, clean-label foods is on the rise, prompting pasta manufacturers to focus their efforts on vegan offerings. The market is anticipated to hold a share of around 20% of the overall pasta market.

Moreover, consumers holding intolerance towards gluten tend to shift away from gluten-based products, particularly meat-based consumables. As a consequence, vegan pasta is set to make forays into the diet of health-conscious and vegan consumers in the forecast period.

Customize this Report

Let us know your requirement to get
100% FREE customization

How The Market Progressed Till June 2022?

Particulars

Details

H1 2021

8.9%

H1 2022 Projected

9.0%

H1 2022 Expected

9.9%

BPS Change

- 99 ↓

FMI provides an evaluation and comparison of the market growth rates and future development possibilities on a half-yearly basis for the global market. There is still much space for development in the vegan pasta industry.

Since manufacturers stress "organic" and "gluten-free" characteristics to ensure superior product quality and nutritional benefits, a variety of vegan pasta is anticipated to become on the market soon. Key firms also primarily rely on inorganic tactics to expand their market share.

There have been a number of recent changes in this market.

  • VegaBytz has created nutritious pasta, noodles, and snacks that are high in fibre, 100% plant-based protein, immunity, and include zero carbohydrates and no sugar
  • A fresh plant-based Their vibrant pasta counterpart, Marella & Pozzo del Re's organic pasta, is situated in the province of Bari, in the region of Puglia, in the "heel" of Italy
  • Barilla purchased the Canadian business Catelli in February 2021. The Montreal plant that makes the company's dry pasta is part of the deal (Quebec)

The global market for Vegan Pasta is expected to rise by 5.5 % in the first half of 2021. However, the distribution of this increase is not equal across all geographical areas. The expected growth rate of the market is around 6.2%. Consequently, during H1 2022, there will be a -61.6 BPS point difference between expected and projected growth.

The primary causes of this variation in growth rate are ascribed to the market's quick acceptance over the first half of the projected period due to customers' shifting moral preferences away from animal-based products. The demand for plant-based products is increasing since there is an increase in awareness of animal cruelty and a sense that it is wrong to kill an animal for food.

It's important to note that prominent social media influencers like A Shooting Star and the Yoga Girl frequently promote vegetarianism in this context. It's also important to point out that they have hundreds of millions of daily inspiring followers online.

Despite these promising developments, there are still some likely obstacles to overcome. For example, the Vegan Pasta market is expected to be constrained by factors such as the need to adhere to strict regulations and different standards around the world, growing competition, and inflation that is expected to remain above the upper band in certain important countries over the short term, and fluctuating raw material prices.

2017-2021 Vegan Pasta Market Outlook in Comparison to 2022-2032 Growth Forecast

There has been a significant shift in the consumption pattern of consumers in the past few year, as increasing number of people are replacing their traditional diet to a more gluten free diet. This is owing to the rising consciousness among consumers to maintain a healthy diet with sufficient protein intake.

However, during COVID-19, the market faced a drastic fall in sales as consumers increased demand for essentials food products rather than specialty food products. In the 2nd quarter of 2020, demand for vegan pasta slowly picked pace, as consumer shifted towards plant-based food items to reduce the spread of food allergies from non-vegetarian food products.

Vegan Pasta Market Download Report Brochure

The market is expected to gain significant traction by 2032 end, as they have many health benefits despite having similar taste and texture of pasta. With the rising popularity of plant-based products resulting in the upwelling of vegan pasta sale, has compelled manufacturers to widen their distribution channel and innovate their product lines. These key factors are anticipated assist the vegan pasta market in the forecast period.

Country-wise Analysis

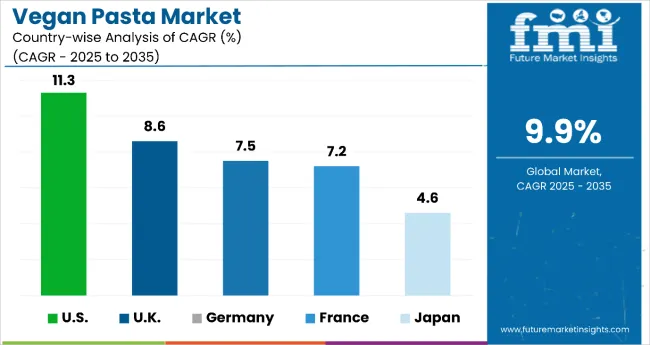
Demand Scenario of Vegan Pasta in the U.S.

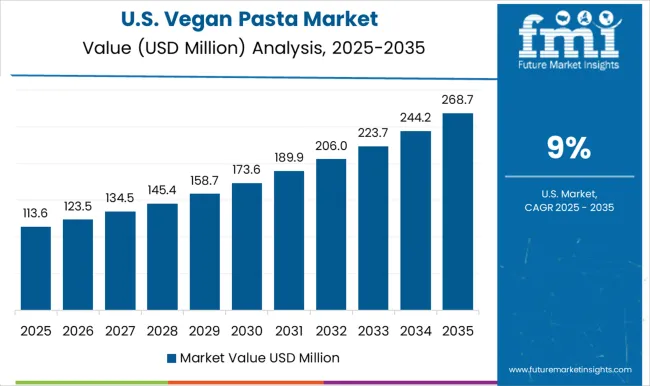
Pasta consumption is very high across the globe. But the changing trends and rising health-conscious consumers have led manufacturers to launch products such as vegan pasta catering to consumers’ demand. Vegan pasta is quite popular among consumers in the U.S.

This is because consumers here are well aware of product such as vegan pasta that are available in the market, new product launches and are willing to buy products at premium prices as well.

Additionally, vegan pasta market in the U.S. carries a well-connected distribution channel, which improves the accessibility of these product in the country. This is expected to bring magnificent growth opportunities for the market in the U.S.

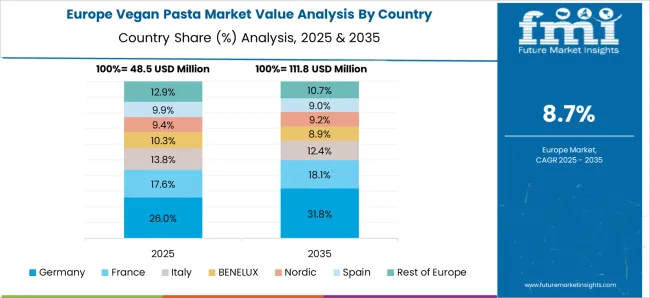
Germany Dominating the European Vegan Pasta Market

Production of vegan products in Europe is witnessing a two-fold growth, with Germany leading the list among other countries. This is owing to increasing inclination of consumers in the country towards sustainable food items along with health benefits.

In recent years, Germany has seen a drastic fall in the consumption of non-vegetarian and meat products, owing to rising adoption of vegan lifestyle by consumers in the country.

According to Green Queen Media, number of vegan consumers doubled in Europe in the previous four years, accounting for almost 2.6 million people. This is likely to put Germany in the spotlight for vegan pasta manufacturers in the coming years.

Nandini Roy Choudhury
Principal Consultant
LinkedIn
Talk to Analyst

Find your sweet spots for generating winning opportunities in this market.

Talk to Analyst

Category-wise Insights

Demand for Vegan Pasta Sourced from Legumes Significantly Impact the Market

Myriads of evidence presented that refined carbs pose various risks to human health, including obesity, heart disease, and inflammation. Food manufacturers are rushing to innovation in the space, developing healthier food products including pasta derived from ingredients, such as legumes.

In addition, the legume vegan pastas are gluten-free, minimizing health-related issues, particularly for consumers suffering from gluten-intolerance. Vegan pasta sourced from legumes encompass lentils – black, red, or green – offering a treasure of nutrients, including protein and fiber (in ample amount) along with various vital nutrients - calcium, iron, and vitamin B6.

Aforementioned factors are poised to propel demand for vegan pasta sourced from legumes thus driving its consumption with a rising growth rate over the forecast period.    

Dried Vegan Pasta to Gain Traction in the Forthcoming Years

The veganism trend peaked in 2018, boosting a number of businesses in the vegan category. Vegan pasta, one of these beneficiaries, garnered attention since then as pasta already had been among the most favored convenience foods, globally. However, fresh pasta served at restaurants and cafés are rarely vegan.

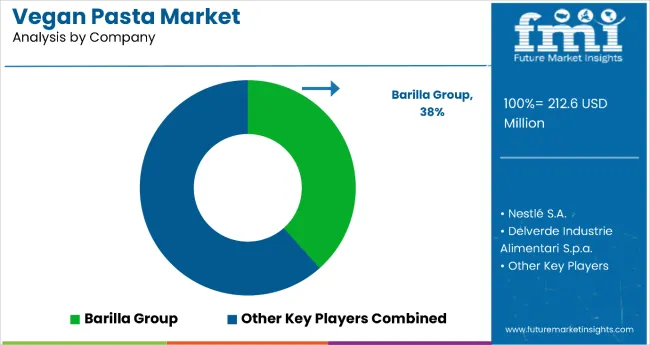
Furthermore, majority of packaged dried pasta contain ingredients that are plant-based, however referring to them as 'vegan' would be an overstatement. As a result popular brands such as Barilla, Ronzoni, Explore Cuisine, and Mueller's are leading the way in vegan pasta market to offer a variety of dried pasta with the authenticated vegan claim. These brands prominently sell their vegan pasta at the all-vegan sections of Walmart, Whole Foods, and Costco. Still in its infancy, vegan dried pastas are expected to see robust growth in the near future.

Competition Landscape: Top Vegan Pasta Companies

Some of the key players in the vegan pasta market include Nestlé S.A., Barilla Group, De Cecco Company, Delverde Industrie Alimentari S.p.a., Grupo La Moderna, RFM Corporation, General Mills, Inc., Windmill Organics Pastas Gallo Company, Bionaturae LLC., among others.

The vegan pasta market is still at its infancy, with plenty of room for improvement. A variety of vegan pasta is likely to hit the shelves in the near future, as manufacturer prioritize ‘organic’ and ‘gluten-free’ aspects to ensure higher product quality and nutritional benefits. Moreover, key players are heavily dependent on inorganic strategies to gain market share.

For instance:

  • In February 2021, Barilla acquired a Canadian company Catelli. The acquisition includes the company’s dry pasta plant in Montreal (Quebec).
MarketNage
Become a MarketNgage Insider

A unified Market Research Subscription Platform, built for today's disparate research needs.

Scope of Report

Attribute

Details

Market Size Value in 2021

USD 161.5 Million

Market Forecast Value in 2032

USD 416.7 Million

Global Growth Rate

9%

Forecast Period

2022-2032

Historical Data Available for

2017-2021

Market Analysis

MT for Volume and USD Mn for Value

Key Regions Covered

North America, Latin America, Europe, East Asia, South Asia, Oceania and MEA

Key Countries Covered

United States, Canada, Brazil, Mexico, Germany, UK, France, Italy, Spain, Nordic, Russia, Poland, China, India, Thailand, Indonesia, Australia and New Zealand, Japan, GCC countries, North Africa, South Africa, others.

Key Market Segments Covered

Category, Nature, Product, Packaging, Sales Channel and Regions

Key Companies Profiled

Pricing

Available upon Request

Market Segments Covered in Vegan Pasta Industry Analysis

By Category :

  • Fresh Vegan Pasta
  • Dried Vegan Pasta

By Nature :

  • Organic Vegan Pasta
  • Conventional Vegan Pasta

By Source :

  • Wheat
  • Rice
  • Legumes
  • Buckwheat
  • Oats
  • Other Sources

By Product :

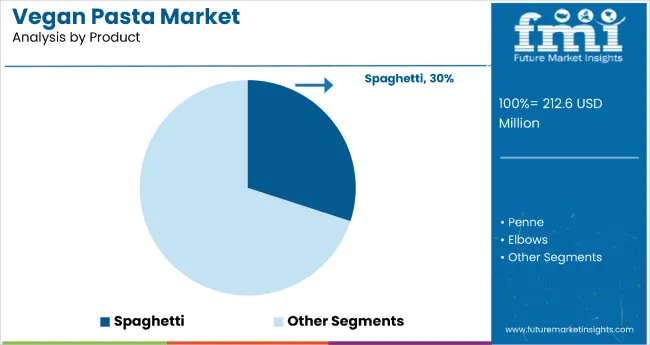
  • Penne
  • Spaghetti
  • Elbows
  • Fettuccine & Linguine
  • Filled Pasta
  • Other Products

By Packaging :

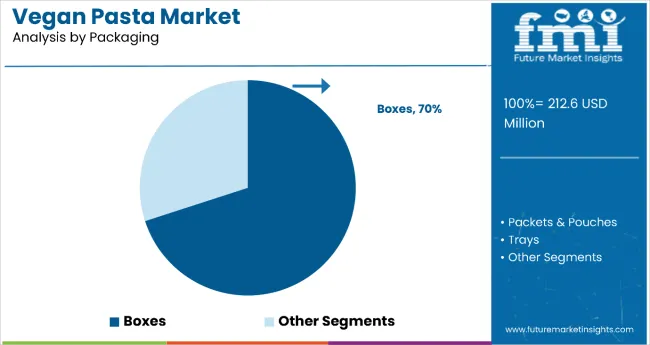
  • Boxes
  • Trays
  • Packets & Pouches

By Sales Channel :

  • Offline Sales Channel
    • Supermarkets/Hypermarkets
    • Departmental Stores
    • Convenience Store
    • Other Sales Channel
  • Online Sales Channel
    • Company Website
    • E-commerce Platform

 Region :

  • North America
  • Latin America
  • Europe
  • East Asia
  • South Asia
  • Oceania
  • Middle East & Africa

Frequently Asked Questions

The vegan pasta market is valued more than USD 161.5 Mn as of 2021.

Vegan pasta consumption is expected to grow at a CAGR of around 9% during the period 2022-2032.

Vegan pasta market is anticipated to reach a valuation of USD 416.7 Mn by 2032.

Barilla Group, De Cecco Company, Nestlé S.A., Bionaturae LLC., Windmill Organics are the prominent players in the market.

The U.S., U.K. and Germany are the major countries driving demand for vegan pasta.

The report presents a detailed cost analysis of vegan pasta based on nature i.e. fresh vegan pasta and dried vegan pasta.

Table of Content

1. Market Overview

    1.1. Market Coverage / Taxonomy

    1.2. Market Definition / Scope / Limitations

2. The Massive Impact of the Crisis

    2.1. Global Vegan Pasta Market Forecast Scenario Comparison of Annual Growth Rates for Short Term (2022-2025) and Long Term (2026-2032)

        2.1.1. Optimistic Scenario

            2.1.1.1. China

            2.1.1.2. US

            2.1.1.3. India

            2.1.1.4. Euro Zone

            2.1.1.5. Asia Pacific 

            2.1.1.6. Rest of the World

        2.1.2. Likely Scenario

            2.1.2.1. China

            2.1.2.2. US

            2.1.2.3. India

            2.1.2.4. Euro Zone

            2.1.2.5. Asia Pacific 

            2.1.2.6. Rest of the World

        2.1.3. Pessimistic Scenario

            2.1.3.1. China

            2.1.3.2. US

            2.1.3.3. India

            2.1.3.4. Euro Zone

            2.1.3.5. Asia Pacific 

            2.1.3.6. Rest of the World

    2.2. Key Factors Impacting the Market

    Note: Market Assessment shall be Provided for Likely Scenario

3. Market Background

    3.1. Global Pasta Production Outlook 

    3.2. Global Pasta Consumption Market

    3.3. Conventional vs Organic Pasta

    3.4. Product Launches

    3.5. Product Claims & Nutritional Information Scan by Buyers

    3.6. Macro-Economic Factors

    3.7. Forecast Factors - Relevance & Impact

    3.8. Consumers Survey Analysis

    3.9. Market Dynamics

        3.9.1. Supply Side Drivers

        3.9.2. Demand Side drivers

        3.9.3. Economic Side Drivers

        3.9.4. Restraints

        3.9.5. Opportunity

        3.9.6. Trends

4. Key Regulations

    4.1. Packaging & Labelling Regulations

    4.2. Certifications and Certifying Agency Overview

    4.3. Import/Export Policies

5. Global Vegan Pasta Market- Production and Trade Analysis

    5.1. Total Production Volume (MT), (2022E)

        5.1.1. North America

        5.1.2. Latin America

        5.1.3. Europe

        5.1.4. East Asia

        5.1.5. South Asia

        5.1.6. Oceania

        5.1.7. Middle East and Africa (MEA)

    5.2. Vegan Pasta Market- Exports to the World

        5.2.1. Key Exporting Countries/Regions- Market Share Analysis (2022E)

        5.2.2. Value (USD Mn) of Export/ Volume (MT) of Export

    5.3. Vegan Pasta Market- Imports to the World

        5.3.1. Key importing Countries/Regions- Market Share Analysis (2022E)

        5.3.2. Value (USD Mn) of Import/ Volume (MT) of Import

    5.4. Comparative Analysis of Brands by Key Importing Countries

    5.5. Global Vegan Pasta Market- Supply Demand Scenario (Global Production, Sales, Import, Export)

6. Global Vegan Pasta Market Demand Analysis 2017-2021and Forecast, 2022-2032

    6.1. Historical Market Volume (Metric Tons) Analysis, 2017-2021 

    6.2. Current and Future Market Volume (Metric Tons) Projections, 2022-2032

    6.3. Y-o-Y Growth Trend Analysis 2022-2032

7. Global Vegan Pasta Market - Pricing Analysis

    7.1. Regional Pricing Analysis (US$/Metric Ton) By Category (2017,2022,2032)

        7.1.1. Fresh Vegan Pasta

        7.1.2. Dried Vegan Pasta

    7.2. Pricing Break-up (2017,2022,2032)

        7.2.1. Producer Level Pricing

        7.2.2. Distributor Level Pricing

        7.2.3. Retailer Level Pricing

    7.3. Global Average Pricing Analysis Benchmark

8. Global Vegan Pasta Market Demand (Size in USD Mn) Analysis 2017-2021 and Forecast, 2022-2032

    8.1. Historical Market Value (USD Mn) Analysis, 2017-2021 

    8.2. Current and Future Market Value (USD Mn) Projections, 2022-2032

        8.2.1. Y-o-Y Growth Trend Analysis

        8.2.2. Absolute $ Opportunity Analysis

9. Global Vegan Pasta Market Analysis 2017-2021 and Forecast 2022-2032, By Category

    9.1. Introduction / Key Findings

    9.2. Historical Market Size (USD Mn) and Volume Analysis By Category, 2017-2021 

    9.3. Current and Future Market Size (USD Mn) and Volume Analysis and Forecast By Category, 2022-2032

        9.3.1. Fresh Vegan Pasta

        9.3.2. Dried Vegan Pasta

    9.4. Market Attractiveness Analysis By Category

10. Global Vegan Pasta Market Analysis 2017-2021 and Forecast 2022-2032, By Nature

    10.1. Introduction / Key Findings

    10.2. Historical Market Size (USD Mn) and Volume Analysis By Nature, 2017 - 2021

    10.3. Current and Future Market Size (USD Mn) and Volume Analysis and Forecast By Nature, 2022-2032

        10.3.1. Organic Vegan Pasta

        10.3.2. Conventional Vegan Pasta

    10.4. Market Attractiveness Analysis By Nature

11. Global Vegan Pasta Market Analysis 2017-2021 and Forecast 2022-2032, By Source

    11.1. Introduction / Key Findings

    11.2. Historical Market Size (USD Mn) and Volume Analysis By Source, 2017-2021 

    11.3. Current and Future Market Size (USD Mn) and Volume Analysis and Forecast By Source, 2022-2032

        11.3.1. Wheat

        11.3.2. Rice

        11.3.3. Legumes

        11.3.4. Buckwheat

        11.3.5. Oats

        11.3.6. Other Sources

    11.4. Market Attractiveness Analysis By Source

12. Global Vegan Pasta Market Analysis 2017-2021 and Forecast 2022-2032, By Category

    12.1. Introduction / Key Findings

    12.2. Historical Market Size (USD Mn) and Volume Analysis By Category, 2017-2021 

    12.3. Current and Future Market Size (USD Mn) and Volume Analysis and Forecast By Category, 2022-2032

        12.3.1. Penne

        12.3.2. Spaghetti

        12.3.3. Elbows

        12.3.4. Fettuccine & Linguine

        12.3.5. Filled Pasta

        12.3.6. Other Products

    12.4. Market Attractiveness Analysis By Category

13. Global Vegan Pasta Market Analysis 2017-2021 and Forecast 2022-2032, By Packaging

    13.1. Introduction / Key Findings

    13.2. Historical Market Size (USD Mn) and Volume Analysis By Packaging , 2017-2021 

    13.3. Current and Future Market Size (USD Mn) and Volume Analysis and Forecast By Packaging, 2022-2032

        13.3.1. Boxes

        13.3.2. Trays

        13.3.3. Packets & Pouches

    13.4. Market Attractiveness Analysis By Packaging

14. Global Vegan Pasta Market Analysis 2017-2021 and Forecast 2022-2032, By Sales Channel 

    14.1. Introduction

    14.2. Historical Market Size (USD Mn) and Volume Analysis By Sales Channel , 2017-2021 

    14.3. Current Market Size (USD Mn) and Volume Analysis and Forecast By Sales Channel, 2022-2032

        14.3.1. Offline Sales Channel

            14.3.1.1. Supermarkets/Hypermarkets

            14.3.1.2. Departmental Stores

            14.3.1.3. Convenience Store

            14.3.1.4. Other Sales Channel

        14.3.2. Online Sales Channel

            14.3.2.1. Company Website

            14.3.2.2. E-commerce Platform 

    14.4. Market Attractiveness Analysis By Sales Channel

15. Global Vegan Pasta Market Analysis 2017-2021 and Forecast 2022-2032, By Region 

    15.1. Introduction

    15.2. Historical Market Size (USD Mn) and Volume Analysis By Region, 2017-2021 

    15.3. Current Market Size (USD Mn) and Volume Analysis and Forecast By Region, 2022-2032

        15.3.1. North America

        15.3.2. Latin America 

        15.3.3. Europe

        15.3.4. East Asia

        15.3.5. South Asia

        15.3.6. Oceania

        15.3.7. MEA

    15.4. Market Attractiveness Analysis By Region

16. North America Vegan Pasta Market Analysis 2017-2021 and Forecast 2022-2032

    16.1. Introduction

    16.2. Pricing Analysis

    16.3. Historical Market Size (USD Mn) and Volume Trend Analysis By Market Taxonomy, 2017-2021 

    16.4. Market Size (USD Mn) and Volume Forecast By Market Taxonomy, 2022 - 2032

        16.4.1.  By Country

            16.4.1.1. U.S.

            16.4.1.2. Canada

        16.4.2. By Category

        16.4.3. By Nature

        16.4.4. By Source

        16.4.5. By Product Type

        16.4.6. By Packaging

        16.4.7. By Sales Channel

    16.5. Market Attractiveness Analysis

        16.5.1. By Category

        16.5.2. By Nature

        16.5.3. By Source

        16.5.4. By Product Type

        16.5.5. By Packaging

        16.5.6. By Sales Channel

    16.6. Market Trends

    16.7. Key Market Participants - Intensity Mapping

    16.8. Drivers and Restraints - Impact Analysis

17. Latin America Vegan Pasta Market Analysis 2017-2021 and Forecast 2022-2032

    17.1. Introduction

    17.2. Pricing Analysis

    17.3. Historical Market Size (USD Mn) and Volume Trend Analysis By Market Taxonomy, 2017-2021 

    17.4. Market Size (USD Mn) and Volume Forecast By Market Taxonomy, 2022 - 2032

        17.4.1.  By Country

            17.4.1.1. Brazil

            17.4.1.2. Mexico

            17.4.1.3. Argentina

            17.4.1.4. Chile

            17.4.1.5. Peru

            17.4.1.6. Rest of Latin America

        17.4.2. By Category

        17.4.3. By Nature

        17.4.4. By Source

        17.4.5. By Product Type

        17.4.6. By Packaging

        17.4.7. By Sales Channel

    17.5. Market Attractiveness Analysis

        17.5.1. By Category

        17.5.2. By Nature

        17.5.3. By Source

        17.5.4. By Product Type

        17.5.5. By Packaging

        17.5.6. By Sales Channel

    17.6. Market Trends

    17.7. Key Market Participants - Intensity Mapping

    17.8. Drivers and Restraints - Impact Analysis

18. Europe Vegan Pasta Market Analysis 2017-2021and Forecast 2022-2032

    18.1. Introduction

    18.2. Pricing Analysis

    18.3. Historical Market Size (USD Mn) and Volume Trend Analysis By Market Taxonomy, 2017-2021 

    18.4. Market Size (USD Mn) and Volume Forecast By Market Taxonomy, 2022 - 2032

        18.4.1.  By Country

            18.4.1.1. Germany

            18.4.1.2. Italy

            18.4.1.3. France 

            18.4.1.4. U.K

            18.4.1.5. Spain

            18.4.1.6. BENELUX

            18.4.1.7. Nordic

            18.4.1.8. Russia

            18.4.1.9. Poland

            18.4.1.10. Rest of Europe 

        18.4.2. By Category

        18.4.3. By Nature

        18.4.4. By Source

        18.4.5. By Product Type

        18.4.6. By Packaging

        18.4.7. By Sales Channel

    18.5. Market Attractiveness Analysis

        18.5.1. By Category

        18.5.2. By Nature

        18.5.3. By Source

        18.5.4. By Product Type

        18.5.5. By Packaging

        18.5.6. By Sales Channel

    18.6. Market Trends

    18.7. Key Market Participants - Intensity Mapping

    18.8. Drivers and Restraints - Impact Analysis

19. East Asia Vegan Pasta Market Analysis 2017-2021 and Forecast 2022-2032

    19.1. Introduction

    19.2. Pricing Analysis

    19.3. Historical Market Size (USD Mn) and Volume Trend Analysis By Market Taxonomy, 2017-2021 

    19.4. Market Size (USD Mn) and Volume Forecast By Market Taxonomy, 2022 - 2032

        19.4.1.  By Country

            19.4.1.1. China

            19.4.1.2. Japan 

            19.4.1.3. South Korea

        19.4.2. By Category

        19.4.3. By Nature

        19.4.4. By Source

        19.4.5. By Product Type

        19.4.6. By Packaging

        19.4.7. By Sales Channel

    19.5. Market Attractiveness Analysis

        19.5.1. By Category

        19.5.2. By Nature

        19.5.3. By Source

        19.5.4. By Product Type

        19.5.5. By Packaging

        19.5.6. By Sales Channel

    19.6. Market Trends

    19.7. Key Market Participants - Intensity Mapping

    19.8. Drivers and Restraints - Impact Analysis

20. South Asia Vegan Pasta Market Analysis 2017-2021 and Forecast 2022-2032

    20.1. Introduction

    20.2. Pricing Analysis

    20.3. Historical Market Size (USD Mn) and Volume Trend Analysis By Market Taxonomy, 2017-2021 

    20.4. Market Size (USD Mn) and Volume Forecast By Market Taxonomy, 2022 - 2032

        20.4.1.  By Country

            20.4.1.1. India

            20.4.1.2. Indonesia

            20.4.1.3. Malaysia

            20.4.1.4. Thailand 

            20.4.1.5. Rest of South Asia

        20.4.2. By Category

        20.4.3. By Nature

        20.4.4. By Source

        20.4.5. By Product Type

        20.4.6. By Packaging

        20.4.7. By Sales Channel

    20.5. Market Attractiveness Analysis

        20.5.1. By Category

        20.5.2. By Nature

        20.5.3. By Source

        20.5.4. By Product Type

        20.5.5. By Packaging

        20.5.6. By Sales Channel

    20.6. Market Trends

    20.7. Key Market Participants - Intensity Mapping

    20.8. Drivers and Restraints - Impact Analysis

21. Oceania Vegan Pasta Market Analysis 2017-2021 and Forecast 2022-2032

    21.1. Introduction

    21.2. Pricing Analysis

    21.3. Historical Market Size (USD Mn) and Volume Trend Analysis By Market Taxonomy, 2017-2021 

    21.4. Market Size (USD Mn) and Volume Forecast By Market Taxonomy, 2022 - 2032

        21.4.1.  By Country

            21.4.1.1. Australia

            21.4.1.2. New-Zealand 

        21.4.2. By Category

        21.4.3. By Nature

        21.4.4. By Source

        21.4.5. By Product Type

        21.4.6. By Packaging

        21.4.7. By Sales Channel

    21.5. Market Attractiveness Analysis

        21.5.1. By Category

        21.5.2. By Nature

        21.5.3. By Source

        21.5.4. By Product Type

        21.5.5. By Packaging

        21.5.6. By Sales Channel

    21.6. Market Trends

    21.7. Key Market Participants - Intensity Mapping

    21.8. Drivers and Restraints - Impact Analysis

22. Middle East and Africa Vegan Pasta Market Analysis 2017-2021 and Forecast 2022-2032

    22.1. Introduction

    22.2. Pricing Analysis

    22.3. Historical Market Size (USD Mn) and Volume Trend Analysis By Market Taxonomy, 2017-2021 

    22.4. Market Size (USD Mn) and Volume Forecast By Market Taxonomy, 2022 - 2032

        22.4.1.  By Country

            22.4.1.1. GCC Countries

            22.4.1.2. North Africa

            22.4.1.3. South Africa

            22.4.1.4. Turkey

            22.4.1.5. Rest of MEA

        22.4.2. By Category

        22.4.3. By Nature

        22.4.4. By Source

        22.4.5. By Product Type

        22.4.6. By Packaging

        22.4.7. By Sales Channel

    22.5. Market Attractiveness Analysis

        22.5.1. By Category

        22.5.2. By Nature

        22.5.3. By Source

        22.5.4. By Product Type

        22.5.5. By Packaging

        22.5.6. By Sales Channel

    22.6. Market Trends

    22.7. Key Market Participants - Intensity Mapping

    22.8. Drivers and Restraints - Impact Analysis

23. Key Countries Bulk Ingredients  Market Analysis 2017–2021 and Forecast 2022–2032

    23.1. U.S.

        23.1.1. Pricing Analysis (2017, 2022, 2032)

        23.1.2. Market Value and Volume Analysis 2017–2021 and Forecast 2022–2032

            23.1.2.1. By Category

            23.1.2.2. By Nature

            23.1.2.3. By Source

            23.1.2.4. By Product Type

            23.1.2.5. By Packaging

            23.1.2.6. By Sales Channel 

    23.2. Canada

        23.2.1. Pricing Analysis (2017, 2022, 2032)

        23.2.2. Market Value and Volume Analysis 2017–2021 and Forecast 2022–2032

            23.2.2.1. By Category

            23.2.2.2. By Nature

            23.2.2.3. By Source

            23.2.2.4. By Product Type

            23.2.2.5. By Packaging

            23.2.2.6. By Sales Channel 

    23.3. Brazil

        23.3.1. Pricing Analysis (2017, 2022, 2032)

        23.3.2. Market Value and Volume Analysis 2017–2021 and Forecast 2022–2032

            23.3.2.1. By Category

            23.3.2.2. By Nature

            23.3.2.3. By Source

            23.3.2.4. By Product Type

            23.3.2.5. By Packaging

            23.3.2.6. By Sales Channel 

    23.4. Mexico

        23.4.1. Pricing Analysis (2017, 2022, 2032)

        23.4.2. Market Value and Volume Analysis 2017–2021 and Forecast 2022–2032

            23.4.2.1. By Category

            23.4.2.2. By Nature

            23.4.2.3. By Source

            23.4.2.4. By Product Type

            23.4.2.5. By Packaging

            23.4.2.6. By Sales Channel 

    23.5. Russia

        23.5.1. Pricing Analysis (2017, 2022, 2032)

        23.5.2. Market Value and Volume Analysis 2017–2021 and Forecast 2022–2032

            23.5.2.1. By Category

            23.5.2.2. By Nature

            23.5.2.3. By Source

            23.5.2.4. By Product Type

            23.5.2.5. By Packaging

            23.5.2.6. By Sales Channel 

    23.6. Poland

        23.6.1. Pricing Analysis (2017, 2022, 2032)

        23.6.2. Market Value and Volume Analysis 2017–2021 and Forecast 2022–2032

            23.6.2.1. By Category

            23.6.2.2. By Nature

            23.6.2.3. By Source

            23.6.2.4. By Product Type

            23.6.2.5. By Packaging

            23.6.2.6. By Sales Channel 

    23.7. Germany

        23.7.1. Pricing Analysis (2017, 2022, 2032)

        23.7.2. Market Value and Volume Analysis 2017–2021 and Forecast 2022–2032

            23.7.2.1. By Category

            23.7.2.2. By Nature

            23.7.2.3. By Source

            23.7.2.4. By Product Type

            23.7.2.5. By Packaging

            23.7.2.6. By Sales Channel 

    23.8. United Kingdom

        23.8.1. Pricing Analysis (2017, 2022, 2032)

        23.8.2. Market Value and Volume Analysis 2017–2021 and Forecast 2022–2032

            23.8.2.1. By Category

            23.8.2.2. By Nature

            23.8.2.3. By Source

            23.8.2.4. By Product Type

            23.8.2.5. By Packaging

            23.8.2.6. By Sales Channel 

    23.9. France

        23.9.1. Pricing Analysis (2017, 2022, 2032)

        23.9.2. Market Value and Volume Analysis 2017–2021 and Forecast 2022–2032

            23.9.2.1. By Category

            23.9.2.2. By Nature

            23.9.2.3. By Source

            23.9.2.4. By Product Type

            23.9.2.5. By Packaging

            23.9.2.6. By Sales Channel 

    23.10. Italy

        23.10.1. Pricing Analysis (2017, 2022, 2032)

        23.10.2. Market Value and Volume Analysis 2017–2021 and Forecast 2022–2032

            23.10.2.1. By Category

            23.10.2.2. By Nature

            23.10.2.3. By Source

            23.10.2.4. By Product Type

            23.10.2.5. By Packaging

            23.10.2.6. By Sales Channel 

    23.11. Spain

        23.11.1. Pricing Analysis (2017, 2022, 2032)

        23.11.2. Market Value and Volume Analysis 2017–2021 and Forecast 2022–2032

            23.11.2.1. By Category

            23.11.2.2. By Nature

            23.11.2.3. By Source

            23.11.2.4. By Product Type

            23.11.2.5. By Packaging

            23.11.2.6. By Sales Channel 

    23.12. China

        23.12.1. Pricing Analysis (2017, 2022, 2032)

        23.12.2. Market Value and Volume Analysis 2017–2021 and Forecast 2022–2032

            23.12.2.1. By Category

            23.12.2.2. By Nature

            23.12.2.3. By Source

            23.12.2.4. By Product Type

            23.12.2.5. By Packaging

            23.12.2.6. By Sales Channel 

    23.13. India

        23.13.1. Pricing Analysis (2017, 2022, 2032)

        23.13.2. Market Value and Volume Analysis 2017–2021 and Forecast 2022–2032

            23.13.2.1. By Category

            23.13.2.2. By Nature

            23.13.2.3. By Source

            23.13.2.4. By Product Type

            23.13.2.5. By Packaging

            23.13.2.6. By Sales Channel 

    23.14. Australia and New Zealand

        23.14.1. Pricing Analysis (2017, 2022, 2032)

        23.14.2. Market Value and Volume Analysis 2017–2021 and Forecast 2022–2032

            23.14.2.1. By Category

            23.14.2.2. By Nature

            23.14.2.3. By Source

            23.14.2.4. By Product Type

            23.14.2.5. By Packaging

            23.14.2.6. By Sales Channel 

    23.15. ASEAN

        23.15.1. Pricing Analysis (2017, 2022, 2032)

        23.15.2. Market Value and Volume Analysis 2017–2021 and Forecast 2022–2032

            23.15.2.1. By Category

            23.15.2.2. By Nature

            23.15.2.3. By Source

            23.15.2.4. By Product Type

            23.15.2.5. By Packaging

            23.15.2.6. By Sales Channel 

    23.16. Japan

        23.16.1. Pricing Analysis (2017, 2022, 2032)

        23.16.2. Market Value and Volume Analysis 2017–2021 and Forecast 2022–2032

            23.16.2.1. By Category

            23.16.2.2. By Nature

            23.16.2.3. By Source

            23.16.2.4. By Product Type

            23.16.2.5. By Packaging

            23.16.2.6. By Sales Channel 

    23.17. GCC Countries

        23.17.1. Pricing Analysis (2017, 2022, 2032)

        23.17.2. Market Value and Volume Analysis 2017–2021 and Forecast 2022–2032

            23.17.2.1. By Category

            23.17.2.2. By Nature

            23.17.2.3. By Source

            23.17.2.4. By Product Type

            23.17.2.5. By Packaging

            23.17.2.6. By Sales Channel 

    23.18. South Africa

        23.18.1. Pricing Analysis (2017, 2022, 2032)

        23.18.2. Market Value and Volume Analysis 2017–2021 and Forecast 2022–2032

            23.18.2.1. By Category

            23.18.2.2. By Nature

            23.18.2.3. By Source

            23.18.2.4. By Product Type

            23.18.2.5. By Packaging

            23.18.2.6. By Sales Channel 

24. Market Structure Analysis

    24.1. Market Analysis by Tier of Companies 

    24.2. Company Share Analysis of Top Players

        24.2.1. By Category

        24.2.2. By Region

    24.3. Market Presence Analysis

        24.3.1. By Regional Footprint of Players

        24.3.2. Product Footprint by Players

        24.3.3. Channel Footprint by Players

25. Competition Deep Dive (Tentative List)

    25.1. Barilla Group

            25.1.1.1. Overview

            25.1.1.2. Product Portfolio

            25.1.1.3. Profitability by Market Segments 

            25.1.1.4. Sales Footprint

            25.1.1.5. SWOT Analysis

            25.1.1.6. Strategy Overview

                25.1.1.6.1. Product Strategy

                25.1.1.6.2. Channel Strategy

    25.2. De Cecco Company

            25.2.1.1. Overview

            25.2.1.2. Product Portfolio

            25.2.1.3. Profitability by Market Segments 

            25.2.1.4. Sales Footprint

            25.2.1.5. SWOT Analysis

            25.2.1.6. Strategy Overview

                25.2.1.6.1. Product Strategy

                25.2.1.6.2. Channel Strategy

    25.3. Nestlé S.A.

            25.3.1.1. Overview

            25.3.1.2. Product Portfolio

            25.3.1.3. Profitability by Market Segments 

            25.3.1.4. Sales Footprint

            25.3.1.5. SWOT Analysis

            25.3.1.6. Strategy Overview

                25.3.1.6.1. Product Strategy

                25.3.1.6.2. Channel Strategy

    25.4. Delverde Industrie Alimentari S.p.a.

            25.4.1.1. Overview

            25.4.1.2. Product Portfolio

            25.4.1.3. Profitability by Market Segments 

            25.4.1.4. Sales Footprint

            25.4.1.5. SWOT Analysis

            25.4.1.6. Strategy Overview

                25.4.1.6.1. Product Strategy

                25.4.1.6.2. Channel Strategy

    25.5. RFM Corporation

            25.5.1.1. Overview

            25.5.1.2. Product Portfolio

            25.5.1.3. Profitability by Market Segments 

            25.5.1.4. Sales Footprint

            25.5.1.5. SWOT Analysis

            25.5.1.6. Strategy Overview

                25.5.1.6.1. Product Strategy

                25.5.1.6.2. Channel Strategy

    25.6. Grupo La Moderna

            25.6.1.1. Overview

            25.6.1.2. Product Portfolio

            25.6.1.3. Profitability by Market Segments 

            25.6.1.4. Sales Footprint

            25.6.1.5. SWOT Analysis

            25.6.1.6. Strategy Overview

                25.6.1.6.1. Product Strategy

                25.6.1.6.2. Channel Strategy

    25.7. General Mills, Inc.

            25.7.1.1. Overview

            25.7.1.2. Product Portfolio

            25.7.1.3. Profitability by Market Segments 

            25.7.1.4. Sales Footprint

            25.7.1.5. SWOT Analysis

            25.7.1.6. Strategy Overview

                25.7.1.6.1. Product Strategy

                25.7.1.6.2. Channel Strategy

    25.8. Pastas Gallo Company

            25.8.1.1. Overview

            25.8.1.2. Product Portfolio

            25.8.1.3. Profitability by Market Segments 

            25.8.1.4. Sales Footprint

            25.8.1.5. SWOT Analysis

            25.8.1.6. Strategy Overview

                25.8.1.6.1. Product Strategy

                25.8.1.6.2. Channel Strategy

    25.9. Bionaturae LLC.

            25.9.1.1. Overview

            25.9.1.2. Product Portfolio

            25.9.1.3. Profitability by Market Segments 

            25.9.1.4. Sales Footprint

            25.9.1.5. SWOT Analysis

            25.9.1.6. Strategy Overview

                25.9.1.6.1. Product Strategy

                25.9.1.6.2. Channel Strategy

    25.10. Windmill Organics

            25.10.1.1. Overview

            25.10.1.2. Product Portfolio

            25.10.1.3. Profitability by Market Segments 

            25.10.1.4. Sales Footprint

            25.10.1.5. SWOT Analysis

            25.10.1.6. Strategy Overview

                25.10.1.6.1. Product Strategy

                25.10.1.6.2. Channel Strategy

    Note: Above list is subjected to change during the course of study 

26. Assumptions and Acronyms Used

27. Research Methodology
Customize this Report

Let us know your requirement to get
100% FREE customization

List of Tables

Table 01: Global Vegan Pasta Historical Market Value (USD Mn) by Region, 2017–2021

Table 02: Global Vegan Pasta Market Value (USD Mn) Forecast by Region, 2022–2023

Table 03: Global Vegan Pasta Historical Market Value (USD Mn), by Category, 2017–2021

Table 04: Global Vegan Pasta Market Value (USD Mn) Forecast by Category 2022–2023

Table 05: Global Vegan Pasta Historical Market Value (USD Mn), by Nature, 2017–2021

Table 06: Global Vegan Pasta Market Value (USD Mn) Forecast by Nature 2022–2023

Table 07: Global Vegan Pasta Historical Market Value (USD Mn), by Source, 2017–2021

Table 08: Global Vegan Pasta Market Value (USD Mn) Forecast by Source, 2022–2023

Table 09: Global Vegan Pasta Historical Market Value (USD Mn), By Category, 2017–2021

Table 10: Global Vegan Pasta Market Value (USD Mn) Forecast By Category, 2022–2023

Table 11: Global Vegan Pasta Historical Market Value (USD Mn), by Packaging, 2017–2021

Table 12: Global Vegan Pasta Market Value (USD Mn) Forecast by Packaging, 2022–2023

Table 13: Global Vegan Pasta Historical Market Value (USD Mn), By Sales Channel, 2017–2021

Table 14: Global Vegan Pasta Market Value (USD Mn) Forecast By Sales Channel, 2022–2023

Table 15: North America Vegan Pasta Historical Market Value (USD Mn), by Category, 2017–2021

Table 16: North America Vegan Pasta Market Value (USD Mn) Forecast by Category 2022–2023

Table 17: North America Vegan Pasta Historical Market Value (USD Mn), by Nature, 2017–2021

Table 18: North America Vegan Pasta Market Value (USD Mn) Forecast by Nature 2022–2023

Table 19: North America Vegan Pasta Historical Market Value (USD Mn), by Source, 2017–2021

Table 20: North America Vegan Pasta Market Value (USD Mn) Forecast by Source, 2022–2023

Table 21: North America Vegan Pasta Historical Market Value (USD Mn), By Category, 2017–2021

Table 22: North America Vegan Pasta Market Value (USD Mn) Forecast By Category, 2022–2023

Table 23: North America Vegan Pasta Historical Market Value (USD Mn), by Packaging, 2017–2021

Table 24: North America Vegan Pasta Market Value (USD Mn) Forecast by Packaging, 2022–2023

Table 25: North America Vegan Pasta Historical Market Value (USD Mn), by Category, 2017–2021

Table 26: North America Vegan Pasta Market Value (USD Mn) Forecast by Category 2022–2023

Table 27: North America Vegan Pasta Historical Market Value (USD Mn), By Sales Channel, 2017–2021

Table 28: North America Vegan Pasta Market Value (USD Mn) Forecast By Sales Channel, 2022–2023

Table 29: North America Vegan Pasta Historical Market Value (USD Mn), by Country, 2017–2021

Table 30: North America Vegan Pasta Market Value (USD Mn) Forecast by Country, 2022–2023

Table 31: Latin America Vegan Pasta Historical Market Value (USD Mn), by Category, 2017–2021

Table 32: Latin America Vegan Pasta Market Value (USD Mn) Forecast by Category 2022–2023

Table 33: Latin America Vegan Pasta Historical Market Value (USD Mn), by Nature, 2017–2021

Table 34: Latin America Vegan Pasta Market Value (USD Mn) Forecast by Nature 2022–2023

Table 35: Latin America Vegan Pasta Historical Market Value (USD Mn), by Source, 2017–2021

Table 36: Latin America Vegan Pasta Market Value (USD Mn) Forecast by Source, 2022–2023

Table 37: Latin America Vegan Pasta Historical Market Value (USD Mn), By Category, 2017–2021

Table 38: Latin America Vegan Pasta Market Value (USD Mn) Forecast By Category, 2022–2023

Table 39: Latin America Vegan Pasta Historical Market Value (USD Mn), by Packaging, 2017–2021

Table 40: Latin America Vegan Pasta Market Value (USD Mn) Forecast by Packaging, 2022–2023

Table 41: Latin America Vegan Pasta Historical Market Value (USD Mn), By Sales Channel, 2017–2021

Table 42: Latin America Vegan Pasta Market Value (USD Mn) Forecast By Sales Channel, 2022–2023

Table 43: Latin America Vegan Pasta Historical Market Value (USD Mn), by Country, 2017–2021

Table 44: Latin America Vegan Pasta Market Value (USD Mn) Forecast by Country, 2022–2023

Table 45: Europe Vegan Pasta Historical Market Value (USD Mn), by Category, 2017–2021

Table 46: Europe Vegan Pasta Market Value (USD Mn) Forecast by Category 2022–2023

Table 47: Europe Vegan Pasta Historical Market Value (USD Mn), by Nature, 2017–2021

Table 48: Europe Vegan Pasta Market Value (USD Mn) Forecast by Nature 2022–2023

Table 49: Europe Vegan Pasta Historical Market Value (USD Mn), by Source, 2017–2021

Table 50: Europe Vegan Pasta Market Value (USD Mn) Forecast by Source, 2022–2023

Table 51: Europe Vegan Pasta Historical Market Value (USD Mn), By Category, 2017–2021

Table 52: Europe Vegan Pasta Market Value (USD Mn) Forecast By Category, 2022–2023

Table 53: Europe Vegan Pasta Historical Market Value (USD Mn), by Packaging, 2017–2021

Table 54:Europe Vegan Pasta Market Value (USD Mn) Forecast by Packaging, 2022–2023

Table 55: Europe Vegan Pasta Historical Market Value (USD Mn), By Sales Channel, 2017–2021

Table 56: Europe Vegan Pasta Market Value (USD Mn) Forecast By Sales Channel, 2022–2023

Table 57: Europe Vegan Pasta Historical Market Value (USD Mn), by Country, 2017–2021

Table 58: Europe Vegan Pasta Market Value (USD Mn) Forecast by Country, 2022–2023

Table 59: East Asia Vegan Pasta Historical Market Value (USD Mn), by Category, 2017–2021

Table 60: East Asia Vegan Pasta Market Value (USD Mn) Forecast by Category 2022–2023

Table 61: East Asia Vegan Pasta Historical Market Value (USD Mn), by Nature, 2017–2021

Table 62: East Asia Vegan Pasta Market Value (USD Mn) Forecast by Nature 2022–2023

Table 63: East Asia Vegan Pasta Historical Market Value (USD Mn), by Source, 2017–2021

Table 64: East Asia Vegan Pasta Market Value (USD Mn) Forecast by Source, 2022–2023

Table 65: East Asia Vegan Pasta Historical Market Value (USD Mn), By Category, 2017–2021

Table 66: East Asia Vegan Pasta Market Value (USD Mn) Forecast By Category, 2022–2023

Table 67: East Asia Vegan Pasta Historical Market Value (USD Mn), by Packaging, 2017–2021

Table 68: East Asia Vegan Pasta Market Value (USD Mn) Forecast by Packaging, 2022–2023

Table 69: East Asia Vegan Pasta Historical Market Value (USD Mn), By Sales Channel, 2017–2021

Table 70: East Asia Vegan Pasta Market Value (USD Mn) Forecast By Sales Channel, 2022–2023

Table 71: East Asia Vegan Pasta Historical Market Value (USD Mn), by Country, 2017–2021

Table 72: East Asia Vegan Pasta Market Value (USD Mn) Forecast by Country, 2022–2023

Table 73: South Asia Vegan Pasta Historical Market Value (USD Mn), by Category, 2017–2021

Table 74: South Asia Vegan Pasta Market Value (USD Mn) Forecast by Category 2022–2023

Table 75: South Asia Vegan Pasta Historical Market Value (USD Mn), by Nature, 2017–2021

Table 76: South Asia Vegan Pasta Market Value (USD Mn) Forecast by Nature 2022–2023

Table 77: South Asia Vegan Pasta Historical Market Value (USD Mn), by Source, 2017–2021

Table 78: South Asia Vegan Pasta Market Value (USD Mn) Forecast by Source, 2022–2023

Table 79: South Asia Vegan Pasta Historical Market Value (USD Mn), By Category, 2017–2021

Table 80: South Asia Vegan Pasta Market Value (USD Mn) Forecast By Category, 2022–2023

Table 81: South Asia Vegan Pasta Historical Market Value (USD Mn), by Packaging, 2017–2021

Table 82: South Asia Vegan Pasta Market Value (USD Mn) Forecast by Packaging, 2022–2023

Table 83: South Asia Vegan Pasta Historical Market Value (USD Mn), By Sales Channel, 2017–2021

Table 84: South Asia Vegan Pasta Market Value (USD Mn) Forecast By Sales Channel, 2022–2023

Table 85: South Asia Vegan Pasta Historical Market Value (USD Mn), by Country, 2017–2021

Table 86: South Asia Vegan Pasta Market Value (USD Mn) Forecast by Country, 2022–2023

Table 87: Oceania Vegan Pasta Historical Market Value (USD Mn), by Category, 2017–2021

Table 88: Oceania Vegan Pasta Market Value (USD Mn) Forecast by Category 2022–2023

Table 89: Oceania Vegan Pasta Historical Market Value (USD Mn), by Nature, 2017–2021

Table 90: Oceania Vegan Pasta Market Value (USD Mn) Forecast by Nature 2022–2023

Table 91: Oceania Vegan Pasta Historical Market Value (USD Mn), by Source, 2017–2021

Table 92: Oceania Vegan Pasta Market Value (USD Mn) Forecast by Source, 2022–2023

Table 93: Oceania Vegan Pasta Historical Market Value (USD Mn), By Category, 2017–2021

Table 94: Oceania Vegan Pasta Market Value (USD Mn) Forecast By Category, 2022–2023

Table 95: Oceania Vegan Pasta Historical Market Value (USD Mn), by Packaging, 2017–2021

Table 96: Oceania Vegan Pasta Market Value (USD Mn) Forecast by Packaging, 2022–2023

Table 97: Oceania Vegan Pasta Historical Market Value (USD Mn), By Sales Channel, 2017–2021

Table 98: Oceania Vegan Pasta Market Value (USD Mn) Forecast By Sales Channel, 2022–2023

Table 99: Oceania Vegan Pasta Historical Market Value (USD Mn), by Country, 2017–2021

Table 100: Oceania Vegan Pasta Market Value (USD Mn) Forecast by Country, 2022–2023

Table 101: MEA Vegan Pasta Historical Market Value (USD Mn), by Category, 2017–2021

Table 102: MEA Vegan Pasta Market Value (USD Mn) Forecast by Category 2022–2023

Table 103: MEA Vegan Pasta Historical Market Value (USD Mn), by Nature, 2017–2021

Table 104: MEA Vegan Pasta Market Value (USD Mn) Forecast by Nature 2022–2023

Table 105: MEA Vegan Pasta Historical Market Value (USD Mn), by Source, 2017–2021

Table 106: MEA Vegan Pasta Market Value (USD Mn) Forecast by Source, 2022–2023

Table 107: MEA Vegan Pasta Historical Market Value (USD Mn), By Category, 2017–2021

Table 108: MEA Vegan Pasta Market Value (USD Mn) Forecast By Category, 2022–2023

Table 109: MEA Vegan Pasta Historical Market Value (USD Mn), by Packaging, 2017–2021

Table 110: MEA Vegan Pasta Market Value (USD Mn) Forecast by Packaging, 2022–2023

Table 111: MEA Vegan Pasta Historical Market Value (USD Mn), By Sales Channel, 2017–2021

Table 112: MEA Vegan Pasta Market Value (USD Mn) Forecast By Sales Channel, 2022–2023

Table 113: MEA Vegan Pasta Historical Market Value (USD Mn), by Country, 2017–2021

Table 114: MEA Vegan Pasta Market Value (USD Mn) Forecast by Country, 2022–2023
Nandini Roy Choudhury
Principal Consultant
LinkedIn
Talk to Analyst

Find your sweet spots for generating winning opportunities in this market.

Talk to Analyst

List of Charts

Figure 01: Global Vegan Pasta Historic Market Value (USD Mn) Forecast, 2017–2021

Figure 02: Global Vegan Pasta Market Absolute Incremental Opportunity Forecast, 2022–2032

Figure 03: Global Vegan Pasta Market Value Share (%) and BPS Analysis by Region, 2017, 2022 & 2032

Figure 04: Global Vegan Pasta Market Y-o-Y Growth (%) Projections by Region, 2022-2032

Figure 05: North America Vegan Pasta Absolute $ Opportunity Analysis, 2022-2032

Figure 06: Latin America Vegan Pasta Absolute $ Opportunity Analysis, 2022-2032

Figure 07: Europe Vegan Pasta Absolute $ Opportunity Analysis, 2022-2032

Figure 08: East Asia Vegan Pasta Absolute $ Opportunity Analysis, 2022-2032

Figure 09: South Asia Vegan Pasta Absolute $ Opportunity Analysis, 2022-2032

Figure 10: Oceania Vegan Pasta Absolute $ Opportunity Analysis, 2022-2032

Figure 11: Middle East and Africa Vegan Pasta Absolute $ Opportunity Analysis, 2022-2032

Figure 12: Global Vegan Pasta Market Attractiveness Analysis by Region, 2022-2032

Figure 13: Global Vegan Pasta Market Value Share (%) and BPS Analysis by Category, 2017, 2022 & 2032

Figure 14: Global Vegan Pasta Market Value (USD Mn) Analysis by Category, 2022 & 2032

Figure 15: Global Vegan Pasta Market Incremental Value (USD Mn) by Category, 2017 to 2032

Figure 16: Global Vegan Pasta Market Attractiveness by Category, 2022 to 2032

Figure 17: Global Vegan Pasta Market Value Share (%) and BPS Analysis by Nature, 2017, 2022 & 2032

Figure 18: Global Vegan Pasta Market Value (USD Mn) Analysis by Nature, 2022 & 2032

Figure 19: Global Vegan Pasta Market Incremental Value (USD Mn) by Nature, 2017 to 2032

Figure 20: Global Vegan Pasta Market Attractiveness by Nature, 2022 to 2032

Figure 21: Global Vegan Pasta Market Value Share (%) and BPS Analysis by Source, 2017, 2022 & 2032

Figure 22: Global Vegan Pasta Market Value (USD Mn) Analysis by Source, 2022 & 2032

Figure 23: Global Vegan Pasta Market Incremental Value (USD Mn) by Source, 2017 to 2032

Figure 24: Global Vegan Pasta Market Attractiveness by Source, 2022 to 2032

Figure 25: Global Vegan Pasta Market Value Share (%) and BPS Analysis by Category, 2017, 2022 & 2032

Figure 26: Global Vegan Pasta Market Value (USD Mn) Analysis by Category, 2022 & 2032

Figure 27: Global Vegan Pasta Market Incremental Value (USD Mn) By Category, 2017 to 2032

Figure 28: Global Vegan Pasta Market Attractiveness by Category, 2022 to 2032

Figure 29: Global Vegan Pasta Market Value Share (%) and BPS Analysis by Packaging, 2017, 2022 & 2032

Figure 30: Global Vegan Pasta Market Value (USD Mn) Analysis by Packaging, 2022 & 2032

Figure 31: Global Vegan Pasta Market Incremental Value (USD Mn) by Packaging, 2017 to 2032

Figure 32: Global Vegan Pasta Market Attractiveness by Packaging, 2022 to 2032

Figure 33: Global Vegan Pasta Market Value Share (%) and BPS Analysis by Sales Channel, 2017, 2022 & 2032

Figure 34: Global Vegan Pasta Market Value (USD Mn) Analysis by Sales Channel, 2022 & 2032

Figure 35: Global Vegan Pasta Market Incremental Value (USD Mn) By Sales Channel, 2017 to 2032

Figure 36: Global Vegan Pasta Market Attractiveness by Sales Channel, 2022 to 2032

Figure 37: North America Vegan Pasta Market Value Share (%) and BPS Analysis by Country, 2017, 2022 & 2032

Figure 38: U.S. Vegan Pasta Market Value and Volume Analysis, 2017 -2032

Figure 39: Canada Vegan Pasta Absolute $ Opportunity Analysis, 2022-2032

Figure 40: U.S. Vegan Pasta Absolute $ Opportunity Analysis, 2022-2032

Figure 41: Canada Vegan Pasta Absolute $ Opportunity Analysis, 2022-2032

Figure 42: North America Vegan Pasta Market Value Share (%) and BPS Analysis by Category, 2017, 2022 & 2032

Figure 43: North America Vegan Pasta Market Y-o-Y Growth (%) Projections by Category, 2022-2032

Figure 44: North America Vegan Pasta Market Attractiveness, by Category, 2022-2032

Figure 45: North America Vegan Pasta Market Value Share (%) and BPS Analysis by Nature, 2017, 2022 & 2032

Figure 46: North America Vegan Pasta Market Y-o-Y Growth (%) Projections by Nature, 2022-2032

Figure 47: North America Vegan Pasta Market Attractiveness, by Nature, 2022-2032

Figure 48: North America Vegan Pasta Market Value Share (%) and BPS Analysis by Source, 2017, 2022 & 2032

Figure 49: North America Vegan Pasta Market Y-o-Y Growth (%) Projections by Source, 2022-2032

Figure 50: North America Vegan Pasta Market Attractiveness, by Source, 2022-2032

Figure 51: North America Vegan Pasta Market Value Share (%) and BPS Analysis by Category, 2017, 2022 & 2032

Figure 52: North America Vegan Pasta Market Y-o-Y Growth (%) Projections by Category, 2022-2032

Figure 53: North America Vegan Pasta Market Attractiveness, By Category, 2022-2032

Figure 54: North America Vegan Pasta Market Value Share (%) and BPS Analysis by Packaging, 2017, 2022 & 2032

Figure 55: North America Vegan Pasta Market Y-o-Y Growth (%) Projections by Packaging, 2022-2032

Figure 56: North America Vegan Pasta Market Attractiveness, by Packaging, 2022-2032

Figure 57: North America Vegan Pasta Market Value Share (%) and BPS Analysis by Sales Channel, 2017, 2022 & 2032

Figure 58: North America Vegan Pasta Market Y-o-Y Growth (%) Projections by Sales Channel, 2022-2032

Figure 59: North America Vegan Pasta Market Attractiveness, By Sales Channel, 2022-2032

Figure 60: Latin America Vegan Pasta Market Value Share (%) and BPS Analysis by Country, 2017, 2022 & 2032

Figure 61: Mexico Vegan Pasta Market Value and Volume Analysis, 2017 -2032

Figure 62: Brazil Vegan Pasta Absolute $ Opportunity Analysis, 2022-2032

Figure 63: Argentina Vegan Pasta Absolute $ Opportunity Analysis, 2022-2032

Figure 64: Chile Vegan Pasta Absolute $ Opportunity Analysis, 2022-2032

Figure 65: Rest of LA Vegan Pasta Absolute $ Opportunity Analysis, 2022-2032

Figure 66: Mexico Vegan Pasta Absolute $ Opportunity Analysis, 2022-2032

Figure 67: Brazil Vegan Pasta Absolute $ Opportunity Analysis, 2022-2032

Figure 68: Argentina Vegan Pasta Absolute $ Opportunity Analysis, 2022-2032

Figure 69: Chile Vegan Pasta Absolute $ Opportunity Analysis, 2022-2032

Figure 70: Rest of LA Vegan Pasta Absolute $ Opportunity Analysis, 2022-2032

Figure 71: Latin America Vegan Pasta Market Value Share (%) and BPS Analysis by Category, 2017, 2022 & 2032

Figure 72: Latin America Vegan Pasta Market Y-o-Y Growth (%) Projections by Category, 2022-2032

Figure 73: Latin America Vegan Pasta Market Attractiveness, by Category, 2022-2032

Figure 74: Latin America Vegan Pasta Market Value Share (%) and BPS Analysis by Nature, 2017, 2022 & 2032

Figure 75: Latin America Vegan Pasta Market Y-o-Y Growth (%) Projections by Nature, 2022-2032

Figure 76: Latin America Vegan Pasta Market Attractiveness, by Nature, 2022-2032

Figure 77: Latin America Vegan Pasta Market Value Share (%) and BPS Analysis by Source, 2017, 2022 & 2032

Figure 78: Latin America Vegan Pasta Market Y-o-Y Growth (%) Projections by Source, 2022-2032

Figure 79: Latin America Vegan Pasta Market Attractiveness, by Source, 2022-2032

Figure 80: Latin America Vegan Pasta Market Value Share (%) and BPS Analysis by Category, 2017, 2022 & 2032

Figure 81: Latin America Vegan Pasta Market Y-o-Y Growth (%) Projections by Category, 2022-2032

Figure 82: Latin America Vegan Pasta Market Attractiveness, By Category, 2022-2032

Figure 83: Latin America Vegan Pasta Market Value Share (%) and BPS Analysis by Packaging, 2017, 2022 & 2032

Figure 84: Latin America Vegan Pasta Market Y-o-Y Growth (%) Projections by Packaging, 2022-2032

Figure 85: Latin America Vegan Pasta Market Attractiveness, by Packaging, 2022-2032

Figure 86: Latin America Vegan Pasta Market Value Share (%) and BPS Analysis by Sales Channel, 2017, 2022 & 2032

Figure 87: Latin America Vegan Pasta Market Y-o-Y Growth (%) Projections by Sales Channel, 2022-2032

Figure 88: Latin America Vegan Pasta Market Attractiveness, By Sales Channel, 2022-2032

Figure 89: Europe Vegan Pasta Market Value Share (%) and BPS Analysis by Country, 2017, 2022 & 2032

Figure 90: EU-4 Vegan Pasta Market Value and Volume Analysis, 2017 -2032

Figure 91: U.K. Vegan Pasta Absolute $ Opportunity Analysis, 2022-2032

Figure 92: Nordic Vegan Pasta Absolute $ Opportunity Analysis, 2022-2032

Figure 93: Benelux Vegan Pasta Absolute $ Opportunity Analysis, 2022-2032

Figure 94: Poland Vegan Pasta Absolute $ Opportunity Analysis, 2022-2032

Figure 95: Russia Vegan Pasta Absolute $ Opportunity Analysis, 2022-2032

Figure 96: Rest of Europe Vegan Pasta Absolute $ Opportunity Analysis, 2022-2032

Figure 97: EU-4 Vegan Pasta Absolute $ Opportunity Analysis, 2022-2032

Figure 98: U.K. Vegan Pasta Absolute $ Opportunity Analysis, 2022-2032

Figure 99: Nordic Vegan Pasta Absolute $ Opportunity Analysis, 2022-2032

Figure 100: Benelux Vegan Pasta Absolute $ Opportunity Analysis, 2022-2032

Figure 101: Poland Vegan Pasta Absolute $ Opportunity Analysis, 2022-2032

Figure 102: Russia Vegan Pasta Absolute $ Opportunity Analysis, 2022-2032

Figure 103: Rest of Europe Vegan Pasta Absolute $ Opportunity Analysis, 2022-2032

Figure 104: Europe Vegan Pasta Market Value Share (%) and BPS Analysis by Category, 2017, 2022 & 2032

Figure 105: Europe Vegan Pasta Market Y-o-Y Growth (%) Projections by Category, 2022-2032

Figure 106: Europe Vegan Pasta Market Attractiveness, by Category, 2022-2032

Figure 107: Europe Vegan Pasta Market Value Share (%) and BPS Analysis by Nature, 2017, 2022 & 2032

Figure 108: Europe Vegan Pasta Market Y-o-Y Growth (%) Projections by Nature, 2022-2032

Figure 109: Europe Vegan Pasta Market Attractiveness, by Nature, 2022-2032

Figure 110: Europe Vegan Pasta Market Value Share (%) and BPS Analysis by Source, 2017, 2022 & 2032

Figure 111: Europe Vegan Pasta Market Y-o-Y Growth (%) Projections by Source, 2022-2032

Figure 112: Europe Vegan Pasta Market Attractiveness, by Source, 2022-2032

Figure 113: Europe Vegan Pasta Market Value Share (%) and BPS Analysis by Category, 2017, 2022 & 2032

Figure 114: Europe Vegan Pasta Market Y-o-Y Growth (%) Projections by Category, 2022-2032

Figure 115: Europe Vegan Pasta Market Attractiveness, By Category, 2022-2032

Figure 116: Europe Vegan Pasta Market Value Share (%) and BPS Analysis by Packaging, 2017, 2022 & 2032

Figure 117: Europe Vegan Pasta Market Y-o-Y Growth (%) Projections by Packaging, 2022-2032

Figure 118: Europe Vegan Pasta Market Attractiveness, by Packaging, 2022-2032

Figure 119: Europe Vegan Pasta Market Value Share (%) and BPS Analysis by Sales Channel, 2017, 2022 & 2032

Figure 120: Europe Vegan Pasta Market Y-o-Y Growth (%) Projections by Sales Channel, 2022-2032

Figure 121: Europe Vegan Pasta Market Attractiveness, By Sales Channel, 2022-2032

Figure 122: East Asia Vegan Pasta Market Value Share (%) and BPS Analysis by Country, 2017, 2022 & 2032

Figure 123: China Vegan Pasta Market Value and Volume Analysis, 2017 -2032

Figure 124: Japan Vegan Pasta Absolute $ Opportunity Analysis, 2022-2032

Figure 125: South Korea Vegan Pasta Absolute $ Opportunity Analysis, 2022-2032

Figure 126: China Vegan Pasta Absolute $ Opportunity Analysis, 2022-2032

Figure 127: Japan Vegan Pasta Absolute $ Opportunity Analysis, 2022-2032

Figure 128: South Korea Vegan Pasta Absolute $ Opportunity Analysis, 2022-2032

Figure 129: East Asia Vegan Pasta Market Value Share (%) and BPS Analysis by Category, 2017, 2022 & 2032

Figure 130: East Asia Vegan Pasta Market Y-o-Y Growth (%) Projections by Category, 2022-2032

Figure 131: East Asia Vegan Pasta Market Attractiveness, by Category, 2022-2032

Figure 132: East Asia Vegan Pasta Market Value Share (%) and BPS Analysis by Nature, 2017, 2022 & 2032

Figure 133: East Asia Vegan Pasta Market Y-o-Y Growth (%) Projections by Nature, 2022-2032

Figure 134: East Asia Vegan Pasta Market Attractiveness, by Nature, 2022-2032

Figure 135: East Asia Vegan Pasta Market Value Share (%) and BPS Analysis by Source, 2017, 2022 & 2032

Figure 136: East Asia Vegan Pasta Market Y-o-Y Growth (%) Projections by Source, 2022-2032

Figure 137: East Asia Vegan Pasta Market Attractiveness, by Source, 2022-2032

Figure 138: East Asia Vegan Pasta Market Value Share (%) and BPS Analysis by Category, 2017, 2022 & 2032

Figure 139: East Asia Vegan Pasta Market Y-o-Y Growth (%) Projections by Category, 2022-2032

Figure 140: East Asia Vegan Pasta Market Attractiveness, By Category, 2022-2032

Figure 141: East Asia Vegan Pasta Market Value Share (%) and BPS Analysis by Packaging, 2017, 2022 & 2032

Figure 142: East Asia Vegan Pasta Market Y-o-Y Growth (%) Projections by Packaging, 2022-2032

Figure 143: East Asia Vegan Pasta Market Attractiveness, by Packaging, 2022-2032

Figure 144: East Asia Vegan Pasta Market Value Share (%) and BPS Analysis by Sales Channel, 2017, 2022 & 2032

Figure 145: East Asia Vegan Pasta Market Y-o-Y Growth (%) Projections by Sales Channel, 2022-2032

Figure 146: East Asia Vegan Pasta Market Attractiveness, By Sales Channel, 2022-2032

Figure 147: South Asia Vegan Pasta Market Value Share (%) and BPS Analysis by Country, 2017, 2022 & 2032

Figure 148: India Vegan Pasta Market Value and Volume Analysis, 2017 -2032

Figure 149: Singapore Vegan Pasta Absolute $ Opportunity Analysis, 2022-2032

Figure 150: Indonesia Vegan Pasta Absolute $ Opportunity Analysis, 2022-2032

Figure 151: Thailand Vegan Pasta Absolute $ Opportunity Analysis, 2022-2032

Figure 152: Rest of SA Vegan Pasta Absolute $ Opportunity Analysis, 2022-2032

Figure 153: India Vegan Pasta Absolute $ Opportunity Analysis, 2022-2032

Figure 154: Singapore Vegan Pasta Absolute $ Opportunity Analysis, 2022-2032

Figure 155: Indonesia Vegan Pasta Absolute $ Opportunity Analysis, 2022-2032

Figure 156: Thailand Vegan Pasta Absolute $ Opportunity Analysis, 2022-2032

Figure 157: Rest of SA Vegan Pasta Absolute $ Opportunity Analysis, 2022-2032

Figure 158: South Asia Vegan Pasta Market Value Share (%) and BPS Analysis by Category, 2017, 2022 & 2032

Figure 159: South Asia Vegan Pasta Market Y-o-Y Growth (%) Projections by Category, 2022-2032

Figure 160: South Asia Vegan Pasta Market Attractiveness, by Category, 2022-2032

Figure 161: South Asia Vegan Pasta Market Value Share (%) and BPS Analysis by Nature, 2017, 2022 & 2032

Figure 162: South Asia Vegan Pasta Market Y-o-Y Growth (%) Projections by Nature, 2022-2032

Figure 163: South Asia Vegan Pasta Market Attractiveness, by Nature, 2022-2032

Figure 164: South Asia Vegan Pasta Market Value Share (%) and BPS Analysis by Source, 2017, 2022 & 2032

Figure 165: South Asia Vegan Pasta Market Y-o-Y Growth (%) Projections by Source, 2022-2032

Figure 166: South Asia Vegan Pasta Market Attractiveness, by Source, 2022-2032

Figure 167: South Asia Vegan Pasta Market Value Share (%) and BPS Analysis by Category, 2017, 2022 & 2032

Figure 168: South Asia Vegan Pasta Market Y-o-Y Growth (%) Projections by Category, 2022-2032

Figure 169: South Asia Vegan Pasta Market Attractiveness, By Category, 2022-2032

Figure 170: South Asia Vegan Pasta Market Value Share (%) and BPS Analysis by Packaging, 2017, 2022 & 2032

Figure 171: South Asia Vegan Pasta Market Y-o-Y Growth (%) Projections by Packaging, 2022-2032

Figure 172: South Asia Vegan Pasta Market Attractiveness, by Packaging, 2022-2032

Figure 173: South Asia Vegan Pasta Market Value Share (%) and BPS Analysis by Sales Channel, 2017, 2022 & 2032

Figure 174: South Asia Vegan Pasta Market Y-o-Y Growth (%) Projections by Sales Channel, 2022-2032

Figure 175: South Asia Vegan Pasta Market Attractiveness, By Sales Channel, 2022-2032

Figure 176: Oceania Vegan Pasta Market Value Share (%) and BPS Analysis by Country, 2017, 2022 & 2032

Figure 177: Australia Vegan Pasta Market Value and Volume Analysis, 2017 -2032

Figure 178: New Zealand Vegan Pasta Absolute $ Opportunity Analysis, 2022-2032

Figure 179: Australia Vegan Pasta Absolute $ Opportunity Analysis, 2022-2032

Figure 180: New Zealand Vegan Pasta Absolute $ Opportunity Analysis, 2022-2032

Figure 181: Oceania Vegan Pasta Market Value Share (%) and BPS Analysis by Category, 2017, 2022 & 2032

Figure 182: Oceania Vegan Pasta Market Y-o-Y Growth (%) Projections by Category, 2022-2032

Figure 183: Oceania Vegan Pasta Market Attractiveness, by Category, 2022-2032

Figure 184: Oceania Vegan Pasta Market Value Share (%) and BPS Analysis by Nature, 2017, 2022 & 2032

Figure 185: Oceania Vegan Pasta Market Y-o-Y Growth (%) Projections by Nature, 2022-2032

Figure 186: Oceania Vegan Pasta Market Attractiveness, by Nature, 2022-2032

Figure 187: Oceania Vegan Pasta Market Value Share (%) and BPS Analysis by Source, 2017, 2022 & 2032

Figure 188: Oceania Vegan Pasta Market Y-o-Y Growth (%) Projections by Source, 2022-2032

Figure 189: Oceania Vegan Pasta Market Attractiveness, by Source, 2022-2032

Figure 190: Oceania Vegan Pasta Market Value Share (%) and BPS Analysis by Category, 2017, 2022 & 2032

Figure 191: Oceania Vegan Pasta Market Y-o-Y Growth (%) Projections by Category, 2022-2032

Figure 192: Oceania Vegan Pasta Market Attractiveness, By Category, 2022-2032

Figure 193: Oceania Vegan Pasta Market Value Share (%) and BPS Analysis by Packaging, 2017, 2022 & 2032

Figure 194: Oceania Vegan Pasta Market Y-o-Y Growth (%) Projections by Packaging, 2022-2032

Figure 195: Oceania Vegan Pasta Market Attractiveness, by Packaging, 2022-2032

Figure 196: Oceania Vegan Pasta Market Value Share (%) and BPS Analysis by Sales Channel, 2017, 2022 & 2032

Figure 197: Oceania Vegan Pasta Market Y-o-Y Growth (%) Projections by Sales Channel, 2022-2032

Figure 198: Oceania Vegan Pasta Market Attractiveness, By Sales Channel, 2022-2032

Figure 199: MEA Vegan Pasta Market Value Share (%) and BPS Analysis by Country, 2017, 2022 & 2032

Figure 200: Turkey Vegan Pasta Market Value and Volume Analysis, 2017 -2032

Figure 201: Iran Vegan Pasta Absolute $ Opportunity Analysis, 2022-2032

Figure 202: GCC Countries Vegan Pasta Absolute $ Opportunity Analysis, 2022-2032

Figure 203: South Africa Vegan Pasta Absolute $ Opportunity Analysis, 2022-2032

Figure 204: Rest of MEA Vegan Pasta Absolute $ Opportunity Analysis, 2022-2032

Figure 205: Turkey Vegan Pasta Absolute $ Opportunity Analysis, 2022-2032

Figure 206: Iran Vegan Pasta Absolute $ Opportunity Analysis, 2022-2032

Figure 207: GCC Countries Vegan Pasta Absolute $ Opportunity Analysis, 2022-2032

Figure 208: South Africa Vegan Pasta Absolute $ Opportunity Analysis, 2022-2032

Figure 209: Rest of MEA Vegan Pasta Absolute $ Opportunity Analysis, 2022-2032

Figure 210: MEA Vegan Pasta Market Value Share (%) and BPS Analysis by Category, 2017, 2022 & 2032

Figure 211: MEA Vegan Pasta Market Y-o-Y Growth (%) Projections by Category, 2022-2032

Figure 212: MEA Vegan Pasta Market Attractiveness, by Category, 2022-2032

Figure 213: MEA Vegan Pasta Market Value Share (%) and BPS Analysis by Nature, 2017, 2022 & 2032

Figure 214: MEA Vegan Pasta Market Y-o-Y Growth (%) Projections by Nature, 2022-2032

Figure 215: MEA Vegan Pasta Market Attractiveness, by Nature, 2022-2032

Figure 216: MEA Vegan Pasta Market Value Share (%) and BPS Analysis by Source, 2017, 2022 & 2032

Figure 217: MEA Vegan Pasta Market Y-o-Y Growth (%) Projections by Source, 2022-2032

Figure 218: MEA Vegan Pasta Market Attractiveness, by Source, 2022-2032

Figure 219: MEA Vegan Pasta Market Value Share (%) and BPS Analysis by Category, 2017, 2022 & 2032

Figure 220: MEA Vegan Pasta Market Y-o-Y Growth (%) Projections by Category, 2022-2032

Figure 221: MEA Vegan Pasta Market Attractiveness, By Category, 2022-2032

Figure 222: MEA Vegan Pasta Market Value Share (%) and BPS Analysis by Packaging, 2017, 2022 & 2032

Figure 223: MEA Vegan Pasta Market Y-o-Y Growth (%) Projections by Packaging, 2022-2032

Figure 224: MEA Vegan Pasta Market Attractiveness, by Packaging, 2022-2032

Figure 225: MEA Vegan Pasta Market Value Share (%) and BPS Analysis by Sales Channel, 2017, 2022 & 2032

Figure 226: MEA Vegan Pasta Market Y-o-Y Growth (%) Projections by Sales Channel, 2022-2032

Figure 227: MEA Vegan Pasta Market Attractiveness, By Sales Channel, 2022-2032

Need specific information?

Request Customization

Explore Food and Beverage Insights

View Reports

Recommendations

Food and Beverage

Vegan Dressing Market

Published : June 2022

Food and Beverage

Vegan Butter Market

Published : March 2022

Food and Beverage

Vegan Vitamins and Supplements Market

Published : June 2020

Food and Beverage

Vegan Cheese Market

Published : February 2022

Google translate