Vegan Confectionery Market Size and Share Forecast Outlook 2025 to 2035

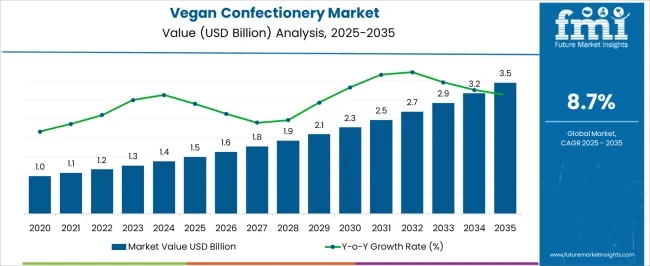
The global vegan confectionery market is projected to reach USD 1.5 billion in 2025 and will likely expand to USD 3.6 billion by 2035, advancing at a CAGR of 9.1% over the forecast period. In 2025, the broader global confectionery market is estimated at USD 270 billion, positioning vegan offerings at just 0.6% share.
Quick-Stats for Vegan Confectionery Market

  • Largest Segment by Product: Vegan Chocolate 45%
  • Largest Segment by Distribution Channel: Retail - 42.5%
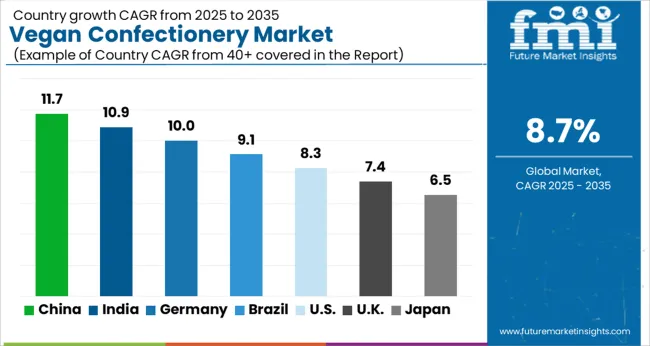
  • Fastest Growing Country: United Kingdom - 10.3% CAGR
  • Slowest Growing Major Market: United States - 6.8% CAGR

Vegan Confectionery Market

Attribute Values
Estimated Industry Size (2025E) USD 1.5 billion
Projected Industry Value (2035F) USD 3.6 billion
CAGR (2025 to 2035) 9.1%

This marginal share reflects both the nascency of plant-based alternatives in indulgence categories and the structural lag in mainstream retail adoption despite rising ethical and health-conscious consumption. Rising health awareness, ethical consumerism, and mainstreaming of plant-based diets continue to reshape the global confectionery landscape. Vegan confectionery, once a niche, has transitioned into a scalable growth segment, driven by demand for dairy-free, gelatin-free, and allergen-light alternatives.

While chocolate bars lead product innovation, growth is supported by expanded retail distribution, upgraded labeling, and cleaner formulations. However, the segment still faces headwinds in scaling beyond early adopters, with a 0.6% share of the total confectionery market in 2025 reflecting limited mass-market penetration despite double-digit growth in select European regions.

Vegan Confectionery Market Analysis by Key Investment Segments

The market is segmented into Product; Distribution Channel; and Region. By Product: Chocolate, Sugar, and Flour. By Distribution Channel: Offline and Online. By Region: North America; Latin America; Western Europe; Eastern Europe; South Asia & Pacific; East Asia; Middle East & Africa.
By Product, Chocolate Segment will Continue to Lead with 45% Market Share

Vegan Confectionery Market By Product

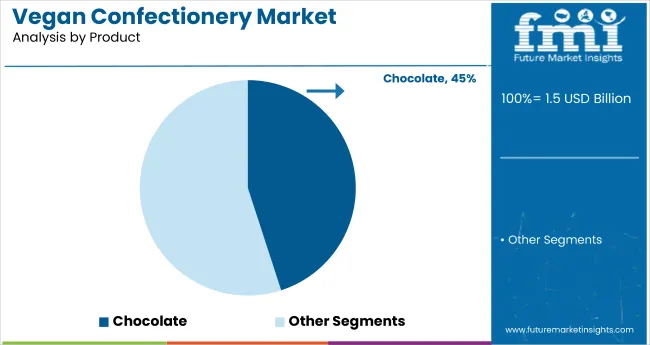
Chocolate will dominate the global vegan confectionery market in 2025 with a 45% share. The segment benefits from strong consumer familiarity, a broad product mix, ranging from bars to truffles, and high visibility in both premium and mass-market retail formats.

Growth has been driven by increased demand for dairy-free indulgence and accelerated SKU expansion across dark, nut-based, and filled variants. Friction remains in the form of elevated production costs and fragmented cocoa supply, which pressure margins in price-sensitive regions.

The hidden disruptor lies in visual design: confectionery brands offering uniquely shaped chocolate products report 2.8x higher repurchase intent, reinforcing customer retention in an impulse-driven category.
  • 45% share held by Chocolate segment in 2025
  • 2.8x repurchase uplift from design-led chocolate formats

By Distribution Channel, Offline Leads with Nearly 73% Market Share

Vegan Confectionery Market By Distribution Channel

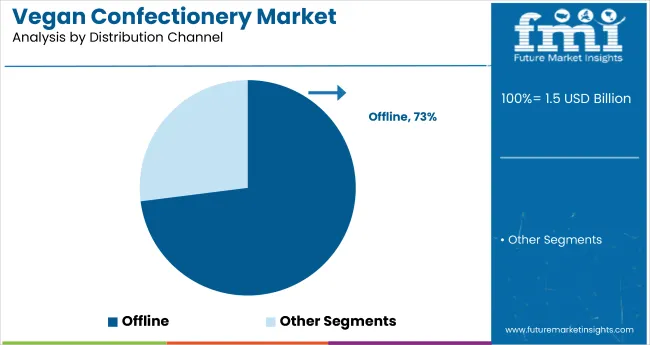
Offline retail formats will account for 73% of global vegan confectionery sales in 2025, cementing their dominance over online alternatives. Supermarkets, specialty health stores, and convenience outlets continue to drive volume through impulse-driven placement, brand visibility, and consumer trust in physical verification.

Two levers are driving this change - widespread presence of vegan SKUs in mainstream grocery chains, and strong tie-ins with seasonal promotions and in-store sampling. However, the channel faces pressure from rising D2C sales and shifting discovery patterns on social media platforms.

The disruptor is shelf adjacency, vegan confectionery placed next to conventional sweets sees a 2.1x higher purchase rate versus isolated placement, suggesting the key to conversion lies not in segmentation, but in seamless substitution.
  • 73% share held by Offline channel in 2025
  • 2.1x higher purchase rate from integrated shelf placement

Vegan Confectionery Market Analysis by Top Countries

Country Wise Analysis Of Vegan Confectionery Market

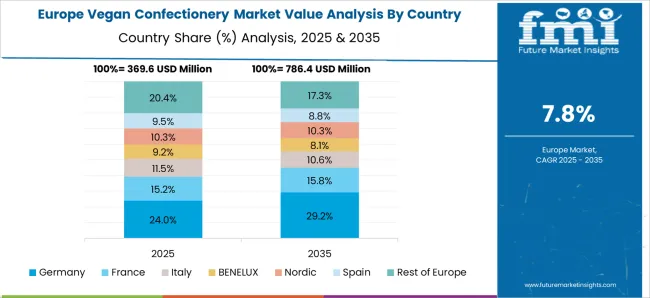
The vegan confectionery market exhibits varied momentum across countries, shaped by cultural food norms, retail infrastructure, and consumer awareness of plant-based alternatives. Western Europe remains the most progressive cluster, driven by ethical consumption patterns and strong retail penetration of dairy-free and gelatin-free products.

The United Kingdom and BENELUX have emerged as early movers, while Germany continues to lead on clean-label preferences. In North America, market expansion is tempered by price sensitivity and mature chocolate categories, whereas Australia reflects a balanced shift driven by health and sustainability narratives. Overall, national growth trajectories remain tied to availability, visibility, and reformulation of traditional confectionery into vegan equivalents.
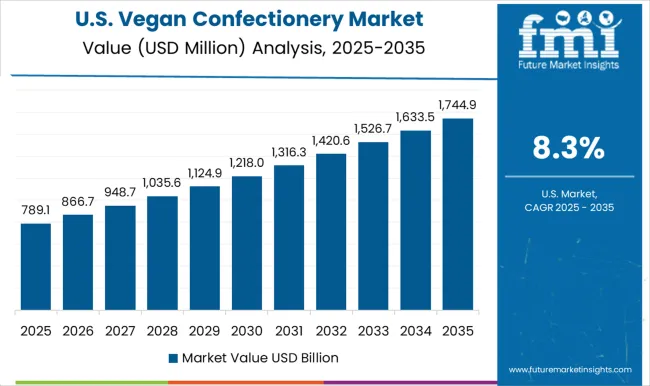
United States Vegan Confectionery Market Analysis

The USA vegan confectionery market is projected to reach USD 235.8 million in 2025 and grow to approximately USD 452 million by 2035, reflecting a CAGR of 6.8%. Growth remains steady but moderate, limited by high price elasticity in mainstream segments and saturation in traditional chocolate formats.

Margins benefit from expanded plant-based portfolios in urban supermarkets, but drag factors include limited consumer awareness outside core wellness-driven regions and inconsistent labeling standards. Offline retail accounts for the majority of volume, yet online platforms are gaining traction among younger demographics.

According to a 2025 FMI consumer survey, 48% of USA respondents expressed willingness to try vegan sweets, but only 21% reported consistent repurchase, signaling a gap between trial and conversion, often driven by perceived taste compromises.

  • Market size in 2025: USD 235.8 million
  • Forecast CAGR (2025 to 2035): 6.8%
  • 48% USA consumers open to trying vegan sweets; 21% repurchase rate (FMI Survey, 2025)

Demand for Vegan Confectionery in United Kingdom Continues to be Steady

Demand for vegan Confectionery in the UK is estimated at USD 148.6 million in 2025 and is expected to exceed USD 395.3 million by 2035, registering a CAGR of 10.3%. Growth is driven by a sharp shift toward plant-based indulgence, supported by well-established ethical consumption patterns and early reformulation efforts by major brands.

Margins are expanding as private labels and legacy confectioners introduce vegan SKUs with no compromise on taste or mouthfeel. Retail channels dominate, aided by clear on-pack vegan labeling and sustained in-store promotion. Regulatory clarity and retailer mandates have also accelerated shelf-space reallocation.

A 2025 FMI consumer poll found that 56% of UK shoppers consider ethical sourcing when buying sweets, with 38% indicating they prefer vegan confectionery over traditional options-indicating higher baseline acceptance compared to other markets.
  • Market size in 2025: USD 148.6 million
  • Forecast CAGR (2025 to 2035): 10.3%
  • 38% of UK consumers prefer vegan over traditional sweets (FMI Survey, 2025)

Germany Vegan Confectionery Demand Analysis

Germany’s vegan confectionery market is projected to reach USD 132.9 million in 2025 and grow to USD 323.3 million by 2035, expanding at a CAGR of 9.2%. Growth is underpinned by strong health-conscious consumer behavior, high demand for clean-label alternatives, and dense distribution through drugstores and organic food chains.

Margin expansion is supported by efficient domestic production and ingredient traceability, while drag persists in smaller cities where traditional sweets still dominate. Offline channels maintain majority share, although online retailers targeting wellness shoppers are steadily gaining ground.

According to a 2025 FMI survey, 41% of German consumers actively seek vegan confectionery due to health reasons, with 29% citing ingredient transparency as a key purchase factor-highlighting the market’s shift toward informed, purpose-driven consumption.

  • Market size in 2025: USD 132.9 million
  • Forecast CAGR (2025 to 2035): 9.2%
  • 41% of consumers prefer vegan confectionery for health; 29% value ingredient clarity (FMI Survey, 2025)

Australia Vegan Confectionery Sales Analysis

Australia’s vegan confectionery market is estimated at USD 87.2 million in 2025 and is projected to reach USD 177.8 million by 2035, growing at a CAGR of 7.4%. Growth is driven by rising public awareness around animal welfare, clean-eating habits, and increased availability of plant-based SKUs in supermarkets and specialty stores.

Margins benefit from premium product positioning and health-led marketing, but uptake is constrained by higher unit prices and limited rural penetration. Offline retail remains dominant, though online platforms have seen rising interest among younger and urban consumers seeking variety.

A 2025 FMI survey revealed that 36% of Australian consumers are likely to buy vegan sweets if labeled as palm-oil-free and allergen-friendly, indicating that label transparency plays a crucial role in shopper decision-making.
  • Market size in 2025: USD 87.2 million
  • Forecast CAGR (2025 to 2035): 7.4%
  • 36% of consumers prefer allergen-free, palm-oil-free vegan sweets (FMI Survey, 2025)

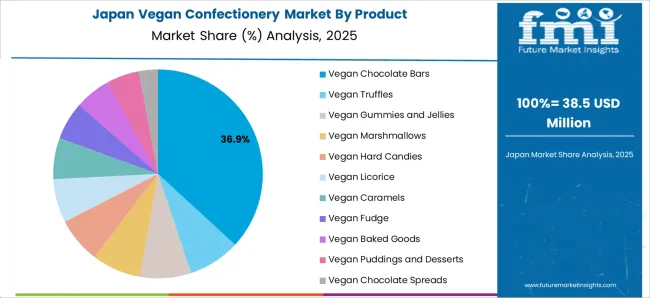
Japan Vegan Confectionery Market Outlook

Japan’s vegan confectionery market is forecast to reach USD 65.4 million in 2025 and is expected to grow to USD 141.4 million by 2035, reflecting a CAGR of 8%. Growth is shaped by rising lactose intolerance awareness, premiumization of plant-based indulgence, and limited but growing interest in ethical consumption among younger demographics.

Margin uplift is supported by small-batch, locally sourced innovations, especially in matcha, mochi, and bean-based confections, yet the category faces friction due to low baseline awareness and unclear vegan labeling in traditional retail channels. Department stores and health food outlets continue to lead physical distribution, while e-commerce accounts for a growing share in metro regions.

According to a 2025 FMI consumer survey, 32% of Japanese respondents reported trying vegan sweets in the past year, but only 14% recognized “vegan” as a distinct product label-indicating latent demand but poor market signaling.
  • Market size in 2025: USD 65.4 million (FMI, 2025)
  • Forecast CAGR (2025 to 2035): 8.0% (FMI, 2025)
  • 14% of consumers aware of vegan labeling; 32% have tried vegan sweets (FMI Survey, 2025)

Vegan Confectionery Market Players and their Strategies

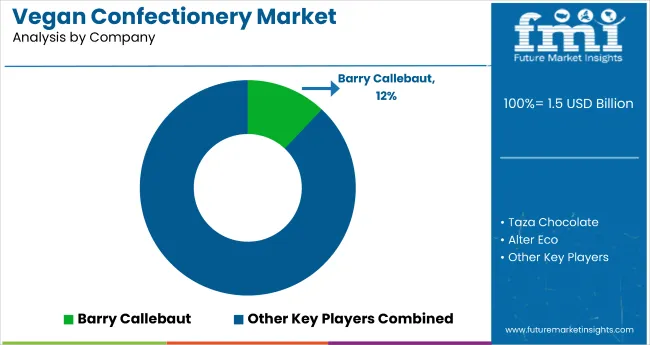
Vegan Confectionery Market By Company

The players in the vegan confectionery market are focusing on product reformulation, packaging design, and retail partnerships to widen reach and strengthen consumer loyalty. Established confectioners such as Mondelez and Nestlé have introduced dairy-free variants under core brands, while newer entrants like NOMO and Goodio are leveraging niche positioning and allergen-free claims to capture health-conscious segments.

Recent expansion by Hershey and Unilever into vegan SKUs reflects increased competition in mainstream grocery. In contrast, smaller players such as Endorfin and Alter Eco have invested in limited-edition, high-cacao, low-sugar offerings tailored to ethical and wellness-focused shoppers. Manufacturing capacity upgrades are underway across Western Europe, particularly in BENELUX and the UK, where vegan labeling and clean ingredients drive shelf-space advantage.

Over the next three years, winners will be those who can balance indulgence with label clarity and price accessibility. Late entrants without reformulated portfolios or retailer backing may struggle to secure visibility in crowded snack aisles.

  • 18% of global vegan confectionery sales are led by top five multinationals
  • 62% of new vegan chocolate SKUs launched in 2023-24 were under 100g packaging (FMI, 2025)

Vegan Confectionery Industry News

  • In October 2024, Hershey showcased several innovations, including some relevant to the broader "better-for-you" trend that often aligns with plant-based preferences. They highlighted the continued importance of the Reese's brand, which had introduced plant-based options in the preceding months. This indicates their strategy to expand their portfolio with options catering to various dietary needs, including plant-based products.
  • Kraft Heinz debuted its first plant-based dessert, JELL-O Oat Milk Chocolate Pudding, now available in USA retailers, catering to the growing demand for dairy-free desserts

Key Players

  • Mondelez International
  • Hershey Company
  • Nestlé
  • Barry Callebaut
  • Taza Chocolate
  • Alter Eco
  • Unreal Snacks
  • Endangered Species Chocolate, LLC
  • Equal Exchange
  • ChocoladefabrikenLindt & Sprüngli AG
  • Go Max Go Foods
  • No Whey Foods
  • Moo Free Chocolates
  • Divine Chocolate
  • Hu Kitchen
  • Lily's Sweets
  • Montezuma's
  • Plamil Foods
  • Schmilk Chocolate
  • Dylan's Candy Bar
  • Endorfin Foods
  • Goodio
  • Freedom Confectionery

Report Scope Table

Attribute Details
Market Name Vegan Confectionery Market
Base Year 2024
Historical Data 2020 to 2024
Forecast Period 2025 to 2035
2025 Market Size USD 1.5 billion
2035 Market Size USD 3.6 billion
CAGR (2025to 2035) 9.1%
Forecast Units Value (USD Million)
Segments Covered By Product, By Distribution Channel
Product Segments Chocolate, Sugar, Flour
Distribution Channels Offline, Online
Regions Covered North America, Latin America, Western Europe, Eastern Europe, South Asia & Pacific, East Asia, Middle East & Africa
Key Countries Covered United States, United Kingdom, Germany, Australia, Japan, and 40+ others
Key Players Profiled Mondelez, Nestlé, Hershey, Taza Chocolate, NOMO, Alter Eco, Freedom Confectionery, Goodio, Dylan's Candy Bar, and others
Report Coverage Market size, CAGR, segment shares, country-wise analysis, competitive landscape, consumer survey insights

Key Segments

By Product:

  • Vegan Chocolate Bars
  • Vegan Truffles
  • Vegan Gummies and Jellies
  • Vegan Marshmallows
  • Vegan Hard Candies
  • Vegan Licorice
  • Vegan Caramels
  • Vegan Fudge
  • Vegan Baked Goods
  • Vegan Puddings and Desserts
  • Vegan Chocolate Spreads

By Distribution Channel:

  • Food Service (HoReCa, Bakeries & Patisseries)
  • Airport Retail
  • Travel Retail (airplanes, Cruise ships)
  • Retail
    • Hypermarkets/Supermarkets
    • Convenience Stores
    • Departmental Stores
    • Wholesale Stores
    • Independent Retailers
    • Specialty Stores
  • Online Retailers

By Region:

  • North America
  • Europe
  • Asia Pacific
  • Latin America
  • The Middle East & Africa

Table of Content

  1. Executive Summary
    • Global Market Outlook
    • Demand-side Trends
    • Supply-side Trends
    • Technology Roadmap Analysis
    • Analysis and Recommendations
  2. Market Overview
    • Market Coverage/Taxonomy
    • Market Definition/Scope/Limitations
  3. Market Background
    • Market Dynamics
      • Drivers
      • Restraints
      • Opportunity
      • Trends
    • Scenario Forecast
      • Demand in Optimistic Scenario
      • Demand in Likely Scenario
      • Demand in Conservative Scenario
    • Opportunity Map Analysis
    • Product Life Cycle Analysis
    • Supply Chain Analysis
      • Supply Side Participants and their Roles
        • Producers
        • Mid-Level Participants (Traders/ Agents/ Brokers)
        • Wholesalers and Distributors
      • Value Added and Value Created at Node in the Supply Chain
      • List of Raw Material Suppliers
      • List of Existing and Potential Buyer’s
    • Investment Feasibility Matrix
    • Value Chain Analysis
      • Profit Margin Analysis
      • Wholesalers and Distributors
      • Retailers
    • PESTLE and Porter’s Analysis
    • Regulatory Landscape
      • By Key Regions
      • By Key Countries
    • Regional Parent Market Outlook
    • Production and Consumption Statistics
    • Import and Export Statistics
  4. Global Market Analysis 2020 to 2024 and Forecast, 2025 to 2035
    • Historical Market Size Value (USD Million) & Volume (Metric Tons) Analysis, 2020 to 2024
    • Current and Future Market Size Value (USD Million) & Volume (Metric Tons) Projections, 2025 to 2035
      • Y-o-Y Growth Trend Analysis
      • Absolute $ Opportunity Analysis
  5. Global Market Pricing Analysis 2020 to 2024 and Forecast 2025 to 2035
  6. Global Market Analysis 2020 to 2024 and Forecast 2025 to 2035, By Product
    • Introduction/Key Findings
    • Historical Market Size Value (USD Million) & Volume (Metric Tons) Analysis By Product, 2020 to 2024
    • Current and Future Market Size Value (USD Million) & Volume (Metric Tons) Analysis and Forecast By Product, 2025 to 2035
      • Chocolate
      • Sugar
      • Flour
    • Y-o-Y Growth Trend Analysis By Product, 2020 to 2024
    • Absolute $ Opportunity Analysis By Product, 2025 to 2035
  7. Global Market Analysis 2020 to 2024 and Forecast 2025 to 2035, By Distribution Channel
    • Introduction/Key Findings
    • Historical Market Size Value (USD Million) & Volume (Metric Tons) Analysis By Distribution Channel, 2020 to 2024
    • Current and Future Market Size Value (USD Million) & Volume (Metric Tons) Analysis and Forecast By Distribution Channel, 2025 to 2035
      • Offline
        • Online
      • Online
    • Y-o-Y Growth Trend Analysis By Distribution Channel, 2020 to 2024
    • Absolute $ Opportunity Analysis By Distribution Channel, 2025 to 2035
  8. Global Market Analysis 2020 to 2024 and Forecast 2025 to 2035, By Region
    • Introduction
    • Historical Market Size Value (USD Million) & Volume (Metric Tons) Analysis By Region, 2020 to 2024
    • Current Market Size Value (USD Million) & Volume (Metric Tons) Analysis and Forecast By Region, 2025 to 2035
      • North America
      • Latin America
      • Western Europe
      • Eastern Europe
      • East Asia
      • South Asia & Pacific
      • Middle East and Africa
    • Market Attractiveness Analysis By Region
  9. North America Market Analysis 2020 to 2024 and Forecast 2025 to 2035, By Country
    • Historical Market Size Value (USD Million) & Volume (Metric Tons) Trend Analysis By Market Taxonomy, 2020 to 2024
    • Market Size Value (USD Million) & Volume (Metric Tons) Forecast By Market Taxonomy, 2025 to 2035
      • By Country
        • USA
        • Canada
        • Mexico
      • By Product
      • By Distribution Channel
    • Market Attractiveness Analysis
      • By Country
      • By Product
      • By Distribution Channel
    • Key Takeaways
  10. Latin America Market Analysis 2020 to 2024 and Forecast 2025 to 2035, By Country
    • Historical Market Size Value (USD Million) & Volume (Metric Tons) Trend Analysis By Market Taxonomy, 2020 to 2024
    • Market Size Value (USD Million) & Volume (Metric Tons) Forecast By Market Taxonomy, 2025 to 2035
      • By Country
        • Brazil
        • Argentina
        • Rest of LATAM
      • By Product
      • By Distribution Channel
    • Market Attractiveness Analysis
      • By Country
      • By Product
      • By Distribution Channel
    • Key Takeaways
  11. Western Europe Market Analysis 2020 to 2024 and Forecast 2025 to 2035, By Country
    • Historical Market Size Value (USD Million) & Volume (Metric Tons) Trend Analysis By Market Taxonomy, 2020 to 2024
    • Market Size Value (USD Million) & Volume (Metric Tons) Forecast By Market Taxonomy, 2025 to 2035
      • By Country
        • Germany
        • Italy
        • France
        • UK
        • Spain
        • BENELUX
        • Nordic
        • Rest of W.Europe
      • By Product
      • By Distribution Channel
    • Market Attractiveness Analysis
      • By Country
      • By Product
      • By Distribution Channel
    • Key Takeaways
  12. Eastern Europe Market Analysis 2020 to 2024 and Forecast 2025 to 2035, By Country
    • Historical Market Size Value (USD Million) & Volume (Metric Tons) Trend Analysis By Market Taxonomy, 2020 to 2024
    • Market Size Value (USD Million) & Volume (Metric Tons) Forecast By Market Taxonomy, 2025 to 2035
      • By Country
        • Russia
        • Hungary
        • Poland
        • Balkan & Baltics
        • Rest of E. Europe
      • By Product
      • By Distribution Channel
    • Market Attractiveness Analysis
      • By Country
      • By Product
      • By Distribution Channel
    • Key Takeaways
  13. East Asia Market Analysis 2020 to 2024 and Forecast 2025 to 2035, By Country
    • Historical Market Size Value (USD Million) & Volume (Metric Tons) Trend Analysis By Market Taxonomy, 2020 to 2024
    • Market Size Value (USD Million) & Volume (Metric Tons) Forecast By Market Taxonomy, 2025 to 2035
      • By Country
        • China
        • Japan
        • South Korea
      • By Product
      • By Distribution Channel
    • Market Attractiveness Analysis
      • By Country
      • By Product
      • By Distribution Channel
    • Key Takeaways
  14. South Asia & Pacific Market Analysis 2020 to 2024 and Forecast 2025 to 2035, By Country
    • Historical Market Size Value (USD Million) & Volume (Metric Tons) Trend Analysis By Market Taxonomy, 2020 to 2024
    • Market Size Value (USD Million) & Volume (Metric Tons) Forecast By Market Taxonomy, 2025 to 2035
      • By Country
        • India
        • Australia & New Zealand
        • ASEAN
        • Rest of SAP
      • By Product
      • By Distribution Channel
    • Market Attractiveness Analysis
      • By Country
      • By Product
      • By Distribution Channel
    • Key Takeaways
  15. Middle East and Africa Market Analysis 2020 to 2024 and Forecast 2025 to 2035, By Country
    • Historical Market Size Value (USD Million) & Volume (Metric Tons) Trend Analysis By Market Taxonomy, 2020 to 2024
    • Market Size Value (USD Million) & Volume (Metric Tons) Forecast By Market Taxonomy, 2025 to 2035
      • By Country
        • GCC Countries
        • Northern Africa
        • South Africa
        • Turkiye
        • Rest of MEA
      • By Product
      • By Distribution Channel
    • Market Attractiveness Analysis
      • By Country
      • By Product
      • By Distribution Channel
    • Key Takeaways
  16. Key Countries Market Analysis
    • USA
      • Pricing Analysis
      • Market Share Analysis, 2024
        • By Product
        • By Distribution Channel
    • Canada
      • Pricing Analysis
      • Market Share Analysis, 2024
        • By Product
        • By Distribution Channel
    • Brazil
      • Pricing Analysis
      • Market Share Analysis, 2024
        • By Product
        • By Distribution Channel
    • Mexico
      • Pricing Analysis
      • Market Share Analysis, 2024
        • By Product
        • By Distribution Channel
    • Argentina
      • Pricing Analysis
      • Market Share Analysis, 2024
        • By Product
        • By Distribution Channel
  17. Market Structure Analysis
    • Competition Dashboard
    • Competition Benchmarking
    • Market Share Analysis of Top Players
      • By Regional
      • By Product
      • By Distribution Channel
  18. Competition Analysis
    • Competition Deep Dive
      • Taza Chocolate
        • Overview
        • Product Portfolio
        • Profitability by Market Segments (Product/Age /Sales Channel/Region)
        • Sales Footprint
        • Strategy Overview
          • Marketing Strategy
          • Product Strategy
          • Channel Strategy
      • Alter Eco
        • Overview
        • Product Portfolio
        • Profitability by Market Segments (Product/Age /Sales Channel/Region)
        • Sales Footprint
        • Strategy Overview
          • Marketing Strategy
          • Product Strategy
          • Channel Strategy
      • Endangered Species Chocolate, LLC
        • Overview
        • Product Portfolio
        • Profitability by Market Segments (Product/Age /Sales Channel/Region)
        • Sales Footprint
        • Strategy Overview
          • Marketing Strategy
          • Product Strategy
          • Channel Strategy
      • EQUAL EXCHANGE COOP
        • Overview
        • Product Portfolio
        • Profitability by Market Segments (Product/Age /Sales Channel/Region)
        • Sales Footprint
        • Strategy Overview
          • Marketing Strategy
          • Product Strategy
          • Channel Strategy
      • Chocoladefabriken Lindt & Sprüngli AG
        • Overview
        • Product Portfolio
        • Profitability by Market Segments (Product/Age /Sales Channel/Region)
        • Sales Footprint
        • Strategy Overview
          • Marketing Strategy
          • Product Strategy
          • Channel Strategy
      • Mondelēz International
        • Overview
        • Product Portfolio
        • Profitability by Market Segments (Product/Age /Sales Channel/Region)
        • Sales Footprint
        • Strategy Overview
          • Marketing Strategy
          • Product Strategy
          • Channel Strategy
      • Dylan's Candy Bar
        • Overview
        • Product Portfolio
        • Profitability by Market Segments (Product/Age /Sales Channel/Region)
        • Sales Footprint
        • Strategy Overview
          • Marketing Strategy
          • Product Strategy
          • Channel Strategy
      • Endorfin
        • Overview
        • Product Portfolio
        • Profitability by Market Segments (Product/Age /Sales Channel/Region)
        • Sales Footprint
        • Strategy Overview
          • Marketing Strategy
          • Product Strategy
          • Channel Strategy
      • Goodio
        • Overview
        • Product Portfolio
        • Profitability by Market Segments (Product/Age /Sales Channel/Region)
        • Sales Footprint
        • Strategy Overview
          • Marketing Strategy
          • Product Strategy
          • Channel Strategy
      • Freedom Confectionery
        • Overview
        • Product Portfolio
        • Profitability by Market Segments (Product/Age /Sales Channel/Region)
        • Sales Footprint
        • Strategy Overview
          • Marketing Strategy
          • Product Strategy
          • Channel Strategy
      • Creative Natural Products, Inc.
        • Overview
        • Product Portfolio
        • Profitability by Market Segments (Product/Age /Sales Channel/Region)
        • Sales Footprint
        • Strategy Overview
          • Marketing Strategy
          • Product Strategy
          • Channel Strategy
  19. Assumptions & Acronyms Used
  20. Research Methodology

List of Tables

  • Table 1: Global Market Value (USD Million) Forecast by Region, 2020-2035
  • Table 2: Global Market Volume (Metric Tons) Forecast by Region, 2020-2035
  • Table 3: Global Market Value (USD Million) Forecast by Product, 2020-2035
  • Table 4: Global Market Volume (Metric Tons) Forecast by Product, 2020-2035
  • Table 5: Global Market Value (USD Million) Forecast by Distribution Channel, 2020-2035
  • Table 6: Global Market Volume (Metric Tons) Forecast by Distribution Channel, 2020-2035
  • Table 7: North America Market Value (USD Million) Forecast by Country, 2020-2035
  • Table 8: North America Market Volume (Metric Tons) Forecast by Country, 2020-2035
  • Table 9: North America Market Value (USD Million) Forecast by Product, 2020-2035
  • Table 10: North America Market Volume (Metric Tons) Forecast by Product, 2020-2035
  • Table 11: North America Market Value (USD Million) Forecast by Distribution Channel, 2020-2035
  • Table 12: North America Market Volume (Metric Tons) Forecast by Distribution Channel, 2020-2035
  • Table 13: Latin America Market Value (USD Million) Forecast by Country, 2020-2035
  • Table 14: Latin America Market Volume (Metric Tons) Forecast by Country, 2020-2035
  • Table 15: Latin America Market Value (USD Million) Forecast by Product, 2020-2035
  • Table 16: Latin America Market Volume (Metric Tons) Forecast by Product, 2020-2035
  • Table 17: Latin America Market Value (USD Million) Forecast by Distribution Channel, 2020-2035
  • Table 18: Latin America Market Volume (Metric Tons) Forecast by Distribution Channel, 2020-2035
  • Table 19: Western Europe Market Value (USD Million) Forecast by Country, 2020-2035
  • Table 20: Western Europe Market Volume (Metric Tons) Forecast by Country, 2020-2035
  • Table 21: Western Europe Market Value (USD Million) Forecast by Product, 2020-2035
  • Table 22: Western Europe Market Volume (Metric Tons) Forecast by Product, 2020-2035
  • Table 23: Western Europe Market Value (USD Million) Forecast by Distribution Channel, 2020-2035
  • Table 24: Western Europe Market Volume (Metric Tons) Forecast by Distribution Channel, 2020-2035
  • Table 25: Eastern Europe Market Value (USD Million) Forecast by Country, 2020-2035
  • Table 26: Eastern Europe Market Volume (Metric Tons) Forecast by Country, 2020-2035
  • Table 27: Eastern Europe Market Value (USD Million) Forecast by Product, 2020-2035
  • Table 28: Eastern Europe Market Volume (Metric Tons) Forecast by Product, 2020-2035
  • Table 29: Eastern Europe Market Value (USD Million) Forecast by Distribution Channel, 2020-2035
  • Table 30: Eastern Europe Market Volume (Metric Tons) Forecast by Distribution Channel, 2020-2035
  • Table 31: East Asia Market Value (USD Million) Forecast by Country, 2020-2035
  • Table 32: East Asia Market Volume (Metric Tons) Forecast by Country, 2020-2035
  • Table 33: East Asia Market Value (USD Million) Forecast by Product, 2020-2035
  • Table 34: East Asia Market Volume (Metric Tons) Forecast by Product, 2020-2035
  • Table 35: East Asia Market Value (USD Million) Forecast by Distribution Channel, 2020-2035
  • Table 36: East Asia Market Volume (Metric Tons) Forecast by Distribution Channel, 2020-2035
  • Table 37: South Asia & Pacific Market Value (USD Million) Forecast by Country, 2020-2035
  • Table 38: South Asia & Pacific Market Volume (Metric Tons) Forecast by Country, 2020-2035
  • Table 39: South Asia & Pacific Market Value (USD Million) Forecast by Product, 2020-2035
  • Table 40: South Asia & Pacific Market Volume (Metric Tons) Forecast by Product, 2020-2035
  • Table 41: South Asia & Pacific Market Value (USD Million) Forecast by Distribution Channel, 2020-2035
  • Table 42: South Asia & Pacific Market Volume (Metric Tons) Forecast by Distribution Channel, 2020-2035
  • Table 43: Middle East and Africa Market Value (USD Million) Forecast by Country, 2020-2035
  • Table 44: Middle East and Africa Market Volume (Metric Tons) Forecast by Country, 2020-2035
  • Table 45: Middle East and Africa Market Value (USD Million) Forecast by Product, 2020-2035
  • Table 46: Middle East and Africa Market Volume (Metric Tons) Forecast by Product, 2020-2035
  • Table 47: Middle East and Africa Market Value (USD Million) Forecast by Distribution Channel, 2020-2035
  • Table 48: Middle East and Africa Market Volume (Metric Tons) Forecast by Distribution Channel, 2020-2035

List of Figures

  • Figure 1: Global Market Volume (Metric Tons) Forecast 2020-2035
  • Figure 2: Global Market Pricing Analysis
  • Figure 3: Global Market Value (USD Million) Forecast 2020-2035
  • Figure 4: Global Market Value Share and BPS Analysis by Product, 2025 and 2035
  • Figure 5: Global Market Y-o-Y Growth Comparison by Product, 2025-2035
  • Figure 6: Global Market Attractiveness Analysis by Product
  • Figure 7: Global Market Value Share and BPS Analysis by Distribution Channel, 2025 and 2035
  • Figure 8: Global Market Y-o-Y Growth Comparison by Distribution Channel, 2025-2035
  • Figure 9: Global Market Attractiveness Analysis by Distribution Channel
  • Figure 10: Global Market Value (USD Million) Share and BPS Analysis by Region, 2025 and 2035
  • Figure 11: Global Market Y-o-Y Growth Comparison by Region, 2025-2035
  • Figure 12: Global Market Attractiveness Analysis by Region
  • Figure 13: North America Market Incremental $ Opportunity, 2025-2035
  • Figure 14: Latin America Market Incremental $ Opportunity, 2025-2035
  • Figure 15: Western Europe Market Incremental $ Opportunity, 2025-2035
  • Figure 16: Eastern Europe Market Incremental $ Opportunity, 2025-2035
  • Figure 17: East Asia Market Incremental $ Opportunity, 2025-2035
  • Figure 18: South Asia & Pacific Market Incremental $ Opportunity, 2025-2035
  • Figure 19: Middle East and Africa Market Incremental $ Opportunity, 2025-2035
  • Figure 20: North America Market Value Share and BPS Analysis by Country, 2025 and 2035
  • Figure 21: North America Market Value Share and BPS Analysis by Product, 2025 and 2035
  • Figure 22: North America Market Y-o-Y Growth Comparison by Product, 2025-2035
  • Figure 23: North America Market Attractiveness Analysis by Product
  • Figure 24: North America Market Value Share and BPS Analysis by Distribution Channel, 2025 and 2035
  • Figure 25: North America Market Y-o-Y Growth Comparison by Distribution Channel, 2025-2035
  • Figure 26: North America Market Attractiveness Analysis by Distribution Channel
  • Figure 27: Latin America Market Value Share and BPS Analysis by Country, 2025 and 2035
  • Figure 28: Latin America Market Value Share and BPS Analysis by Product, 2025 and 2035
  • Figure 29: Latin America Market Y-o-Y Growth Comparison by Product, 2025-2035
  • Figure 30: Latin America Market Attractiveness Analysis by Product
  • Figure 31: Latin America Market Value Share and BPS Analysis by Distribution Channel, 2025 and 2035
  • Figure 32: Latin America Market Y-o-Y Growth Comparison by Distribution Channel, 2025-2035
  • Figure 33: Latin America Market Attractiveness Analysis by Distribution Channel
  • Figure 34: Western Europe Market Value Share and BPS Analysis by Country, 2025 and 2035
  • Figure 35: Western Europe Market Value Share and BPS Analysis by Product, 2025 and 2035
  • Figure 36: Western Europe Market Y-o-Y Growth Comparison by Product, 2025-2035
  • Figure 37: Western Europe Market Attractiveness Analysis by Product
  • Figure 38: Western Europe Market Value Share and BPS Analysis by Distribution Channel, 2025 and 2035
  • Figure 39: Western Europe Market Y-o-Y Growth Comparison by Distribution Channel, 2025-2035
  • Figure 40: Western Europe Market Attractiveness Analysis by Distribution Channel
  • Figure 41: Eastern Europe Market Value Share and BPS Analysis by Country, 2025 and 2035
  • Figure 42: Eastern Europe Market Value Share and BPS Analysis by Product, 2025 and 2035
  • Figure 43: Eastern Europe Market Y-o-Y Growth Comparison by Product, 2025-2035
  • Figure 44: Eastern Europe Market Attractiveness Analysis by Product
  • Figure 45: Eastern Europe Market Value Share and BPS Analysis by Distribution Channel, 2025 and 2035
  • Figure 46: Eastern Europe Market Y-o-Y Growth Comparison by Distribution Channel, 2025-2035
  • Figure 47: Eastern Europe Market Attractiveness Analysis by Distribution Channel
  • Figure 48: East Asia Market Value Share and BPS Analysis by Country, 2025 and 2035
  • Figure 49: East Asia Market Value Share and BPS Analysis by Product, 2025 and 2035
  • Figure 50: East Asia Market Y-o-Y Growth Comparison by Product, 2025-2035
  • Figure 51: East Asia Market Attractiveness Analysis by Product
  • Figure 52: East Asia Market Value Share and BPS Analysis by Distribution Channel, 2025 and 2035
  • Figure 53: East Asia Market Y-o-Y Growth Comparison by Distribution Channel, 2025-2035
  • Figure 54: East Asia Market Attractiveness Analysis by Distribution Channel
  • Figure 55: South Asia & Pacific Market Value Share and BPS Analysis by Country, 2025 and 2035
  • Figure 56: South Asia & Pacific Market Value Share and BPS Analysis by Product, 2025 and 2035
  • Figure 57: South Asia & Pacific Market Y-o-Y Growth Comparison by Product, 2025-2035
  • Figure 58: South Asia & Pacific Market Attractiveness Analysis by Product
  • Figure 59: South Asia & Pacific Market Value Share and BPS Analysis by Distribution Channel, 2025 and 2035
  • Figure 60: South Asia & Pacific Market Y-o-Y Growth Comparison by Distribution Channel, 2025-2035
  • Figure 61: South Asia & Pacific Market Attractiveness Analysis by Distribution Channel
  • Figure 62: Middle East and Africa Market Value Share and BPS Analysis by Country, 2025 and 2035
  • Figure 63: Middle East and Africa Market Value Share and BPS Analysis by Product, 2025 and 2035
  • Figure 64: Middle East and Africa Market Y-o-Y Growth Comparison by Product, 2025-2035
  • Figure 65: Middle East and Africa Market Attractiveness Analysis by Product
  • Figure 66: Middle East and Africa Market Value Share and BPS Analysis by Distribution Channel, 2025 and 2035
  • Figure 67: Middle East and Africa Market Y-o-Y Growth Comparison by Distribution Channel, 2025-2035
  • Figure 68: Middle East and Africa Market Attractiveness Analysis by Distribution Channel
  • Figure 69: Global Market - Tier Structure Analysis
  • Figure 70: Global Market - Company Share Analysis

Frequently Asked Questions

What is the market size of the vegan confectionery market in 2025?

The global vegan confectionery market is expected to reach USD 1.5 billion in 2025.

What is the projected value of the vegan confectionery market by 2035?

The vegan confectionery market is forecast to grow to USD 3.6 billion by 2035.

What is the CAGR of the vegan confectionery market from 2025 to 2035?

The market is anticipated to expand at a CAGR of 9.1% between 2025 and 2035.

Which is the largest product category in the vegan confectionery market?

Chocolate leads the vegan confectionery market with a 45.0% revenue share in 2025.

Which distribution channel has the highest share in the vegan confectionery market?

Offline retail dominates with a 73.0% share of global vegan confectionery sales in 2025.

Which country offers the strongest growth in the vegan confectionery market?

The United Kingdom is expected to register the highest country-level CAGR during the forecast period.

Who are the leading companies in the vegan confectionery market?

Key players include Mondelez, Nestlé, Hershey, NOMO, Taza Chocolate, Alter Eco, and Freedom Confectionery.

Explore Similar Insights

Future Market Insights

Vegan Confectionery Market