Reports

- Global Locations -

Headquarters

Future Market Insights, Inc.

Christiana Corporate, 200
Continental Drive, Suite 401,
Newark, Delaware - 19713,
United States

T: +1-845-579-5705

Americas

Future Market Insights, Inc.

616 Corporate Way, Suite 2-9018,
Valley Cottage, NY 10989, United States

T: +1-347-918-3531

MEA

Future Market Insights

1602-6 Jumeirah Bay X2 Tower, Plot No: JLT-PH2-X2A,
Jumeirah Lakes Towers, Dubai,
United Arab Emirates

Europe

Future Market Insights

3rd Floor, 207 Regent Street,
W1B 3HH London
United Kingdom

T: + 44 (0) 20 8123 9659
D: +44 (0) 20 3287 4268

Asia Pacific

Future Market Insights

IndiaLand Global Tech Park, Unit UG-1, Behind Grand HighStreet, Phase 1, Hinjawadi, MH, Pune – 411057, India

Vegan Casing Market Outlook (2022 to 2032)

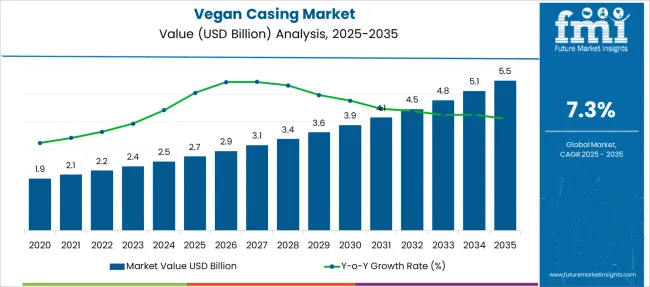
The vegan casing market share is valued at US$ 2.2 Billion in 2022 and is projected to grow at a CAGR of 7.3% during the forecast period, to reach a value of US$ 4.4 Billion by 2032. Newly released data from Future Market Insights market analysis shows that global vegan casing demand is projected to grow year-on-year (Y-o-Y) growth of 6.6% in 2022.

Attributes Details
Vegan Casing Market Size 2022 USD 2.2 Billion
Vegan Casing Market Forecast 2032 USD 4.4 Billion
Vegan Casing Market CAGR (2022 to 2032) 7.3% CAGR
Vegan Casing Market Forecast Period 2022 to 2032
Collective Value Share: Top 3 Countries (2021A) 46.2%

Demand for the vegan casing is likely to rise as the number of people who consume plant-based goods has expanded significantly, and brands are creating exceptional edible veggie casing to fulfill this current need.

The vegan casing is a fantastic plant-based casing created specifically for vegetarian and vegan recipes, which is anticipated to increase the vegan casing market size during the forecast period from 2022 to 2032.

It has special properties, such as gluten-free, GMO-free, and allergen-free, and addresses many health issues. As it is 100% vegetable, it is a better option for sausages with religious, legal, or labeling constraints. This leads to enlarging the adoption of vegan casing in the marketplace.

Don't pay for what you don't need

Customize your report by selecting specific countries or regions and save 30%!

2017 to 2021 Vegan Casing Market Outlook Compared To 2022 to 2032 Forecast

Vegan casing demand grew at 8.9% CAGR between 2017 and 2021. The vegan casing can be used for both raw and cooked applications. This is a ready-to-use case, offered in a stick format that is easy to pack and manage. Due to this factor, the sales of vegan casing are likely to rise in the market.

It works with meat filling and processing equipment. There is no need to peel the casing because it is edible, and it improves sensory qualities while also providing a structure to the final product & it is estimated to grow the vegan casing market trends & forecast in the coming year as per the vegan casing market report.

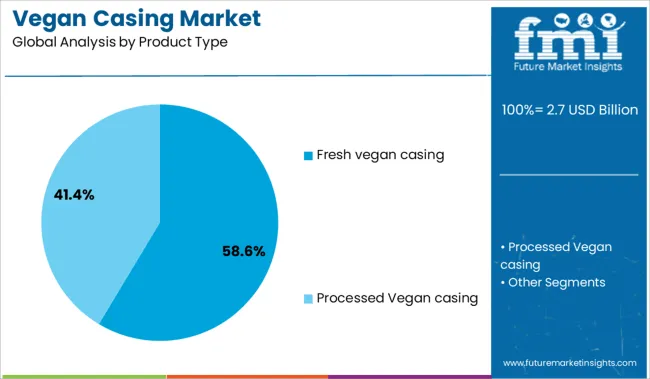
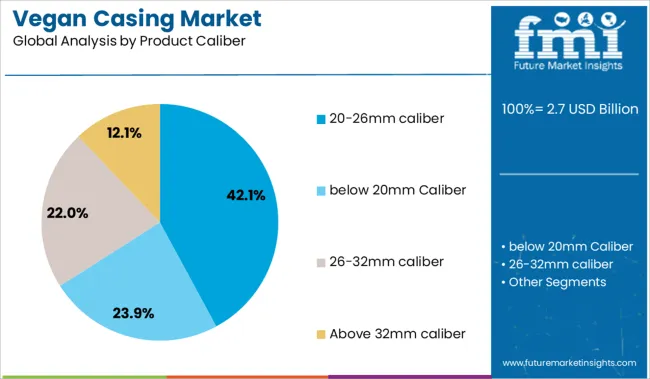
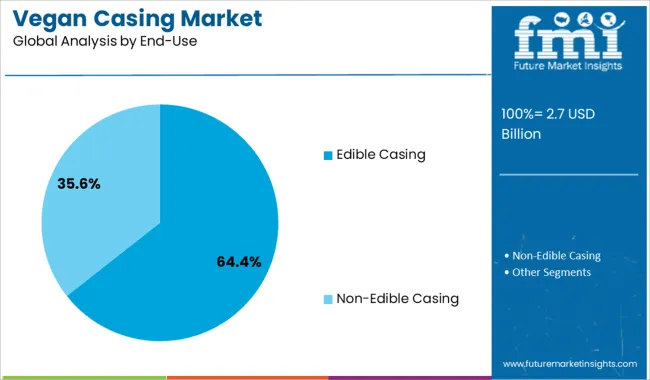
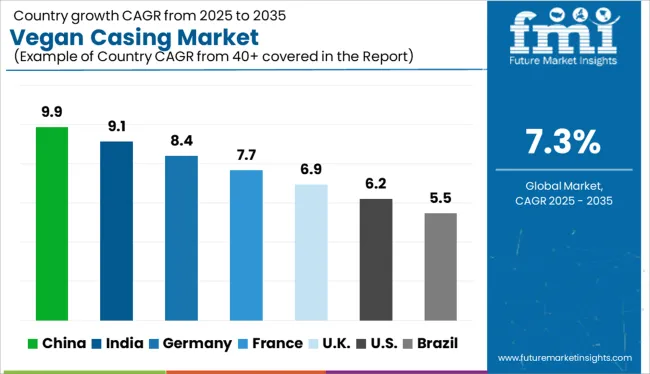
Recent research has revolutionized the industry over the period and is further projected to grow at a CAGR worth 7.7% in the forecast year of 2022 to 2032. The vegan casing market, along with fresh vegan casing, 20-26mm Caliber, edible casings as end use, and B2C sales channel segments, are projected to reflect a favorable growth outlook in terms of revenue, according to the vegan casing market analysis conducted by Future Market Insights.
Vegan Casing Market

Country-Wise Insights

Used As Alternate Collagen films, Vegan Casing Sales Is Growing in the USA

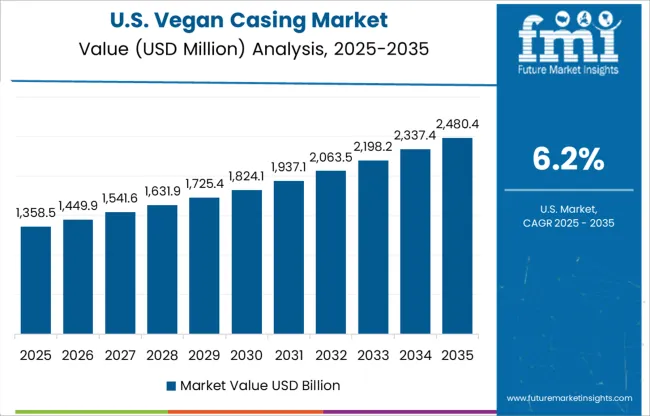
Halal and Kosher-compliant vegan casings are in demand in the USA, which are also suitable for vegetarians. The products come with no artificial coloring and are used as an alternative to collagen films, which have excellent machine-ability to be filled up with sausages. The products are also free from all known allergens and have non-GMO and GRAS status.
Super Tender and Good Frying Properties Propelling Vegan Casing Demand in Spain

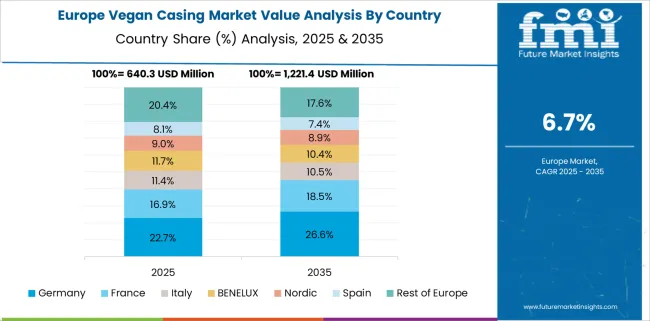
The demand for vegan casing in Spain is appropriate for both raw and cooked applications, with excellent frying characteristics and a super-tender bite. The ready-to-use case from Viscofan Group is delivered on a stick style that is easy to stuff and handle, just like the other edible casings in the market, which is likely to increase the adoption of vegan casing in the country.

The product does not concern with animal-based illness or contributes to cross-species contamination and comes with no artificial coloring, which is likely to increase the sales of vegan casing in the market.

Vegan Casing Sales Are Surging in the United Kingdom with Algae Casing

Brands like Weschenfelder Direct Ltd drive the United Kingdom vegan casing market size with an edible vegan casing made from polysaccharides, a water-soluble component, and a unique alternative to collagen, cellulose, and natural sausage casing.

The product ingredient is abundantly available and renewable as well. Products available from the company come in a wide range of diameters, including 17mm to 32mm, along with 20mm, 23mm, and 24mm in between. The wide range of product categories is anticipated to boost the sales of vegan casing in the coming year.

Nandini Roy Choudhury

Principal Consultant

Talk to Analyst

Find your sweet spots for generating winning opportunities in this market.

Category-Wise Insights

All-Rounder Application in Vegetarian and Meat Products Propelling Vegan Casing Demand

Demand for the vegan casing is increasing as it is likely suitable with fresh, smoked & cooked, and dry-cured sausage products. The vegan casing is composed of entirely non-animal-based polymers with unique textures and appearances, which do not affect the nutritional profile of the main product.

As this remarkable plant-based casing is 100% vegetable, it is not just for consumers who eat a 100% vegetable-based diet but also for non-vegetarian people who value these types of products even more, which increases the production of vegan casing market growth in the coming year.

Though the product was created with vegetarian and vegan dishes in mind, it can also be used in meat items because of its all-rounding characteristics, which raise the production of vegan casing products and increase the vegan casing statistics during the forecast period from 2022 to 2032.

Competitive Landscape

Key vegan casing manufacturers that are looking to capture the market in the adoption of the vegan casing with joint ventures, partnerships, mergers, and acquisitions while keeping up with research for innovative product lines supported by governments.

Due to all these tactics & methodologies, the industries are going to achieve the goal of rising in the vegan casing market trends during the forecast period.

These are the top Vegan Casing brands that are focusing on upgraded and modified products with rising demand for new formulations from the food and beverage industry, which has increased over time with vegan casing consumption among all populations. These factors are growing vegan casing market key trends & opportunities in the coming forecast period from 2022 to 2032.

For instance:

  • In 2019, Hydrosol introduced ‘SmartCasings’ for classic, vegetarian, and vegan sausage, which are suitable for raw sausage, fresh bratwurst, and scalded sausage. The product is highly tear-resistant and gives a pleasantly soft bite with raw sausages.

Get the data you need at a Fraction of the cost

Personalize your report by choosing insights you need
and save 40%!

Scope Of Report

Attributes Details
Market Size Value in 2022 US$ 2.2 Billion
Market Forecast Value in 2032 US$ 4.4 Billion
Global Growth Rate 7.3% CAGR
Forecast Period 2022 to 2032
Historical Data Available for 2017 to 2021
Market Analysis MT for Volume and USD Billion for Value
Key Regions Covered North America, Latin America, Europe, East Asia, South Asia, Oceania, and Middle East and Africa
Key Countries Covered USA, Canada, Brazil, Mexico, Argentina, Chile, Peru, Germany, France, Italy, Spain, United Kingdom, Netherlands, Belgium, Nordic, Russia, Poland, China, Japan, South Korea, India, Thailand, Malaysia, Indonesia, Singapore, Australia, New Zealand, GCC Countries, South Africa, Central Africa, and others
Key Market Segments Covered Product Type, Product Caliber, End Use, Sales Channel, and Regions
Key Companies Profiled
  • Euroduna Food Ingredients GmbH
  • Weschenfelder Direct Ltd
  • Dunninghams Ltd
  • Viscofan Group
  • The Sausage Maker Inc.
  • Kalle GmbH
  • Ruitenberg Ingredients B.V.
  • PROMAR Sp. z o. o
  • Nutra Produkte AG
  • Ennio International
  • Sonjal Casing® (SOREAL)
  • Smoked and Cured
  • Ascona Foods Group
  • High Caliber Products
  • Suzy Spoon's
  • Others
Pricing Available upon Request

Vegan Casing Market By Category

By Product Type:

  • Fresh
  • Processed

By Product Caliber:

  • Below 20mm Caliber
  • 20-26mm Caliber
  • 26-32mm Caliber
  • Above 32mm Caliber

By End Use:

  • Edible Casings
  • Non-edible Casings

By Sales Channel:

  • B2B / HoReCa
  • B2C
    • Hypermarkets /Supermarkets
    • Convenience Stores
    • Food Specialty Stores
    • Online Retail
    • Others Retail Formats

By Region:

  • North America
  • Latin America
  • Europe
  • East Asia
  • South Asia
  • Oceania
  • Middle East & Africa

Frequently Asked Questions

How much worth is the Vegan Casing Industry?

The vegan casing market is estimated to reach sales of nearly USD 2.2 Billion by 2022.

At what CAGR is the Market Expected to Expand through 2032?

Vegan casing market revenue is expected to increase at a CAGR of around 7.3% during the period 2022 to 2032.

How was the Performance of Vegan Casing over the past half-decade?

Vegan casing sales increased a CAGR of around 6.4% over the past half-decade.

What will be the Market for Vegan Casing worth in 2032?

The global vegan casing market value will be around USD 4.4 Billion in 2032.

Who are the Key Players Operating in the Market?

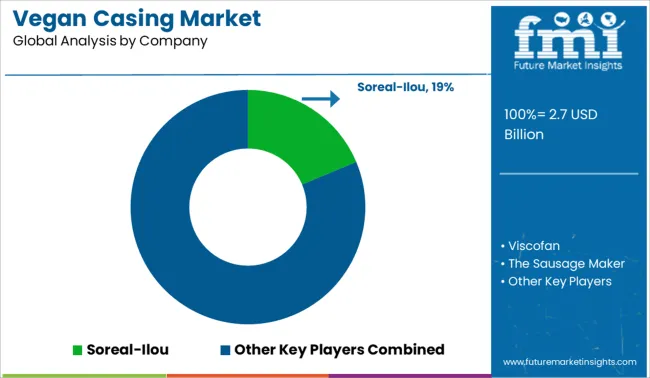
Euroduna Food Ingredients GmbH, Weschenfelder Direct Ltd, Dunninghams Ltd, Viscofan Group, and The Sausage Maker Inc. are a few of the top players driving the market growth.

What are the key factors affecting the vegan casing market growth?

High product demand from the food service industry, soaring production of raw materials, and tasty and convenient product forms are the factors driving the growth of the vegan casing market.

Table of Content

1. Executive Summary | Vegan Casing Market

    1.1. Global Market Outlook

    1.2. Demand-side Trends

    1.3. Supply-side Trends

    1.4. Technology Roadmap Analysis

    1.5. Analysis and Recommendations

2. Market Overview

    2.1. Market Coverage / Taxonomy

    2.2. Market Definition / Scope / Limitations

3. Market Background

    3.1. Market Dynamics

        3.1.1. Drivers

        3.1.2. Restraints

        3.1.3. Opportunity

        3.1.4. Trends

    3.2. Scenario Forecast

        3.2.1. Demand in Optimistic Scenario

        3.2.2. Demand in Likely Scenario

        3.2.3. Demand in Conservative Scenario

    3.3. Product Launches & Recent Developments

    3.4. Product Life Cycle Analysis

    3.5. Value Chain Analysis

        3.5.1. Supply Side Participants and Their Roles

            3.5.1.1. Producers

            3.5.1.2. Mid-Level Participants (Traders/ Agents/ Brokers)

            3.5.1.3. Wholesalers and Distributors

        3.5.2. % of Operating Margin Analysis

        3.5.3. List of Raw Material Suppliers

        3.5.4. List of Existing and Potential Buyers

    3.6. Global Market - Pricing Analysis

        3.6.1. Price Point Assessment by Region

        3.6.2. Price Point Assessment by Product Type

        3.6.3. Price Forecast till 2032

        3.6.4. Factors Affecting Pricing

    3.7. Forecast Factors - Relevance & Impact

    3.8. Regulatory Landscape

        3.8.1. Packaging & Labelling Regulations

        3.8.2. Certifications and Certifying Agency Overview

        3.8.3. Import/Export Policies

    3.9. Regional Parent Market Outlook

    3.10. Consumers Survey Analysis

    3.11. Macro-Economic Factors

    3.12. Product Claims & Nutritional Information scanned by Buyers

4. Global Market Analysis 2017 to 2021 and Forecast, 2022 to 2032

    4.1. Historical Market Size Value (US$ Million) & Volume (MT) Analysis, 2017 to 2021

    4.2. Current and Future Market Size Value (US$ Million) & Volume (MT) Projections, 2022 to 2032

        4.2.1. Y-o-Y Growth Trend Analysis

        4.2.2. Absolute $ Opportunity Analysis

5. Global Market Analysis 2017 to 2021 and Forecast 2022 to 2032, By Product Type

    5.1. Introduction / Key Findings

    5.2. Historical Market Size Value (US$ Million) & Volume (MT) Analysis By Product Type, 2017 to 2021

    5.3. Current and Future Market Size Value (US$ Million) & Volume (MT) Analysis and Forecast By Product Type, 2022 to 2032

        5.3.1. Fresh vegan casing

        5.3.2. Processed Vegan casing

    5.4. Y-o-Y Growth Trend Analysis By Product Type, 2017 to 2021

    5.5. Absolute $ Opportunity Analysis By Product Type, 2022 to 2032

6. Global Market Analysis 2017 to 2021 and Forecast 2022 to 2032, By Product Caliber

    6.1. Introduction / Key Findings

    6.2. Historical Market Size Value (US$ Million) & Volume (MT) Analysis By Product Caliber, 2017 to 2021

    6.3. Current and Future Market Size Value (US$ Million) & Volume (MT) Analysis and Forecast By Product Caliber, 2022 to 2032

        6.3.1. below 20mm Caliber

        6.3.2. 20-26mm caliber

        6.3.3. 26-32mm caliber

        6.3.4. Above 32mm caliber

    6.4. Y-o-Y Growth Trend Analysis By Product Caliber, 2017 to 2021

    6.5. Absolute $ Opportunity Analysis By Product Caliber, 2022 to 2032

7. Global Market Analysis 2017 to 2021 and Forecast 2022 to 2032, By End-Use

    7.1. Introduction / Key Findings

    7.2. Historical Market Size Value (US$ Million) & Volume (MT) Analysis By End-Use, 2017 to 2021

    7.3. Current and Future Market Size Value (US$ Million) & Volume (MT) Analysis and Forecast By End-Use, 2022 to 2032

        7.3.1. Edible Casing

        7.3.2. Non-Edible Casing

    7.4. Y-o-Y Growth Trend Analysis By End-Use, 2017 to 2021

    7.5. Absolute $ Opportunity Analysis By End-Use, 2022 to 2032

8. Global Market Analysis 2017 to 2021 and Forecast 2022 to 2032, By Sales Channel

    8.1. Introduction / Key Findings

    8.2. Historical Market Size Value (US$ Million) & Volume (MT) Analysis By Sales Channel, 2017 to 2021

    8.3. Current and Future Market Size Value (US$ Million) & Volume (MT) Analysis and Forecast By Sales Channel, 2022 to 2032

        8.3.1. B2B/HoReCa

        8.3.2. B2C

            8.3.2.1. Hypermarkets /Supermarkets

            8.3.2.2. Convenience Stores

            8.3.2.3. Food Specialty Stores

            8.3.2.4. Online Retail

            8.3.2.5. Others Retail Formats

    8.4. Y-o-Y Growth Trend Analysis By Sales Channel, 2017 to 2021

    8.5. Absolute $ Opportunity Analysis By Sales Channel, 2022 to 2032

9. Global Market Analysis 2017 to 2021 and Forecast 2022 to 2032, By Region

    9.1. Introduction

    9.2. Historical Market Size Value (US$ Million) & Volume (MT) Analysis By Region, 2017 to 2021

    9.3. Current Market Size Value (US$ Million) & Volume (MT) Analysis and Forecast By Region, 2022 to 2032

        9.3.1. North America

        9.3.2. Latin America

        9.3.3. Europe

        9.3.4. East Asia

        9.3.5. South Asia

        9.3.6. Oceania

        9.3.7. Middle East and Africa

    9.4. Market Attractiveness Analysis By Region

10. North America Market Analysis 2017 to 2021 and Forecast 2022 to 2032, By Country

    10.1. Historical Market Size Value (US$ Million) & Volume (MT) Trend Analysis By Market Taxonomy, 2017 to 2021

    10.2. Market Size Value (US$ Million) & Volume (MT) Forecast By Market Taxonomy, 2022 to 2032

        10.2.1. By Country

            10.2.1.1. USA

            10.2.1.2. Canada

        10.2.2. By Product Type

        10.2.3. By Product Caliber

        10.2.4. By End-Use

        10.2.5. By Sales Channel

    10.3. Market Attractiveness Analysis

        10.3.1. By Country

        10.3.2. By Product Type

        10.3.3. By Product Caliber

        10.3.4. By End-Use

        10.3.5. By Sales Channel

    10.4. Key Takeaways

11. Latin America Market Analysis 2017 to 2021 and Forecast 2022 to 2032, By Country

    11.1. Historical Market Size Value (US$ Million) & Volume (MT) Trend Analysis By Market Taxonomy, 2017 to 2021

    11.2. Market Size Value (US$ Million) & Volume (MT) Forecast By Market Taxonomy, 2022 to 2032

        11.2.1. By Country

            11.2.1.1. Brazil

            11.2.1.2. Mexico

            11.2.1.3. Argentina

            11.2.1.4. Chile

            11.2.1.5. Peru

            11.2.1.6. Rest of Latin America

        11.2.2. By Product Type

        11.2.3. By Product Caliber

        11.2.4. By End-Use

        11.2.5. By Sales Channel

    11.3. Market Attractiveness Analysis

        11.3.1. By Country

        11.3.2. By Product Type

        11.3.3. By Product Caliber

        11.3.4. By End-Use

        11.3.5. By Sales Channel

    11.4. Key Takeaways

12. Europe Market Analysis 2017 to 2021 and Forecast 2022 to 2032, By Country

    12.1. Historical Market Size Value (US$ Million) & Volume (MT) Trend Analysis By Market Taxonomy, 2017 to 2021

    12.2. Market Size Value (US$ Million) & Volume (MT) Forecast By Market Taxonomy, 2022 to 2032

        12.2.1. By Country

            12.2.1.1. Germany

            12.2.1.2. Italy

            12.2.1.3. France

            12.2.1.4. United Kingdom

            12.2.1.5. Spain

            12.2.1.6. Russia

            12.2.1.7. BENELUX

            12.2.1.8. Poland

            12.2.1.9. Nordic Countries

            12.2.1.10. Rest of Europe

        12.2.2. By Product Type

        12.2.3. By Product Caliber

        12.2.4. By End-Use

        12.2.5. By Sales Channel

    12.3. Market Attractiveness Analysis

        12.3.1. By Country

        12.3.2. By Product Type

        12.3.3. By Product Caliber

        12.3.4. By End-Use

        12.3.5. By Sales Channel

    12.4. Key Takeaways

13. East Asia Market Analysis 2017 to 2021 and Forecast 2022 to 2032, By Country

    13.1. Historical Market Size Value (US$ Million) & Volume (MT) Trend Analysis By Market Taxonomy, 2017 to 2021

    13.2. Market Size Value (US$ Million) & Volume (MT) Forecast By Market Taxonomy, 2022 to 2032

        13.2.1. By Country

            13.2.1.1. China

            13.2.1.2. Japan

            13.2.1.3. South Korea

        13.2.2. By Product Type

        13.2.3. By Product Caliber

        13.2.4. By End-Use

        13.2.5. By Sales Channel

    13.3. Market Attractiveness Analysis

        13.3.1. By Country

        13.3.2. By Product Type

        13.3.3. By Product Caliber

        13.3.4. By End-Use

        13.3.5. By Sales Channel

    13.4. Key Takeaways

14. South Asia Market Analysis 2017 to 2021 and Forecast 2022 to 2032, By Country

    14.1. Historical Market Size Value (US$ Million) & Volume (MT) Trend Analysis By Market Taxonomy, 2017 to 2021

    14.2. Market Size Value (US$ Million) & Volume (MT) Forecast By Market Taxonomy, 2022 to 2032

        14.2.1. By Country

            14.2.1.1. India

            14.2.1.2. Thailand

            14.2.1.3. Malaysia

            14.2.1.4. Indonesia

            14.2.1.5. Rest of South Asia

        14.2.2. By Product Type

        14.2.3. By Product Caliber

        14.2.4. By End-Use

        14.2.5. By Sales Channel

    14.3. Market Attractiveness Analysis

        14.3.1. By Country

        14.3.2. By Product Type

        14.3.3. By Product Caliber

        14.3.4. By End-Use

        14.3.5. By Sales Channel

    14.4. Key Takeaways

15. Oceania Market Analysis 2017 to 2021 and Forecast 2022 to 2032, By Country

    15.1. Historical Market Size Value (US$ Million) & Volume (MT) Trend Analysis By Market Taxonomy, 2017 to 2021

    15.2. Market Size Value (US$ Million) & Volume (MT) Forecast By Market Taxonomy, 2022 to 2032

        15.2.1. By Country

            15.2.1.1. Australia

            15.2.1.2. New Zealand

        15.2.2. By Product Type

        15.2.3. By Product Caliber

        15.2.4. By End-Use

        15.2.5. By Sales Channel

    15.3. Market Attractiveness Analysis

        15.3.1. By Country

        15.3.2. By Product Type

        15.3.3. By Product Caliber

        15.3.4. By End-Use

        15.3.5. By Sales Channel

    15.4. Key Takeaways

16. Middle East and Africa Market Analysis 2017 to 2021 and Forecast 2022 to 2032, By Country

    16.1. Historical Market Size Value (US$ Million) & Volume (MT) Trend Analysis By Market Taxonomy, 2017 to 2021

    16.2. Market Size Value (US$ Million) & Volume (MT) Forecast By Market Taxonomy, 2022 to 2032

        16.2.1. By Country

            16.2.1.1. GCC Countries

            16.2.1.2. South Africa

            16.2.1.3. Central Africa

            16.2.1.4. North Africa

        16.2.2. By Product Type

        16.2.3. By Product Caliber

        16.2.4. By End-Use

        16.2.5. By Sales Channel

    16.3. Market Attractiveness Analysis

        16.3.1. By Country

        16.3.2. By Product Type

        16.3.3. By Product Caliber

        16.3.4. By End-Use

        16.3.5. By Sales Channel

    16.4. Key Takeaways

17. Key Countries Market Analysis

    17.1. USA

        17.1.1. Pricing Analysis

        17.1.2. Market Share Analysis, 2021

            17.1.2.1. By Product Type

            17.1.2.2. By Product Caliber

            17.1.2.3. By End-Use

            17.1.2.4. By Sales Channel

    17.2. Canada

        17.2.1. Pricing Analysis

        17.2.2. Market Share Analysis, 2021

            17.2.2.1. By Product Type

            17.2.2.2. By Product Caliber

            17.2.2.3. By End-Use

            17.2.2.4. By Sales Channel

    17.3. Brazil

        17.3.1. Pricing Analysis

        17.3.2. Market Share Analysis, 2021

            17.3.2.1. By Product Type

            17.3.2.2. By Product Caliber

            17.3.2.3. By End-Use

            17.3.2.4. By Sales Channel

    17.4. Mexico

        17.4.1. Pricing Analysis

        17.4.2. Market Share Analysis, 2021

            17.4.2.1. By Product Type

            17.4.2.2. By Product Caliber

            17.4.2.3. By End-Use

            17.4.2.4. By Sales Channel

    17.5. Argentina

        17.5.1. Pricing Analysis

        17.5.2. Market Share Analysis, 2021

            17.5.2.1. By Product Type

            17.5.2.2. By Product Caliber

            17.5.2.3. By End-Use

            17.5.2.4. By Sales Channel

    17.6. Chile

        17.6.1. Pricing Analysis

        17.6.2. Market Share Analysis, 2021

            17.6.2.1. By Product Type

            17.6.2.2. By Product Caliber

            17.6.2.3. By End-Use

            17.6.2.4. By Sales Channel

    17.7. Peru

        17.7.1. Pricing Analysis

        17.7.2. Market Share Analysis, 2021

            17.7.2.1. By Product Type

            17.7.2.2. By Product Caliber

            17.7.2.3. By End-Use

            17.7.2.4. By Sales Channel

    17.8. Germany

        17.8.1. Pricing Analysis

        17.8.2. Market Share Analysis, 2021

            17.8.2.1. By Product Type

            17.8.2.2. By Product Caliber

            17.8.2.3. By End-Use

            17.8.2.4. By Sales Channel

    17.9. Italy

        17.9.1. Pricing Analysis

        17.9.2. Market Share Analysis, 2021

            17.9.2.1. By Product Type

            17.9.2.2. By Product Caliber

            17.9.2.3. By End-Use

            17.9.2.4. By Sales Channel

    17.10. France

        17.10.1. Pricing Analysis

        17.10.2. Market Share Analysis, 2021

            17.10.2.1. By Product Type

            17.10.2.2. By Product Caliber

            17.10.2.3. By End-Use

            17.10.2.4. By Sales Channel

    17.11. Spain

        17.11.1. Pricing Analysis

        17.11.2. Market Share Analysis, 2021

            17.11.2.1. By Product Type

            17.11.2.2. By Product Caliber

            17.11.2.3. By End-Use

            17.11.2.4. By Sales Channel

    17.12. United Kingdom

        17.12.1. Pricing Analysis

        17.12.2. Market Share Analysis, 2021

            17.12.2.1. By Product Type

            17.12.2.2. By Product Caliber

            17.12.2.3. By End-Use

            17.12.2.4. By Sales Channel

    17.13. Russia

        17.13.1. Pricing Analysis

        17.13.2. Market Share Analysis, 2021

            17.13.2.1. By Product Type

            17.13.2.2. By Product Caliber

            17.13.2.3. By End-Use

            17.13.2.4. By Sales Channel

    17.14. Poland

        17.14.1. Pricing Analysis

        17.14.2. Market Share Analysis, 2021

            17.14.2.1. By Product Type

            17.14.2.2. By Product Caliber

            17.14.2.3. By End-Use

            17.14.2.4. By Sales Channel

    17.15. BENELUX

        17.15.1. Pricing Analysis

        17.15.2. Market Share Analysis, 2021

            17.15.2.1. By Product Type

            17.15.2.2. By Product Caliber

            17.15.2.3. By End-Use

            17.15.2.4. By Sales Channel

    17.16. Nordic Countries

        17.16.1. Pricing Analysis

        17.16.2. Market Share Analysis, 2021

            17.16.2.1. By Product Type

            17.16.2.2. By Product Caliber

            17.16.2.3. By End-Use

            17.16.2.4. By Sales Channel

    17.17. China

        17.17.1. Pricing Analysis

        17.17.2. Market Share Analysis, 2021

            17.17.2.1. By Product Type

            17.17.2.2. By Product Caliber

            17.17.2.3. By End-Use

            17.17.2.4. By Sales Channel

    17.18. Japan

        17.18.1. Pricing Analysis

        17.18.2. Market Share Analysis, 2021

            17.18.2.1. By Product Type

            17.18.2.2. By Product Caliber

            17.18.2.3. By End-Use

            17.18.2.4. By Sales Channel

    17.19. South Korea

        17.19.1. Pricing Analysis

        17.19.2. Market Share Analysis, 2021

            17.19.2.1. By Product Type

            17.19.2.2. By Product Caliber

            17.19.2.3. By End-Use

            17.19.2.4. By Sales Channel

    17.20. India

        17.20.1. Pricing Analysis

        17.20.2. Market Share Analysis, 2021

            17.20.2.1. By Product Type

            17.20.2.2. By Product Caliber

            17.20.2.3. By End-Use

            17.20.2.4. By Sales Channel

    17.21. Thailand

        17.21.1. Pricing Analysis

        17.21.2. Market Share Analysis, 2021

            17.21.2.1. By Product Type

            17.21.2.2. By Product Caliber

            17.21.2.3. By End-Use

            17.21.2.4. By Sales Channel

    17.22. Indonesia

        17.22.1. Pricing Analysis

        17.22.2. Market Share Analysis, 2021

            17.22.2.1. By Product Type

            17.22.2.2. By Product Caliber

            17.22.2.3. By End-Use

            17.22.2.4. By Sales Channel

    17.23. Malaysia

        17.23.1. Pricing Analysis

        17.23.2. Market Share Analysis, 2021

            17.23.2.1. By Product Type

            17.23.2.2. By Product Caliber

            17.23.2.3. By End-Use

            17.23.2.4. By Sales Channel

    17.24. Singapore

        17.24.1. Pricing Analysis

        17.24.2. Market Share Analysis, 2021

            17.24.2.1. By Product Type

            17.24.2.2. By Product Caliber

            17.24.2.3. By End-Use

            17.24.2.4. By Sales Channel

    17.25. GCC Countries

        17.25.1. Pricing Analysis

        17.25.2. Market Share Analysis, 2021

            17.25.2.1. By Product Type

            17.25.2.2. By Product Caliber

            17.25.2.3. By End-Use

            17.25.2.4. By Sales Channel

    17.26. South Africa

        17.26.1. Pricing Analysis

        17.26.2. Market Share Analysis, 2021

            17.26.2.1. By Product Type

            17.26.2.2. By Product Caliber

            17.26.2.3. By End-Use

            17.26.2.4. By Sales Channel

    17.27. Central Africa

        17.27.1. Pricing Analysis

        17.27.2. Market Share Analysis, 2021

            17.27.2.1. By Product Type

            17.27.2.2. By Product Caliber

            17.27.2.3. By End-Use

            17.27.2.4. By Sales Channel

    17.28. North Africa

        17.28.1. Pricing Analysis

        17.28.2. Market Share Analysis, 2021

            17.28.2.1. By Product Type

            17.28.2.2. By Product Caliber

            17.28.2.3. By End-Use

            17.28.2.4. By Sales Channel

18. Market Structure Analysis

    18.1. Competition Dashboard

    18.2. Competition Benchmarking

    18.3. Market Share Analysis of Top Players

        18.3.1. By Regional

        18.3.2. By Product Type

        18.3.3. By Product Caliber

        18.3.4. By End-Use

        18.3.5. By Sales Channel

19. Competition Analysis

    19.1. Competition Deep Dive

        19.1.1. Soreal-Ilou

            19.1.1.1. Overview

            19.1.1.2. Product Portfolio

            19.1.1.3. Profitability by Market Segments

            19.1.1.4. Sales Footprint

            19.1.1.5. Strategy Overview

                19.1.1.5.1. Marketing Strategy

                19.1.1.5.2. Product Strategy

                19.1.1.5.3. Channel Strategy

        19.1.2. Viscofan

            19.1.2.1. Overview

            19.1.2.2. Product Portfolio

            19.1.2.3. Profitability by Market Segments

            19.1.2.4. Sales Footprint

            19.1.2.5. Strategy Overview

                19.1.2.5.1. Marketing Strategy

                19.1.2.5.2. Product Strategy

                19.1.2.5.3. Channel Strategy

        19.1.3. The Sausage Maker

            19.1.3.1. Overview

            19.1.3.2. Product Portfolio

            19.1.3.3. Profitability by Market Segments

            19.1.3.4. Sales Footprint

            19.1.3.5. Strategy Overview

                19.1.3.5.1. Marketing Strategy

                19.1.3.5.2. Product Strategy

                19.1.3.5.3. Channel Strategy

        19.1.4. Weschenfelder

            19.1.4.1. Overview

            19.1.4.2. Product Portfolio

            19.1.4.3. Profitability by Market Segments

            19.1.4.4. Sales Footprint

            19.1.4.5. Strategy Overview

                19.1.4.5.1. Marketing Strategy

                19.1.4.5.2. Product Strategy

                19.1.4.5.3. Channel Strategy

        19.1.5. Ascona Foods Group

            19.1.5.1. Overview

            19.1.5.2. Product Portfolio

            19.1.5.3. Profitability by Market Segments

            19.1.5.4. Sales Footprint

            19.1.5.5. Strategy Overview

                19.1.5.5.1. Marketing Strategy

                19.1.5.5.2. Product Strategy

                19.1.5.5.3. Channel Strategy

        19.1.6. Kalle GmbH

            19.1.6.1. Overview

            19.1.6.2. Product Portfolio

            19.1.6.3. Profitability by Market Segments

            19.1.6.4. Sales Footprint

            19.1.6.5. Strategy Overview

                19.1.6.5.1. Marketing Strategy

                19.1.6.5.2. Product Strategy

                19.1.6.5.3. Channel Strategy

        19.1.7. Nutra Produkte AG

            19.1.7.1. Overview

            19.1.7.2. Product Portfolio

            19.1.7.3. Profitability by Market Segments

            19.1.7.4. Sales Footprint

            19.1.7.5. Strategy Overview

                19.1.7.5.1. Marketing Strategy

                19.1.7.5.2. Product Strategy

                19.1.7.5.3. Channel Strategy

        19.1.8. Ruitenberg

            19.1.8.1. Overview

            19.1.8.2. Product Portfolio

            19.1.8.3. Profitability by Market Segments

            19.1.8.4. Sales Footprint

            19.1.8.5. Strategy Overview

                19.1.8.5.1. Marketing Strategy

                19.1.8.5.2. Product Strategy

                19.1.8.5.3. Channel Strategy

        19.1.9. Ennio International

            19.1.9.1. Overview

            19.1.9.2. Product Portfolio

            19.1.9.3. Profitability by Market Segments

            19.1.9.4. Sales Footprint

            19.1.9.5. Strategy Overview

                19.1.9.5.1. Marketing Strategy

                19.1.9.5.2. Product Strategy

                19.1.9.5.3. Channel Strategy

        19.1.10. Alginate Casings

            19.1.10.1. Overview

            19.1.10.2. Product Portfolio

            19.1.10.3. Profitability by Market Segments

            19.1.10.4. Sales Footprint

            19.1.10.5. Strategy Overview

                19.1.10.5.1. Marketing Strategy

                19.1.10.5.2. Product Strategy

                19.1.10.5.3. Channel Strategy

        19.1.11. Others (on additional request)

20. Assumptions & Acronyms Used

21. Research Methodology

Don't pay for what you don't need

Customize your report by selecting specific countries or regions and save 30%!

List of Tables

Table 01: Global Market Value (US$ Million) Forecast by Region, 2017 to 2032

Table 02: Global Market Volume (MT) Forecast by Region, 2017 to 2032

Table 03: Global Market Value (US$ Million) Forecast by Product Type, 2017 to 2032

Table 04: Global Market Volume (MT) Forecast by Product Type, 2017 to 2032

Table 05: Global Market Value (US$ Million) Forecast by Product Caliber, 2017 to 2032

Table 06: Global Market Volume (MT) Forecast by Product Caliber, 2017 to 2032

Table 07: Global Market Value (US$ Million) Forecast by End-Use, 2017 to 2032

Table 08: Global Market Volume (MT) Forecast by End-Use, 2017 to 2032

Table 09: Global Market Value (US$ Million) Forecast by Sales Channel, 2017 to 2032

Table 10: Global Market Volume (MT) Forecast by Sales Channel, 2017 to 2032

Table 11: North America Market Value (US$ Million) Forecast by Country, 2017 to 2032

Table 12: North America Market Volume (MT) Forecast by Country, 2017 to 2032

Table 13: North America Market Value (US$ Million) Forecast by Product Type, 2017 to 2032

Table 14: North America Market Volume (MT) Forecast by Product Type, 2017 to 2032

Table 15: North America Market Value (US$ Million) Forecast by Product Caliber, 2017 to 2032

Table 16: North America Market Volume (MT) Forecast by Product Caliber, 2017 to 2032

Table 17: North America Market Value (US$ Million) Forecast by End-Use, 2017 to 2032

Table 18: North America Market Volume (MT) Forecast by End-Use, 2017 to 2032

Table 19: North America Market Value (US$ Million) Forecast by Sales Channel, 2017 to 2032

Table 20: North America Market Volume (MT) Forecast by Sales Channel, 2017 to 2032

Table 21: Latin America Market Value (US$ Million) Forecast by Country, 2017 to 2032

Table 22: Latin America Market Volume (MT) Forecast by Country, 2017 to 2032

Table 23: Latin America Market Value (US$ Million) Forecast by Product Type, 2017 to 2032

Table 24: Latin America Market Volume (MT) Forecast by Product Type, 2017 to 2032

Table 25: Latin America Market Value (US$ Million) Forecast by Product Caliber, 2017 to 2032

Table 26: Latin America Market Volume (MT) Forecast by Product Caliber, 2017 to 2032

Table 27: Latin America Market Value (US$ Million) Forecast by End-Use, 2017 to 2032

Table 28: Latin America Market Volume (MT) Forecast by End-Use, 2017 to 2032

Table 29: Latin America Market Value (US$ Million) Forecast by Sales Channel, 2017 to 2032

Table 30: Latin America Market Volume (MT) Forecast by Sales Channel, 2017 to 2032

Table 31: Europe Market Value (US$ Million) Forecast by Country, 2017 to 2032

Table 32: Europe Market Volume (MT) Forecast by Country, 2017 to 2032

Table 33: Europe Market Value (US$ Million) Forecast by Product Type, 2017 to 2032

Table 34: Europe Market Volume (MT) Forecast by Product Type, 2017 to 2032

Table 35: Europe Market Value (US$ Million) Forecast by Product Caliber, 2017 to 2032

Table 36: Europe Market Volume (MT) Forecast by Product Caliber, 2017 to 2032

Table 37: Europe Market Value (US$ Million) Forecast by End-Use, 2017 to 2032

Table 38: Europe Market Volume (MT) Forecast by End-Use, 2017 to 2032

Table 39: Europe Market Value (US$ Million) Forecast by Sales Channel, 2017 to 2032

Table 40: Europe Market Volume (MT) Forecast by Sales Channel, 2017 to 2032

Table 41: East Asia Market Value (US$ Million) Forecast by Country, 2017 to 2032

Table 42: East Asia Market Volume (MT) Forecast by Country, 2017 to 2032

Table 43: East Asia Market Value (US$ Million) Forecast by Product Type, 2017 to 2032

Table 44: East Asia Market Volume (MT) Forecast by Product Type, 2017 to 2032

Table 45: East Asia Market Value (US$ Million) Forecast by Product Caliber, 2017 to 2032

Table 46: East Asia Market Volume (MT) Forecast by Product Caliber, 2017 to 2032

Table 47: East Asia Market Value (US$ Million) Forecast by End-Use, 2017 to 2032

Table 48: East Asia Market Volume (MT) Forecast by End-Use, 2017 to 2032

Table 49: East Asia Market Value (US$ Million) Forecast by Sales Channel, 2017 to 2032

Table 50: East Asia Market Volume (MT) Forecast by Sales Channel, 2017 to 2032

Table 51: South Asia Market Value (US$ Million) Forecast by Country, 2017 to 2032

Table 52: South Asia Market Volume (MT) Forecast by Country, 2017 to 2032

Table 53: South Asia Market Value (US$ Million) Forecast by Product Type, 2017 to 2032

Table 54: South Asia Market Volume (MT) Forecast by Product Type, 2017 to 2032

Table 55: South Asia Market Value (US$ Million) Forecast by Product Caliber, 2017 to 2032

Table 56: South Asia Market Volume (MT) Forecast by Product Caliber, 2017 to 2032

Table 57: South Asia Market Value (US$ Million) Forecast by End-Use, 2017 to 2032

Table 58: South Asia Market Volume (MT) Forecast by End-Use, 2017 to 2032

Table 59: South Asia Market Value (US$ Million) Forecast by Sales Channel, 2017 to 2032

Table 60: South Asia Market Volume (MT) Forecast by Sales Channel, 2017 to 2032

Table 61: Oceania Market Value (US$ Million) Forecast by Country, 2017 to 2032

Table 62: Oceania Market Volume (MT) Forecast by Country, 2017 to 2032

Table 63: Oceania Market Value (US$ Million) Forecast by Product Type, 2017 to 2032

Table 64: Oceania Market Volume (MT) Forecast by Product Type, 2017 to 2032

Table 65: Oceania Market Value (US$ Million) Forecast by Product Caliber, 2017 to 2032

Table 66: Oceania Market Volume (MT) Forecast by Product Caliber, 2017 to 2032

Table 67: Oceania Market Value (US$ Million) Forecast by End-Use, 2017 to 2032

Table 68: Oceania Market Volume (MT) Forecast by End-Use, 2017 to 2032

Table 69: Oceania Market Value (US$ Million) Forecast by Sales Channel, 2017 to 2032

Table 70: Oceania Market Volume (MT) Forecast by Sales Channel, 2017 to 2032

Table 71: MEA Market Value (US$ Million) Forecast by Country, 2017 to 2032

Table 72: MEA Market Volume (MT) Forecast by Country, 2017 to 2032

Table 73: MEA Market Value (US$ Million) Forecast by Product Type, 2017 to 2032

Table 74: MEA Market Volume (MT) Forecast by Product Type, 2017 to 2032

Table 75: MEA Market Value (US$ Million) Forecast by Product Caliber, 2017 to 2032

Table 76: MEA Market Volume (MT) Forecast by Product Caliber, 2017 to 2032

Table 77: MEA Market Value (US$ Million) Forecast by End-Use, 2017 to 2032

Table 78: MEA Market Volume (MT) Forecast by End-Use, 2017 to 2032

Table 79: MEA Market Value (US$ Million) Forecast by Sales Channel, 2017 to 2032

Table 80: MEA Market Volume (MT) Forecast by Sales Channel, 2017 to 2032
Nandini Roy Choudhury

Principal Consultant

Talk to Analyst

Find your sweet spots for generating winning opportunities in this market.

List of Charts

Figure 01: Global Market Value (US$ Million) by Product Type, 2022 to 2032

Figure 02: Global Market Value (US$ Million) by Product Caliber, 2022 to 2032

Figure 03: Global Market Value (US$ Million) by End-Use, 2022 to 2032

Figure 04: Global Market Value (US$ Million) by Sales Channel, 2022 to 2032

Figure 05: Global Market Value (US$ Million) by Region, 2022 to 2032

Figure 06: Global Market Value (US$ Million) Analysis by Region, 2017 to 2032

Figure 07: Global Market Volume (MT) Analysis by Region, 2017 to 2032

Figure 08: Global Market Value Share (%) and BPS Analysis by Region, 2022 to 2032

Figure 09: Global Market Y-o-Y Growth (%) Projections by Region, 2022 to 2032

Figure 10: Global Market Value (US$ Million) Analysis by Product Type, 2017 to 2032

Figure 11: Global Market Volume (MT) Analysis by Product Type, 2017 to 2032

Figure 12: Global Market Value Share (%) and BPS Analysis by Product Type, 2022 to 2032

Figure 13: Global Market Y-o-Y Growth (%) Projections by Product Type, 2022 to 2032

Figure 14: Global Market Value (US$ Million) Analysis by Product Caliber, 2017 to 2032

Figure 15: Global Market Volume (MT) Analysis by Product Caliber, 2017 to 2032

Figure 16: Global Market Value Share (%) and BPS Analysis by Product Caliber, 2022 to 2032

Figure 17: Global Market Y-o-Y Growth (%) Projections by Product Caliber, 2022 to 2032

Figure 18: Global Market Value (US$ Million) Analysis by End-Use, 2017 to 2032

Figure 19: Global Market Volume (MT) Analysis by End-Use, 2017 to 2032

Figure 20: Global Market Value Share (%) and BPS Analysis by End-Use, 2022 to 2032

Figure 21: Global Market Y-o-Y Growth (%) Projections by End-Use, 2022 to 2032

Figure 22: Global Market Value (US$ Million) Analysis by Sales Channel, 2017 to 2032

Figure 23: Global Market Volume (MT) Analysis by Sales Channel, 2017 to 2032

Figure 24: Global Market Value Share (%) and BPS Analysis by Sales Channel, 2022 to 2032

Figure 25: Global Market Y-o-Y Growth (%) Projections by Sales Channel, 2022 to 2032

Figure 26: Global Market Attractiveness by Product Type, 2022 to 2032

Figure 27: Global Market Attractiveness by Product Caliber, 2022 to 2032

Figure 28: Global Market Attractiveness by End-Use, 2022 to 2032

Figure 29: Global Market Attractiveness by Sales Channel, 2022 to 2032

Figure 30: Global Market Attractiveness by Region, 2022 to 2032

Figure 31: North America Market Value (US$ Million) by Product Type, 2022 to 2032

Figure 32: North America Market Value (US$ Million) by Product Caliber, 2022 to 2032

Figure 33: North America Market Value (US$ Million) by End-Use, 2022 to 2032

Figure 34: North America Market Value (US$ Million) by Sales Channel, 2022 to 2032

Figure 35: North America Market Value (US$ Million) by Country, 2022 to 2032

Figure 36: North America Market Value (US$ Million) Analysis by Country, 2017 to 2032

Figure 37: North America Market Volume (MT) Analysis by Country, 2017 to 2032

Figure 38: North America Market Value Share (%) and BPS Analysis by Country, 2022 to 2032

Figure 39: North America Market Y-o-Y Growth (%) Projections by Country, 2022 to 2032

Figure 40: North America Market Value (US$ Million) Analysis by Product Type, 2017 to 2032

Figure 41: North America Market Volume (MT) Analysis by Product Type, 2017 to 2032

Figure 42: North America Market Value Share (%) and BPS Analysis by Product Type, 2022 to 2032

Figure 43: North America Market Y-o-Y Growth (%) Projections by Product Type, 2022 to 2032

Figure 44: North America Market Value (US$ Million) Analysis by Product Caliber, 2017 to 2032

Figure 45: North America Market Volume (MT) Analysis by Product Caliber, 2017 to 2032

Figure 46: North America Market Value Share (%) and BPS Analysis by Product Caliber, 2022 to 2032

Figure 47: North America Market Y-o-Y Growth (%) Projections by Product Caliber, 2022 to 2032

Figure 48: North America Market Value (US$ Million) Analysis by End-Use, 2017 to 2032

Figure 49: North America Market Volume (MT) Analysis by End-Use, 2017 to 2032

Figure 50: North America Market Value Share (%) and BPS Analysis by End-Use, 2022 to 2032

Figure 51: North America Market Y-o-Y Growth (%) Projections by End-Use, 2022 to 2032

Figure 52: North America Market Value (US$ Million) Analysis by Sales Channel, 2017 to 2032

Figure 53: North America Market Volume (MT) Analysis by Sales Channel, 2017 to 2032

Figure 54: North America Market Value Share (%) and BPS Analysis by Sales Channel, 2022 to 2032

Figure 55: North America Market Y-o-Y Growth (%) Projections by Sales Channel, 2022 to 2032

Figure 56: North America Market Attractiveness by Product Type, 2022 to 2032

Figure 57: North America Market Attractiveness by Product Caliber, 2022 to 2032

Figure 58: North America Market Attractiveness by End-Use, 2022 to 2032

Figure 59: North America Market Attractiveness by Sales Channel, 2022 to 2032

Figure 60: North America Market Attractiveness by Country, 2022 to 2032

Figure 61: Latin America Market Value (US$ Million) by Product Type, 2022 to 2032

Figure 62: Latin America Market Value (US$ Million) by Product Caliber, 2022 to 2032

Figure 63: Latin America Market Value (US$ Million) by End-Use, 2022 to 2032

Figure 64: Latin America Market Value (US$ Million) by Sales Channel, 2022 to 2032

Figure 65: Latin America Market Value (US$ Million) by Country, 2022 to 2032

Figure 66: Latin America Market Value (US$ Million) Analysis by Country, 2017 to 2032

Figure 67: Latin America Market Volume (MT) Analysis by Country, 2017 to 2032

Figure 68: Latin America Market Value Share (%) and BPS Analysis by Country, 2022 to 2032

Figure 69: Latin America Market Y-o-Y Growth (%) Projections by Country, 2022 to 2032

Figure 70: Latin America Market Value (US$ Million) Analysis by Product Type, 2017 to 2032

Figure 71: Latin America Market Volume (MT) Analysis by Product Type, 2017 to 2032

Figure 72: Latin America Market Value Share (%) and BPS Analysis by Product Type, 2022 to 2032

Figure 73: Latin America Market Y-o-Y Growth (%) Projections by Product Type, 2022 to 2032

Figure 74: Latin America Market Value (US$ Million) Analysis by Product Caliber, 2017 to 2032

Figure 75: Latin America Market Volume (MT) Analysis by Product Caliber, 2017 to 2032

Figure 76: Latin America Market Value Share (%) and BPS Analysis by Product Caliber, 2022 to 2032

Figure 77: Latin America Market Y-o-Y Growth (%) Projections by Product Caliber, 2022 to 2032

Figure 78: Latin America Market Value (US$ Million) Analysis by End-Use, 2017 to 2032

Figure 79: Latin America Market Volume (MT) Analysis by End-Use, 2017 to 2032

Figure 80: Latin America Market Value Share (%) and BPS Analysis by End-Use, 2022 to 2032

Figure 81: Latin America Market Y-o-Y Growth (%) Projections by End-Use, 2022 to 2032

Figure 82: Latin America Market Value (US$ Million) Analysis by Sales Channel, 2017 to 2032

Figure 83: Latin America Market Volume (MT) Analysis by Sales Channel, 2017 to 2032

Figure 84: Latin America Market Value Share (%) and BPS Analysis by Sales Channel, 2022 to 2032

Figure 85: Latin America Market Y-o-Y Growth (%) Projections by Sales Channel, 2022 to 2032

Figure 86: Latin America Market Attractiveness by Product Type, 2022 to 2032

Figure 87: Latin America Market Attractiveness by Product Caliber, 2022 to 2032

Figure 88: Latin America Market Attractiveness by End-Use, 2022 to 2032

Figure 89: Latin America Market Attractiveness by Sales Channel, 2022 to 2032

Figure 90: Latin America Market Attractiveness by Country, 2022 to 2032

Figure 91: Europe Market Value (US$ Million) by Product Type, 2022 to 2032

Figure 92: Europe Market Value (US$ Million) by Product Caliber, 2022 to 2032

Figure 93: Europe Market Value (US$ Million) by End-Use, 2022 to 2032

Figure 94: Europe Market Value (US$ Million) by Sales Channel, 2022 to 2032

Figure 95: Europe Market Value (US$ Million) by Country, 2022 to 2032

Figure 96: Europe Market Value (US$ Million) Analysis by Country, 2017 to 2032

Figure 97: Europe Market Volume (MT) Analysis by Country, 2017 to 2032

Figure 98: Europe Market Value Share (%) and BPS Analysis by Country, 2022 to 2032

Figure 99: Europe Market Y-o-Y Growth (%) Projections by Country, 2022 to 2032

Figure 100: Europe Market Value (US$ Million) Analysis by Product Type, 2017 to 2032

Figure 101: Europe Market Volume (MT) Analysis by Product Type, 2017 to 2032

Figure 102: Europe Market Value Share (%) and BPS Analysis by Product Type, 2022 to 2032

Figure 103: Europe Market Y-o-Y Growth (%) Projections by Product Type, 2022 to 2032

Figure 104: Europe Market Value (US$ Million) Analysis by Product Caliber, 2017 to 2032

Figure 105: Europe Market Volume (MT) Analysis by Product Caliber, 2017 to 2032

Figure 106: Europe Market Value Share (%) and BPS Analysis by Product Caliber, 2022 to 2032

Figure 107: Europe Market Y-o-Y Growth (%) Projections by Product Caliber, 2022 to 2032

Figure 108: Europe Market Value (US$ Million) Analysis by End-Use, 2017 to 2032

Figure 109: Europe Market Volume (MT) Analysis by End-Use, 2017 to 2032

Figure 110: Europe Market Value Share (%) and BPS Analysis by End-Use, 2022 to 2032

Figure 111: Europe Market Y-o-Y Growth (%) Projections by End-Use, 2022 to 2032

Figure 112: Europe Market Value (US$ Million) Analysis by Sales Channel, 2017 to 2032

Figure 113: Europe Market Volume (MT) Analysis by Sales Channel, 2017 to 2032

Figure 114: Europe Market Value Share (%) and BPS Analysis by Sales Channel, 2022 to 2032

Figure 115: Europe Market Y-o-Y Growth (%) Projections by Sales Channel, 2022 to 2032

Figure 116: Europe Market Attractiveness by Product Type, 2022 to 2032

Figure 117: Europe Market Attractiveness by Product Caliber, 2022 to 2032

Figure 118: Europe Market Attractiveness by End-Use, 2022 to 2032

Figure 119: Europe Market Attractiveness by Sales Channel, 2022 to 2032

Figure 120: Europe Market Attractiveness by Country, 2022 to 2032

Figure 121: East Asia Market Value (US$ Million) by Product Type, 2022 to 2032

Figure 122: East Asia Market Value (US$ Million) by Product Caliber, 2022 to 2032

Figure 123: East Asia Market Value (US$ Million) by End-Use, 2022 to 2032

Figure 124: East Asia Market Value (US$ Million) by Sales Channel, 2022 to 2032

Figure 125: East Asia Market Value (US$ Million) by Country, 2022 to 2032

Figure 126: East Asia Market Value (US$ Million) Analysis by Country, 2017 to 2032

Figure 127: East Asia Market Volume (MT) Analysis by Country, 2017 to 2032

Figure 128: East Asia Market Value Share (%) and BPS Analysis by Country, 2022 to 2032

Figure 129: East Asia Market Y-o-Y Growth (%) Projections by Country, 2022 to 2032

Figure 130: East Asia Market Value (US$ Million) Analysis by Product Type, 2017 to 2032

Figure 131: East Asia Market Volume (MT) Analysis by Product Type, 2017 to 2032

Figure 132: East Asia Market Value Share (%) and BPS Analysis by Product Type, 2022 to 2032

Figure 133: East Asia Market Y-o-Y Growth (%) Projections by Product Type, 2022 to 2032

Figure 134: East Asia Market Value (US$ Million) Analysis by Product Caliber, 2017 to 2032

Figure 135: East Asia Market Volume (MT) Analysis by Product Caliber, 2017 to 2032

Figure 136: East Asia Market Value Share (%) and BPS Analysis by Product Caliber, 2022 to 2032

Figure 137: East Asia Market Y-o-Y Growth (%) Projections by Product Caliber, 2022 to 2032

Figure 138: East Asia Market Value (US$ Million) Analysis by End-Use, 2017 to 2032

Figure 139: East Asia Market Volume (MT) Analysis by End-Use, 2017 to 2032

Figure 140: East Asia Market Value Share (%) and BPS Analysis by End-Use, 2022 to 2032

Figure 141: East Asia Market Y-o-Y Growth (%) Projections by End-Use, 2022 to 2032

Figure 142: East Asia Market Value (US$ Million) Analysis by Sales Channel, 2017 to 2032

Figure 143: East Asia Market Volume (MT) Analysis by Sales Channel, 2017 to 2032

Figure 144: East Asia Market Value Share (%) and BPS Analysis by Sales Channel, 2022 to 2032

Figure 145: East Asia Market Y-o-Y Growth (%) Projections by Sales Channel, 2022 to 2032

Figure 146: East Asia Market Attractiveness by Product Type, 2022 to 2032

Figure 147: East Asia Market Attractiveness by Product Caliber, 2022 to 2032

Figure 148: East Asia Market Attractiveness by End-Use, 2022 to 2032

Figure 149: East Asia Market Attractiveness by Sales Channel, 2022 to 2032

Figure 150: East Asia Market Attractiveness by Country, 2022 to 2032

Figure 151: South Asia Market Value (US$ Million) by Product Type, 2022 to 2032

Figure 152: South Asia Market Value (US$ Million) by Product Caliber, 2022 to 2032

Figure 153: South Asia Market Value (US$ Million) by End-Use, 2022 to 2032

Figure 154: South Asia Market Value (US$ Million) by Sales Channel, 2022 to 2032

Figure 155: South Asia Market Value (US$ Million) by Country, 2022 to 2032

Figure 156: South Asia Market Value (US$ Million) Analysis by Country, 2017 to 2032

Figure 157: South Asia Market Volume (MT) Analysis by Country, 2017 to 2032

Figure 158: South Asia Market Value Share (%) and BPS Analysis by Country, 2022 to 2032

Figure 159: South Asia Market Y-o-Y Growth (%) Projections by Country, 2022 to 2032

Figure 160: South Asia Market Value (US$ Million) Analysis by Product Type, 2017 to 2032

Figure 161: South Asia Market Volume (MT) Analysis by Product Type, 2017 to 2032

Figure 162: South Asia Market Value Share (%) and BPS Analysis by Product Type, 2022 to 2032

Figure 163: South Asia Market Y-o-Y Growth (%) Projections by Product Type, 2022 to 2032

Figure 164: South Asia Market Value (US$ Million) Analysis by Product Caliber, 2017 to 2032

Figure 165: South Asia Market Volume (MT) Analysis by Product Caliber, 2017 to 2032

Figure 166: South Asia Market Value Share (%) and BPS Analysis by Product Caliber, 2022 to 2032

Figure 167: South Asia Market Y-o-Y Growth (%) Projections by Product Caliber, 2022 to 2032

Figure 168: South Asia Market Value (US$ Million) Analysis by End-Use, 2017 to 2032

Figure 169: South Asia Market Volume (MT) Analysis by End-Use, 2017 to 2032

Figure 170: South Asia Market Value Share (%) and BPS Analysis by End-Use, 2022 to 2032

Figure 171: South Asia Market Y-o-Y Growth (%) Projections by End-Use, 2022 to 2032

Figure 172: South Asia Market Value (US$ Million) Analysis by Sales Channel, 2017 to 2032

Figure 173: South Asia Market Volume (MT) Analysis by Sales Channel, 2017 to 2032

Figure 174: South Asia Market Value Share (%) and BPS Analysis by Sales Channel, 2022 to 2032

Figure 175: South Asia Market Y-o-Y Growth (%) Projections by Sales Channel, 2022 to 2032

Figure 176: South Asia Market Attractiveness by Product Type, 2022 to 2032

Figure 177: South Asia Market Attractiveness by Product Caliber, 2022 to 2032

Figure 178: South Asia Market Attractiveness by End-Use, 2022 to 2032

Figure 179: South Asia Market Attractiveness by Sales Channel, 2022 to 2032

Figure 180: South Asia Market Attractiveness by Country, 2022 to 2032

Figure 181: Oceania Market Value (US$ Million) by Product Type, 2022 to 2032

Figure 182: Oceania Market Value (US$ Million) by Product Caliber, 2022 to 2032

Figure 183: Oceania Market Value (US$ Million) by End-Use, 2022 to 2032

Figure 184: Oceania Market Value (US$ Million) by Sales Channel, 2022 to 2032

Figure 185: Oceania Market Value (US$ Million) by Country, 2022 to 2032

Figure 186: Oceania Market Value (US$ Million) Analysis by Country, 2017 to 2032

Figure 187: Oceania Market Volume (MT) Analysis by Country, 2017 to 2032

Figure 188: Oceania Market Value Share (%) and BPS Analysis by Country, 2022 to 2032

Figure 189: Oceania Market Y-o-Y Growth (%) Projections by Country, 2022 to 2032

Figure 190: Oceania Market Value (US$ Million) Analysis by Product Type, 2017 to 2032

Figure 191: Oceania Market Volume (MT) Analysis by Product Type, 2017 to 2032

Figure 192: Oceania Market Value Share (%) and BPS Analysis by Product Type, 2022 to 2032

Figure 193: Oceania Market Y-o-Y Growth (%) Projections by Product Type, 2022 to 2032

Figure 194: Oceania Market Value (US$ Million) Analysis by Product Caliber, 2017 to 2032

Figure 195: Oceania Market Volume (MT) Analysis by Product Caliber, 2017 to 2032

Figure 196: Oceania Market Value Share (%) and BPS Analysis by Product Caliber, 2022 to 2032

Figure 197: Oceania Market Y-o-Y Growth (%) Projections by Product Caliber, 2022 to 2032

Figure 198: Oceania Market Value (US$ Million) Analysis by End-Use, 2017 to 2032

Figure 199: Oceania Market Volume (MT) Analysis by End-Use, 2017 to 2032

Figure 200: Oceania Market Value Share (%) and BPS Analysis by End-Use, 2022 to 2032

Figure 201: Oceania Market Y-o-Y Growth (%) Projections by End-Use, 2022 to 2032

Figure 202: Oceania Market Value (US$ Million) Analysis by Sales Channel, 2017 to 2032

Figure 203: Oceania Market Volume (MT) Analysis by Sales Channel, 2017 to 2032

Figure 204: Oceania Market Value Share (%) and BPS Analysis by Sales Channel, 2022 to 2032

Figure 205: Oceania Market Y-o-Y Growth (%) Projections by Sales Channel, 2022 to 2032

Figure 206: Oceania Market Attractiveness by Product Type, 2022 to 2032

Figure 207: Oceania Market Attractiveness by Product Caliber, 2022 to 2032

Figure 208: Oceania Market Attractiveness by End-Use, 2022 to 2032

Figure 209: Oceania Market Attractiveness by Sales Channel, 2022 to 2032

Figure 210: Oceania Market Attractiveness by Country, 2022 to 2032

Figure 211: MEA Market Value (US$ Million) by Product Type, 2022 to 2032

Figure 212: MEA Market Value (US$ Million) by Product Caliber, 2022 to 2032

Figure 213: MEA Market Value (US$ Million) by End-Use, 2022 to 2032

Figure 214: MEA Market Value (US$ Million) by Sales Channel, 2022 to 2032

Figure 215: MEA Market Value (US$ Million) by Country, 2022 to 2032

Figure 216: MEA Market Value (US$ Million) Analysis by Country, 2017 to 2032

Figure 217: MEA Market Volume (MT) Analysis by Country, 2017 to 2032

Figure 218: MEA Market Value Share (%) and BPS Analysis by Country, 2022 to 2032

Figure 219: MEA Market Y-o-Y Growth (%) Projections by Country, 2022 to 2032

Figure 220: MEA Market Value (US$ Million) Analysis by Product Type, 2017 to 2032

Figure 221: MEA Market Volume (MT) Analysis by Product Type, 2017 to 2032

Figure 222: MEA Market Value Share (%) and BPS Analysis by Product Type, 2022 to 2032

Figure 223: MEA Market Y-o-Y Growth (%) Projections by Product Type, 2022 to 2032

Figure 224: MEA Market Value (US$ Million) Analysis by Product Caliber, 2017 to 2032

Figure 225: MEA Market Volume (MT) Analysis by Product Caliber, 2017 to 2032

Figure 226: MEA Market Value Share (%) and BPS Analysis by Product Caliber, 2022 to 2032

Figure 227: MEA Market Y-o-Y Growth (%) Projections by Product Caliber, 2022 to 2032

Figure 228: MEA Market Value (US$ Million) Analysis by End-Use, 2017 to 2032

Figure 229: MEA Market Volume (MT) Analysis by End-Use, 2017 to 2032

Figure 230: MEA Market Value Share (%) and BPS Analysis by End-Use, 2022 to 2032

Figure 231: MEA Market Y-o-Y Growth (%) Projections by End-Use, 2022 to 2032

Figure 232: MEA Market Value (US$ Million) Analysis by Sales Channel, 2017 to 2032

Figure 233: MEA Market Volume (MT) Analysis by Sales Channel, 2017 to 2032

Figure 234: MEA Market Value Share (%) and BPS Analysis by Sales Channel, 2022 to 2032

Figure 235: MEA Market Y-o-Y Growth (%) Projections by Sales Channel, 2022 to 2032

Figure 236: MEA Market Attractiveness by Product Type, 2022 to 2032

Figure 237: MEA Market Attractiveness by Product Caliber, 2022 to 2032

Figure 238: MEA Market Attractiveness by End-Use, 2022 to 2032

Figure 239: MEA Market Attractiveness by Sales Channel, 2022 to 2032

Figure 240: MEA Market Attractiveness by Country, 2022 to 2032

Recommendations

Food and Beverage

Vegan Pasta Market

Published : August 2023

Food and Beverage

Vegan Flavor Market

Published : August 2023

Food and Beverage

Vegan Butter Market

Published : May 2023

Food and Beverage

Vegan Yogurt Market

Published : February 2023

Explore Food and Beverage Insights

View Reports