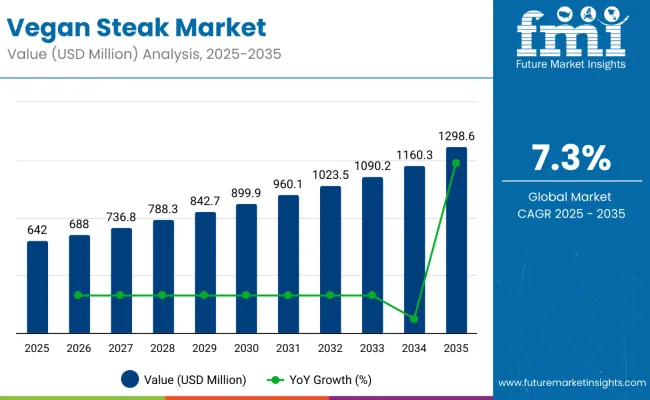
The vegan steak market is estimated to be valued at USD 642 million in 2025 and is projected to reach USD 1,298.6 million by 2035, registering a compound annual growth rate (CAGR) of 7.3% over the forecast period.
| Metric | Value |
|---|---|
| Estimated Size (2025E) | USD 642 million |
| Projected Value (2035F) | USD 1,298.6 million |
| CAGR (2025 to 2035) | 7.3% |
The market is projected to add an absolute dollar opportunity of USD 656.6 million during this period. This reflects a 2.02 times growth at a compound annual growth rate of 7.3%. The market evolution is expected to be shaped by rising demand for sustainable protein alternatives, flexitarian dietary trends, and advanced plant-based food technologies, particularly where realistic texture and enhanced nutritional profiles are required.
By 2030, the market is likely to reach USD 945.5 million, accounting for USD 304million in incremental value over the first half of the decade. The remaining USD 352 million is expected during the second half, suggesting a moderately back-loaded growth pattern. Product innovation in texture replication and clean-label formulations is gaining traction due to the favorable advantages of vegan steak and improved taste profiles.
Companies such as Beyond Meat and Impossible Foods are advancing their competitive positions through investment in advanced food technology and scalable production systems. Health-conscious and environmentally-aware procurement models are supporting expansion into retail, foodservice, and premium dining applications. Market performance will remain anchored in taste authenticity, nutritional completeness, and sustainable sourcing benchmarks.
The market holds a strong position within the plant-based meat industry, reflecting its growing adoption in retail, foodservice, and household consumption. Within the overall plant-based meat category, vegan steak contributes notably as a premium segment, with its share estimated at about 8.5% in 2025.Within the vegan food market, it contributes around 4.2%, with growth supported by health-conscious and flexitarian consumers. It holds nearly 10.1% share in the meat alternatives market, where demand is accelerating due to innovation in texture and flavor. In the plant-based protein market, vegan steak comprises about 6.8%, as protein-rich options gain popularity. Its share in clean-label and sustainable food markets remains below 3%, but is expected to rise with product transparency trends.
The market is being driven by government incentives for food production and clearer plant-based labeling laws that support expansion. Cutting-edge innovations, including 3D-printed steaks, fiber-spinning techniques, and clean-label product development, will enable brands to differentiate themselves and achieve greater scale. Retailers are strategically placing vegan steak products alongside traditional meat options to attract flexitarian consumers, while influencer-driven marketing campaigns are boosting global awareness and consumer engagement. These combined factors create a favorable environment for market expansion, positioning vegan steaks as increasingly mainstream alternatives.
Vegan steak's realistic texture, improved taste profiles, and complete protein content make it an attractive alternative for health-conscious consumers and flexitarians seeking sustainable protein solutions without compromising on culinary experience. Advanced food technology innovations, including 3D printing, fiber-spinning techniques, and plant protein isolation, have significantly enhanced product quality, making vegan steaks nearly indistinguishable from conventional meat in appearance and texture.
Growing environmental awareness and climate change concerns are further propelling adoption, especially among millennials and Gen Z consumers prioritizing sustainable food choices. Government support for plant-based agriculture, clearer labeling regulations, and corporate sustainability commitments are also enhancing market accessibility and consumer confidence.
As health and wellness trends accelerate across demographics and clean-label preferences become critical, the market outlook remains exceptionally favorable. With consumers increasingly prioritizing protein quality, environmental impact, and ethical considerations, vegan steaks are well-positioned to expand across retail, food service, and direct-to-consumer applications globally.
The market is segmented by source, distribution channel, end user, and region. By source, the market is divided into soy, almond, wheat, and others (pea protein, fava beans, and chickpeas). Based on distribution channel, the market is categorized into supermarkets/hypermarkets, convenience stores, specialty stores, online platforms, and others (foodservice distributors and direct-to-consumer channels). In terms of end user, the market is categorized into packaged food industries, hotels and restaurants, retail food shops, domestic consumers, and others (institutional buyers and cafeterias). Regionally, the market spans across North America, Latin America, Western Europe, Eastern Europe, South Asia & Pacific, East Asia, and the Middle East & Africa.
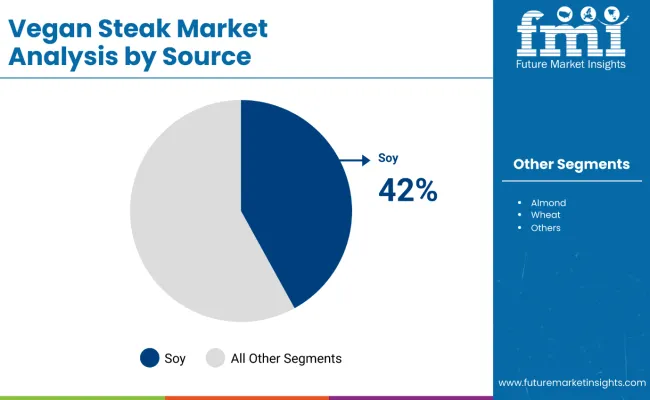
The soy segment holds a dominant position with 42% of the market share in the source category, owing to its high protein content, affordability, and well-established global supply chains. Soy protein offers a complete amino acid profile and demonstrates exceptional adaptability in food technology applications, enabling realistic texture replication that enhances consumer acceptance across vegan steak formulations.
Soy's versatility makes it indispensable in both frozen and ready-to-cook vegan steak formats, while its functional properties are highly favored by food manufacturers for processing efficiency. As demand for nutritionally complete and cost-effective plant-based proteins grows, soy continues to maintain its leadership position despite emerging competition from wheat and almond sources.
Manufacturers are investing in advanced processing techniques and protein extraction methods to enhance texture, taste, and nutritional density. The segment is positioned for sustained growth as global supply chains favor established, scalable, and nutritionally robust plant protein sources.
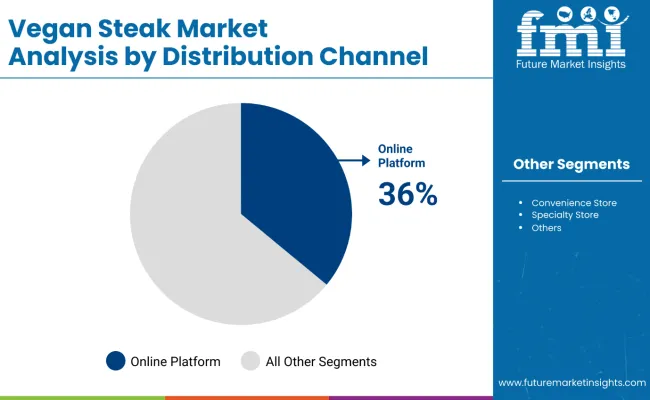
Online platforms dominate distribution with 36% share in 2025, supported by e-commerce adoption among younger demographics and urban consumers seeking convenience and product variety. Digital channels offer superior product accessibility, enabling consumers to compare nutritional content, prices, and read reviews before purchasing.
The segment benefits from targeted digital marketing, influencer endorsements, and direct-to-door delivery services that enhance customer experience. Online platforms also provide brands with valuable consumer data and the flexibility to test new SKUs before mass retail rollout.
Growing preference for contactless shopping, subscription-based purchasing, and the ability to access specialty vegan products not available in traditional retail are key trends driving sustained growth in online distribution channels.
In 2024, global vegan steak consumption grew by 23% year-on-year, with North America and Europe taking a combined 67% market share. Applications include restaurant menu diversification, alternative retail meat sections, and premium food service offerings. Manufacturers are introducing advanced plant protein technologies and multi-layered texture innovations that deliver realistic meat-like experiences and enhanced nutritional profiles. Clean-label formulations now support transparent ingredient positioning and consumer trust. Environmental sustainability trends and health-conscious consumption patterns support growing consumer confidence. Technology providers increasingly supply ready-to-cook vegan steak solutions with integrated flavor profiles to reduce preparation complexity for food service operators.
Health and Environmental Consciousness Drive Vegan Steak Adoption
Food manufacturers and restaurant chains are choosing vegan steak products to meet consumer demands for sustainable protein alternatives and reduce environmental impact. In nutritional comparisons, premium vegan steaks deliver up to 20g of protein per serving while containing zero cholesterol compared to conventional beef steaks at 25g of protein with 85mg of cholesterol. Products featuring plant-based ingredients maintain flavor consistency throughout cooking processes and storage cycles. In restaurant applications, vegan steak menu items help reduce carbon footprint by up to 75% while attracting flexitarian customers seeking sustainable dining options. Vegan steak adoption is now being used for ESG positioning, which increases uptake in corporate food service sectors focused on environmental responsibility. These advantages help explain why vegan steak adoption rates in food service rose 41% in 2024 across major metropolitan markets.
Production Costs, Taste Barriers and Market Education Constraints Restrict Expansion
Growth faces constraints due to high ingredient costs, complex manufacturing processes, and consumer taste expectations. Premium plant protein ingredients can cost $8-12 per pound compared to conventional ground beef at $4-6 per pound, impacting retail pricing and leading to market penetration challenges of up to 18% in price-sensitive segments. Advanced processing technology requirements and flavor development cycles add 8 to 12 months to product launch timelines. Consumer education needs and taste perception barriers extend market acceptance phases by 15-25% compared to traditional plant-based products. Limited availability among specialized manufacturing facilities restricts scalable production, especially for texture-enhanced formulations requiring proprietary processing equipment.
| Countries | CAGR (2025 to 2035) |
|---|---|
| Brazil | 9.2% |
| India | 8.2% |
| UK | 7.1% |
| USA | 6.8% |
| China | 6.5% |
| Germany | 5.8% |
| France | 5.5% |
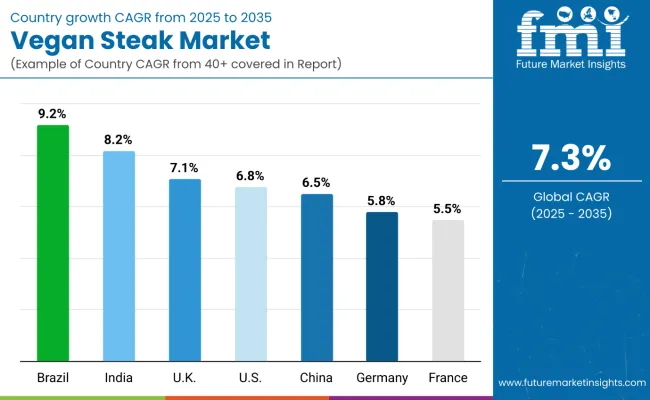
The market shows varied growth trajectories across the top seven countries. Brazil leads with the highest projected CAGR of 9.2% from 2025 to 2035, driven by expanding vegan demographics and increasing health consciousness. India follows closely with 8.2%, supported by traditional vegetarian culture and rising disposable income. The UK shows strong growth at 7.1%, benefiting from advanced plant-based adoption and retail innovation. The USA demonstrates moderate expansion at 6.8%, reflecting market maturity but sustained consumer interest. China maintains steady growth at 6.5%, leveraging established plant-based eating habits. In comparison, Germany and France show conservative growth at 5.8% and 5.5% respectively, indicating mature European market conditions but consistent demand for sustainable protein alternatives.
The report covers an in-depth analysis of 40+ countries; seven top-performing OECD countries are highlighted below.
Revenue from vegan steak in Brazil is projected to grow at a CAGR of 9.2% from 2025 to 2035, driven by the expanding vegan population in the country and increasing health consciousness across major urban centers like São Paulo, Rio de Janeiro, and Brasília. Brazilian food manufacturers are investing in soy-based protein technologies and local ingredient sourcing to improve product accessibility and affordability. Strong domestic soybean production capabilities and growing retail penetration in supermarket chains are reinforcing the position of Brazil as a leading emerging market for plant-based meat alternatives in Latin America.
Key Statistics
Demand for vegan steak in India is expected to grow at a CAGR of 8.2% from 2025 to 2035, due to traditional vegetarian culture adaptation and rising middle-class purchasing power in metropolitan areas, including Mumbai, Delhi, and Bangalore. Advanced plant protein processing technologies and local ingredient integration are being deployed for mainstream food applications and premium dining experiences. Government support for sustainable agriculture and protein diversification initiatives further strengthens domestic vegan steak production capabilities and consumer adoption rates.
Key Statistics
Sales of vegan steak in UK are projected to expand at a CAGR of 7.1% from 2025 to 2035, due to increasing use of premium plant-based applications and innovative food service offerings in the London, Manchester, and Edinburgh regions. Vegan steak adoption is shifting from niche health food stores toward mainstream supermarket positioning and restaurant integration. Advanced food technology partnerships and specialized processing capabilities lead commercial vegan steak product development. EU regulatory framework compliance and UK food innovation standards support continued product diversification and quality enhancement initiatives.
Key Statistics
Revenue from vegan steak in the USA is expected to grow at a CAGR of 6.8% from 2025 to 2035, driven by health-conscious millennials and Gen Z consumers across major metropolitan areas, including California, New York, and Texas markets. Food service establishments and retail chains are increasingly adopting vegan steak products for menu diversification and consumer choice expansion. However, market growth faces challenges from ingredient cost inflation and competitive pressure from traditional meat producers. Federal dietary guidelines and sustainability initiatives have supported plant-based protein consumption growth patterns.
Key Statistics
The vegan steak market in China is projected to grow at a CAGR of 6.5% from 2025 to 2035, supported by established Buddhist vegetarian traditions and increasing health awareness among urban populations. Major cities like Beijing, Shanghai, and Shenzhen are experiencing increased demand for plant-based protein alternatives, particularly among younger demographics aged 25-40. Domestic food manufacturers are leveraging traditional soy processing expertise and modern food technology to create culturally appropriate vegan steak products.
Key Statistics
Sales of vegan steak in Germany are expected to grow at a CAGR of 5.8% from 2025 to 2035, driven by strong consumer demand for clean-label foods, government support for sustainable diets, and the widespread availability of plant-based options in both retail chains and specialty stores. German food manufacturers are emphasizing clean-label ingredients and advanced processing technologies to meet stringent quality standards and consumer expectations. EU organic certification standards and German food safety regulations drive product innovation toward high-quality, sustainable vegan steak alternatives with transparent ingredient sourcing.
Key Statistics
The vegan steak market in France is expected to grow at a CAGR of 5.5% from 2025 to 2035, driven by increasing environmental awareness and chef-driven innovation in high-end restaurants and specialty food establishments. Market development is focused on premium culinary applications and gourmet food integration in the Paris, Lyon, and Marseille regions. French consumers demonstrate a preference for artisanal and locally-sourced plant-based products that align with traditional culinary values and quality standards.
Key Statistics
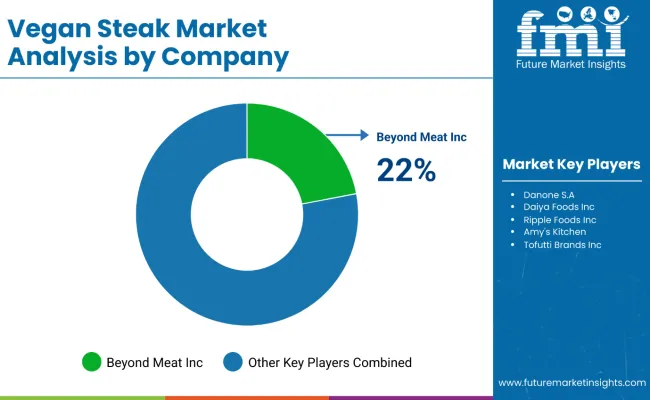
The market is moderately consolidated, featuring a mix of global plant-based leaders, specialized food technology companies, and regional players with varying degrees of innovation expertise, processing capabilities, and market penetration strategies. Beyond Meat Inc. and Impossible Foods Inc. lead the market segment, commanding 40% combined market share through extensive retail distribution, advanced food technology, and established relationships with major foodservice operators. Their strength lies in comprehensive plant protein processing capabilities, significant R&D investments, and pioneering texture innovations that closely replicate traditional meat experiences.
Danone S.A., The Archer Daniels Midland Company, and Gardein differentiate through large-scale manufacturing capabilities, established food industry expertise, and multi-category plant-based portfolios that leverage existing distribution networks. Specialized players such as Daiya Foods Inc., Ripple Foods Inc., and Amy's Kitchen focus on niche market positioning, clean-label formulations, and targeted consumer segments, while Eat Just Inc. leverages its food technology expertise beyond egg alternatives. Regional specialists like Field Roast, Tofutti Brands Inc., and Earth's Own Food Company Inc. emphasize specialized processing technologies, premium positioning, and localized taste preferences, capturing 30% of regional market segments.
Entry barriers remain significant, driven by challenges in advanced food technology development, plant protein sourcing complexities, and substantial capital requirements for scaling production while maintaining competitive pricing against conventional meat products. Competitiveness increasingly depends on texture replication accuracy, cost optimization capabilities, and the ability to achieve mainstream retail penetration across diverse consumer demographics seeking sustainable protein alternatives.
| Items | Values |
|---|---|
| Quantitative Units (2025) | USD 642 million |
| Source | Soy, Almond, Wheat, and Others |
| Distribution Channel | Supermarkets/Hypermarkets, Convenience Stores, Specialty Stores, Online Platforms, and Others |
| End User | Packaged Food Industries, Hotels and Restaurants, Retail Food Shops, Domestic Consumers, and Others |
| Regions Covered | North America, Latin America, Western Europe, Eastern Europe, East Asia, South Asia & Pacific, and Middle East & Africa |
| Countries Covered | United States, Canada, United Kingdom, Germany, France, China, Japan, South Korea, Brazil, Australia and 40+ countries |
| Key Companies Profiled | Danone S.A., The Archer Daniels Midland Company, Daiya Foods Inc., Ripple Foods Inc., Impossible Foods Inc., Eat Just, Inc., Beyond Meat, Inc., Amy's Kitchen, Tofutti Brands Inc., Earth’s Own Food Company Inc., Gardein, and Field Roast |
| Additional Attributes | Dollar sales by source, distribution channel, regional demand trends, competitive landscape, consumer preferences for natural versus synthetic alternatives, integration with responsible sourcing practices, innovations in extraction technology, and quality standardization for diverse industrial applications |
The global vegan steak market is estimated to be valued at USD 642.0 million in 2025.
The market size for the vegan steak market is projected to reach USD 1,260.0 million by 2035.
The vegan steak market is expected to grow at a 7.0% CAGR between 2025 and 2035.
The key product types in vegan steak market are soy, almond, wheat and others.
In terms of distribution channel, supermarkets/hypermarkets segment to command 41.8% share in the vegan steak market in 2025.


Our Research Products

The "Full Research Suite" delivers actionable market intel, deep dives on markets or technologies, so clients act faster, cut risk, and unlock growth.

The Leaderboard benchmarks and ranks top vendors, classifying them as Established Leaders, Leading Challengers, or Disruptors & Challengers.

Locates where complements amplify value and substitutes erode it, forecasting net impact by horizon

We deliver granular, decision-grade intel: market sizing, 5-year forecasts, pricing, adoption, usage, revenue, and operational KPIs—plus competitor tracking, regulation, and value chains—across 60 countries broadly.

Spot the shifts before they hit your P&L. We track inflection points, adoption curves, pricing moves, and ecosystem plays to show where demand is heading, why it is changing, and what to do next across high-growth markets and disruptive tech

Real-time reads of user behavior. We track shifting priorities, perceptions of today’s and next-gen services, and provider experience, then pace how fast tech moves from trial to adoption, blending buyer, consumer, and channel inputs with social signals (#WhySwitch, #UX).

Partner with our analyst team to build a custom report designed around your business priorities. From analysing market trends to assessing competitors or crafting bespoke datasets, we tailor insights to your needs.
Supplier Intelligence
Discovery & Profiling
Capacity & Footprint
Performance & Risk
Compliance & Governance
Commercial Readiness
Who Supplies Whom
Scorecards & Shortlists
Playbooks & Docs
Category Intelligence
Definition & Scope
Demand & Use Cases
Cost Drivers
Market Structure
Supply Chain Map
Trade & Policy
Operating Norms
Deliverables
Buyer Intelligence
Account Basics
Spend & Scope
Procurement Model
Vendor Requirements
Terms & Policies
Entry Strategy
Pain Points & Triggers
Outputs
Pricing Analysis
Benchmarks
Trends
Should-Cost
Indexation
Landed Cost
Commercial Terms
Deliverables
Brand Analysis
Positioning & Value Prop
Share & Presence
Customer Evidence
Go-to-Market
Digital & Reputation
Compliance & Trust
KPIs & Gaps
Outputs
Full Research Suite comprises of:
Market outlook & trends analysis
Interviews & case studies
Strategic recommendations
Vendor profiles & capabilities analysis
5-year forecasts
8 regions and 60+ country-level data splits
Market segment data splits
12 months of continuous data updates
DELIVERED AS:
PDF EXCEL ONLINE
Competitive Breakdown of Vegan Steak Manufacturers
Vegan Vitamin D3 Supplements Market Size and Share Forecast Outlook 2025 to 2035
Vegan Cheese Market Size and Share Forecast Outlook 2025 to 2035
Vegan Confectionery Market Size and Share Forecast Outlook 2025 to 2035
Vegan Pasta Market Size and Share Forecast Outlook 2025 to 2035
Vegan Hyaluronic Acid Market Size and Share Forecast Outlook 2025 to 2035
Vegan Collagen Peptides Market Size and Share Forecast Outlook 2025 to 2035
Vegan Collagen Skincare Market Size and Share Forecast Outlook 2025 to 2035
Vegan Protein Powder Market Analysis - Size, Share, and Forecast 2025 to 2035
Vegan Tortillas Market Size and Share Forecast Outlook 2025 to 2035
Vegan Casing Market Size and Share Forecast Outlook 2025 to 2035
Vegan Dressing Market Size and Share Forecast Outlook 2025 to 2035
Vegan Cheese Sauce Market Size and Share Forecast Outlook 2025 to 2035
Vegan Dips Market Size and Share Forecast Outlook 2025 to 2035
Vegan Yogurt Market Size, Growth, and Forecast for 2025 to 2035
Vegan Meals Market Size, Growth, and Forecast for 2025 to 2035
Vegan Dog Food Market Analysis - Size, Share, and Forecast Outlook 2025 to 2035
Vegan Chocolate Market Analysis - Size, Share, and Forecast Outlook 2025 to 2035
Vegan Protein Bars Market Analysis – Size, Share & Trends 2025–2035
Vegan Vitamins and Supplements Market – Growth & Demand 2025 to 2035

Thank you!
You will receive an email from our Business Development Manager. Please be sure to check your SPAM/JUNK folder too.
Chat With
MaRIA