Reports

- Global Locations -

Headquarters

Future Market Insights, Inc.

Christiana Corporate, 200
Continental Drive, Suite 401,
Newark, Delaware - 19713,
United States

T: +1-845-579-5705

Americas

Future Market Insights, Inc.

616 Corporate Way, Suite 2-9018,
Valley Cottage, NY 10989, United States

T: +1-347-918-3531

MEA

Future Market Insights

1602-6 Jumeirah Bay X2 Tower, Plot No: JLT-PH2-X2A,
Jumeirah Lakes Towers, Dubai,
United Arab Emirates

Europe

Future Market Insights

3rd Floor, 207 Regent Street,
W1B 3HH London
United Kingdom

T: + 44 (0) 20 8123 9659
D: +44 (0) 20 3287 4268

Asia Pacific

Future Market Insights

IndiaLand Global Tech Park, Unit UG-1, Behind Grand HighStreet, Phase 1, Hinjawadi, MH, Pune – 411057, India

Vegan Cheese Sauce Market Outlook (2023 to 2033)

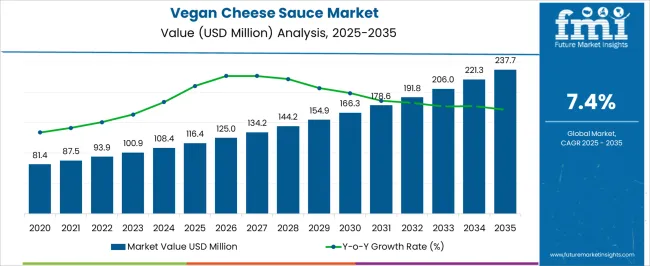
The global vegan cheese sauce market is expected to be valued at US$ 100.9 Million in 2023 and to reach a valuation of US$ 192.3 Million by 2033. Market expansion can be attributed to the growing popularity of veganism, especially among the younger generations. Consumers are increasingly choosing plant-based alternatives as they become more conscious of the dairy industry's detrimental effects on animals and the environment.

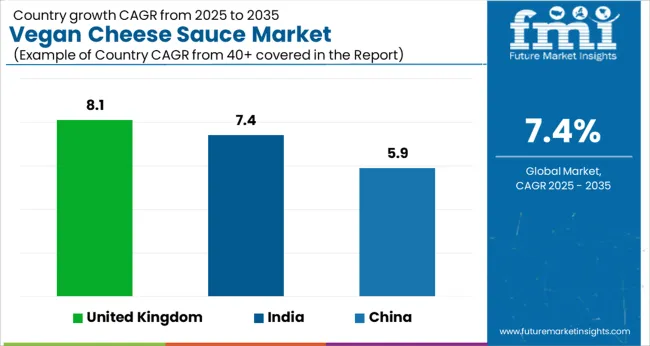
Owing to these factors, the demand for vegan cheese sauce is estimated to grow at a steady 7.4% CAGR, with the UK, the USA, Germany, and Japan emerging as key producers.

Research and development efforts to successfully replicate cheese compositions are in full swing at this time.

To expand as a business, the vegan cheese sauce market needs more money invested in research and development. Despite the brisk growth of the demand for vegan cheese sauce, especially in North America and Europe, it lags behind other plant-based food sectors like meat and dairy. But as competition in the vegan cheese industry heats up, several firms are investing heavily in future research to find ways to accurately replicate cheese's intricate structure and nuanced flavor qualities.

The vegan cheese sauce is on the rise, but modern shoppers are wary of its quality and nutritional profile. Therefore, there are active Research and Development projects aiming to replicate classic cheese's characteristics. As the trend toward plant-based diets continues to grow, the demand for vegan cheese sauce is expected to skyrocket.

Attributes Details
Vegan Cheese Sauce Market CAGR (2023 to 2033) 7.4%
Vegan Cheese Sauce Market Size (2023) US$ 100.9 Million
Vegan Cheese Sauce Market Size (2033) US$ 192.3 Million

Don't pay for what you don't need

Customize your report by selecting specific countries or regions and save 30%!

How is the Future Outlook for Vegan Cheese Sauce in Comparison to Historical Pattern?

The global demand for vegan cheese sauce grew at a CAGR of 7.3% between 2016 and 2022, and it's expected to expand at a CAGR of 7.4% between 2023 and 2033. The growth potential of the market could be looked at from short-term, mid-term, and long-term perspectives.

Short-Term Outlook (2023 to 2025): Increasing global demand for vegan cheese sauce is being fueled by shifting consumer eating tastes and new developments in the food and beverage industry. Consumer tastes have shifted as the number of people with lactose intolerance and other food allergies continues to rise among both young and old. The Food Intolerance Network reports that, as of early 2021, around 70% of the global population experienced lactose intolerance. This is expected to drive the demand in the short term.
Mid-Term Outlook (2025 to 2028): Industry growth in the Hotel/Restaurant/Café (HoReCa) sector is predicted to be bolstered by the millennial generation's trendiness toward veganism and vegetarian diets. In Saudi Arabia, for instance, vegan eateries have sprung up all over the place as a means of encouraging people to adopt more plant-based diets. Additionally, customers have been influenced to choose plant-based products due to the increased awareness of animal cruelty and worldwide worries over carbon footprint due to the animal-based diet. In addition to meat, the vegan population abstains from any items made from or including animals, including dairy (cheese, milk, cream, yogurt), eggs, and even honey, which is expected to boost the demand for vegan cheese sauce mid-term.
Long-Term Outlook (2028 to 2032): Long-term trends point to growth in demand due to an expanding vegan population and rising concerns for animals' welfare. The market's profit potential is expected to expand as a result of manufacturers' heightened attention to unique product offers and increased restrictions on animal-based food items.

The global vegan cheese sauce market is projected to be led by the proliferation of fast-food burger and pizza franchises.

A rise in global demand for cheese sauce can be attributed to the proliferation of pizza and burger fast-food restaurants as well as the growth of the pastry and bakery industry. In response to these demands, a number of well-established companies from around the world have entered the market, increasing competition significantly. The expansion of the market is forecasted to be driven by factors such as product innovation, customer retention, and price competition. In addition, developments in cheese sauces' nutritional value are likely to drive demand for cheese sauce among health-conscious customers, which is expected to further fuel the market.

The rising demand for vegan food products can be attributed to their greater availability at mass market retailers.

Products suitable for vegan diets can be found in many different types of businesses, from standard supermarkets to health food stores to internet markets to corner markets. The majority of these products are sold through grocery stores. In addition, a lot of the major supermarkets have recently started stocking vegan food options. Many grocery stores feature large window displays announcing the advent of novel plant-based product varieties. The fact that plant-based products have their own department in the supermarket probably helps to explain why they are so popular among shoppers.

Forecasted challenges for the worldwide cheese sauce industry include higher prices and potential health consequences.

However, the inevitable increase of veganism around the world is expected to be one of the primary causes holding back the sales of vegan cheese sauce. Higher prices and serious health concerns including obesity, cardiovascular disease (CVD), and diabetes are some factors that hinder the expansion of the worldwide cheese sauce industry.
Comparative View of Vegan Cheese Sauce Market

Vegan Cheese Sauce Market:

Attributes Vegan Cheese Sauce Market
CAGR (2023 to 2033) 7.4%
Market Value (2033) US$ 192.3 Million
Growth Factor Rise in the fast food franchises
Opportunity Growth in the market retailers
Restraints High cost of the products

Vegan Desserts Market:

Attributes Vegan Desserts Market
CAGR (2023 to 2033) 8.5%
Market Value (2033) US$ 192.3 Million
Growth Factor The growing interest in vegan products
Opportunity Product innovation and continuous research by manufacturers
Restraints High relative cost

Vegan Cookies Market:

Attributes Vegan Cookies Market
CAGR (2023 to 2033) 8.5%
Market Value (2033) US$ 773 Million
Growth Factor Rise in veganism
Opportunity Vegan cookie sales are soaring as manufacturers provide an increasing number of vegan cookie options.
Restraints The lack of essential vitamins and minerals is a growing problem that could have serious consequences in the future.
Nandini Roy Choudhury

Principal Consultant

Talk to Analyst

Find your sweet spots for generating winning opportunities in this market.

Country-wise Insights

How Will the Vegan Cheese Sauce Market Expand Across the USA?

Owing to the growing number of health-conscious consumers in North America who want to boost their immune systems, the vegan cheese sauce business has seen a surge in activity. In an effort to lessen their risk of developing allergies or eczema, consumers are increasingly turning to plant-based alternatives.

Vegan cheese sauce may not be widely used during the coronavirus pandemic due to a combination of factors, including a lack of information about its benefits and high prices. Therefore, brands in the North American vegan cheese sauce industry are focusing their marketing efforts on niche consumers through stores and online. The market is expected to continue to see growth as more people learn about the immune-boosting effects of plant-based cheese.

Notable Developments in the USA Vegan Cheese Sauce Industry:

Companies that have traditionally made cheese from milk are increasingly interested in diversifying their product line by introducing cheese made from other sources. The rising demand for plant-based products has prompted companies across the board to invest heavily in the purchase and development of new products and brands.

A total of six new vegan cheese sauces in six flavours and two styles were introduced by French dairy producer Bel Brands in April 2021. Cheese shreds, slices, and spreads are now available under Danone's plant-based dairy-free brand, So Delicious.

Will the UK Continue Dominating the Vegan Cheese Sauce Market?

CAGR (2023 to 2033) 8.1%
UK Vegan Cheese Sauce Market Share 9.4%
UK Vegan Cheese Sauce Market Valuation (2022) US$ 8.8 Million
UK Vegan Cheese Sauce Market Valuation (2033) US$ 20.8 Million

One of the major factors in bad health in the United Kingdom is obesity, says Public Health England. The demand for food products with healthy ingredients is rising as people become more aware of the importance of taking care of their health. The alternative plant-based movement has gained substantial traction in the UK. In addition, these factors, as well as allergen-free varieties of traditional products (gluten-free & lactose-free) that have been extensively acknowledged by the growing number of single-person homes, have permeated the market.

Notable Developments in the UK Vegan Cheese Sauce Industry:

In January 2022, vegan cheese sauce debuted under Aldi UK's Plant Menu label. This product is made from coconut oil and does not include any gluten or soy.

Two vegan pizzas, prepared with hand-stretched vegan dough and a plant-based cheese that does not include any dairy or animal-derived components, were reportedly introduced by Dominoes in September 2020. Also, the classic garlic and herb dip is now available in a vegan-friendly form.

Norseland Ltd., known for its Applewood brand of dairy products, reportedly plans to release a spicy plant-based version of its famous cheese flavour in July 2020, expanding its dairy-free range. The new vegan version shares the same lack of soy, nuts, milk, lactose, gluten, and eggs as the old one.

Why China is Considered an Attractive Heat recovery Generator Market?

CAGR (2023 to 2033) 5.9%
China Vegan Cheese Sauce Market Share 9.5%
China Vegan Cheese Sauce Market Valuation (2022) US$ 8.94 Million
China Vegan Cheese Sauce Market Valuation (2033) US$ 16.8 Million

Chinese companies are investing heavily in product development and acquisitions to expand their product lines and meet the growing demand of Chinese consumers. Moreover, in response to the growing demand, a select number of major retailers have added more shelf space to their stores' plant-based product sections.

Notable Developments in the China Vegan Cheese Sauce Industry:

Funacho, a manufacturer and distributor of food dispensing equipment and items such as cheese, chilli, and condiments, has released a new, patented chilli/cheese sauce dispenser. The manufacturer claims that the dual-head, gravity-fed dispenser, which uses bottle-type cartridges to hold the substance, results in higher extraction rates than bag-type dispensers. FUNacho cartridges only contain shelf-stable, microbially safe food ingredients. The dispenser has a footprint of 10 inches wide and can store 300 ounces of product.

Will India Emerge as a Lucrative Market?

CAGR (2023 to 2033) 7.4%
India Vegan Cheese Sauce Market Share 3.2%
India Vegan Cheese Sauce Market Valuation (2022) US$ 3 Million
India Vegan Cheese Sauce Market Valuation (2033) US$ 6.6 Million

India ranks among the world's top consumers of vegan cheese sauce. The demand for vegan cheese sauce in India is anticipated to increase thanks to several causes, including a shift in consumption patterns, an increase in the desire for plant-based dairy products, an increase in disposable income, and a rise in the adoption of western lifestyles generally.

In addition, the hospitality and restaurant sectors have been major drivers of the vegan cheese sauce business expansion through the labelling and appetiser use of vegan cheese sauce in their establishments. Plant-based cheese is becoming more popular among lactose-intolerant and dairy-sensitive individuals.

Notable Developments in the Indian Vegan Cheese Sauce Industry:

Goodmylk, an Indian dairy company, announced in March 2022 that it has acquired the PRO2FIT nutrition brand. The acquisition of PRO2FIT shows that the Indian vegan cheese sauce market is maturing. The goals of both companies to increase people's access to healthy plant-based options led them to collaborate.

Upfield Group, a company that makes vegan butter and spreads, said in January 2020 that it had acquired Arivia, a company that makes vegan cheese sauce. Strategically, Upfield Group of Companies has acquired Arivia and its VIOLIFE brand, adding it to its roster of well-known brands including Flora, Rama, Country Crock, Blue Band, and Proactiv.

Category-wise Insights

It is anticipated that the cashew category, which accounted for over 35.0% of total sales, will continue to dominate throughout the projection period. Vegetarian cheese made from cashews is a good source of protein and is fat-free, plus it's rich in vitamins B2 and B12. Due to this, it is well-liked among health-conscious shoppers all around the globe. Cashew products that don't contain gluten or cholesterol are very popular because of their positive health effects.

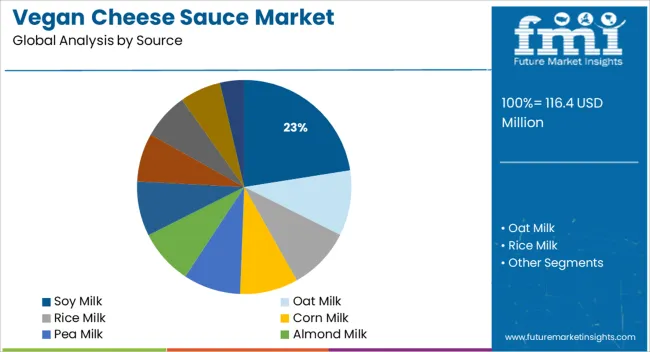
From 2023 to 2033, the soy industry is expected to post the highest CAGR, at 28.2%%. Soy milk is a cheap alternative to dairy that contains an ideal ratio of fatty acids to amino acids. This makes it a practical option for commercial vegan cheese sauce manufacturers. Cheese made from soy is becoming increasingly popular since it melts like regular cheese.

Segment Distribution Channel
Top Sub-segment Mom and Pop Stores
Market Share 10.3%
Segment Source Type
Top Sub-segment Soy Milk
Market Share 28.2%

Get the data you need at a Fraction of the cost

Personalize your report by choosing insights you need
and save 40%!

Competitive Landscape

There are a lot of national and multinational firms competing in the worldwide market. As the demand for vegan goods rises, major manufacturers have been releasing new products. Examples include Aldi UK's introduction of vegan cheese in January 2022, under the Plant Menu label. It's free of gluten and soy and produced with coconut oil.

Upfield introduced their vegan cheese, Violife, to the Middle East in July 2021. The line would have two tastes, such as cheddar, and mozzarella, and be available in a variety of formats, including slices, boxes, and grated. Treeline Cheese introduced its line of vegan cream cheese in March 2020. The cheese is produced from cultivated cashew nuts and other plant-based ingredients. Three tastes are offered: basic, chive and onion, and strawberry.

Key Segments

By Source:

  • Almond Milk
  • Soy Milk
  • Coconut Milk
  • Cashew Milk
  • Others

By End-Use:

  • Food Processing
  • Baked Goods
  • Sauces, Dips, and Dressings
  • Snacks
  • Processed and Packed Foods
  • Ready Meals
  • Dairy and Desserts
  • Food Service/HoReCa (Hotels, Restaurants, Cafes)
  • Household/Retail

By Nature:

  • Conventional
  • Organic

By Sales Channel:

  • Direct Sales
  • Indirect Sales
    • Hypermarkets/Supermarkets
    • Convenience Stores
    • Speciality Retail Stores
    • Traditional Grocery Stores
    • Online Retailers

By Region:

  • North America
  • Latin America
  • Europe
  • Asia Pacific (APAC)
  • Middle East & Africa (MEA)

Frequently Asked Questions

How Much is the Vegan Cheese Sauce Market Worth?

The Vegan Cheese Sauce market is estimated to be worth US$ 100.9 Million in 2023.

What is the Demand Outlook for the Vegan Cheese Sauce Market?

The Vegan Cheese Sauce market is expected to be valued at US$ 192.3 Million by 2033.

At What Rate Does the Vegan Cheese Sauce Market Grow in the Last Five Years?

The Vegan Cheese Sauce market expanded at 7.2% CAGR in the last five years, from 2017 to 2022.

Which Segment has the Highest Potential in the Vegan Cheese Sauce Market?

Mom and Pop stores accounted for nearly 10.3% market share in the global Vegan Cheese Sauce market in 2023.

Table of Content

1. Executive Summary | Vegan Cheese Sauce Market

    1.1. Global Market Outlook

    1.2. Demand-side Trends

    1.3. Supply-side Trends

    1.4. Technology Roadmap Analysis

    1.5. Analysis and Recommendations

2. Market Overview

    2.1. Market Coverage / Taxonomy

    2.2. Market Definition / Scope / Limitations

3. Market Background

    3.1. Market Dynamics

        3.1.1. Drivers

        3.1.2. Restraints

        3.1.3. Opportunity

        3.1.4. Trends

    3.2. Scenario Forecast

        3.2.1. Demand in Optimistic Scenario

        3.2.2. Demand in Likely Scenario

        3.2.3. Demand in Conservative Scenario

    3.3. Product launches & Recent Developments

    3.4. Product Life Cycle Analysis

    3.5. Value Chain Analysis

        3.5.1. Supply Side Participants and their Roles

            3.5.1.1. Producers

            3.5.1.2. Mid-Level Participants (Traders/ Agents/ Brokers)

            3.5.1.3. Wholesalers and Distributors

        3.5.2. % of Operating Margin Analysis

        3.5.3. List of Raw Material Suppliers

        3.5.4. List of Existing and Potential Buyers

    3.6. Global Market - Pricing Analysis

        3.6.1. Price Point Assessment by Region

        3.6.2. Price Forecast till 2033

        3.6.3. Factors affecting pricing

    3.7. Forecast Factors - Relevance & Impact

    3.8. PESTLE and Porter’s Analysis

    3.9. Regulatory Landscape

        3.9.1. Packaging & Labelling Regulations

        3.9.2. Certifications and Certifying Agency Overview

        3.9.3. Import/Export Policies

    3.10. Regional Parent Market Outlook

    3.11. Production and Consumption Statistics

    3.12. Import and Export Statistics

    3.13. Consumers Survey Analysis

    3.14. Macro-Economic Factors

    3.15. Product Claims & Nutritional Information scanned by Buyers

4. Global Market Analysis 2018 to 2022 and Forecast, 2023 to 2033

    4.1. Historical Market Size Value (US$ Million) & Volume (MT) Analysis, 2018 to 2022

    4.2. Current and Future Market Size Value (US$ Million) & Volume (MT) Projections, 2023 to 2033

        4.2.1. Y-o-Y Growth Trend Analysis

        4.2.2. Absolute $ Opportunity Analysis

5. Global Market Analysis 2018 to 2022 and Forecast 2023 to 2033, By Source

    5.1. Introduction / Key Findings

    5.2. Historical Market Size Value (US$ Million) & Volume (MT) Analysis By Source, 2018 to 2022

    5.3. Current and Future Market Size Value (US$ Million) & Volume (MT) Analysis and Forecast By Source, 2023 to 2033

        5.3.1. Oat Milk

        5.3.2. Rice Milk

        5.3.3. Corn Milk

        5.3.4. Soy Milk

        5.3.5. Pea Milk

        5.3.6. Almond Milk

        5.3.7. Coconut Milk

        5.3.8. Cashews Milk

        5.3.9. Flax Milk

        5.3.10. Hemp Milk

        5.3.11. Others (Nuts, Cassava, etc.)

    5.4. Y-o-Y Growth Trend Analysis By Source, 2018 to 2022

    5.5. Absolute $ Opportunity Analysis By Source, 2023 to 2033

6. Global Market Analysis 2018 to 2022 and Forecast 2023 to 2033, By Sales Channel

    6.1. Introduction / Key Findings

    6.2. Historical Market Size Value (US$ Million) & Volume (MT) Analysis By Sales Channel, 2018 to 2022

    6.3. Current and Future Market Size Value (US$ Million) & Volume (MT) Analysis and Forecast By Sales Channel, 2023 to 2033

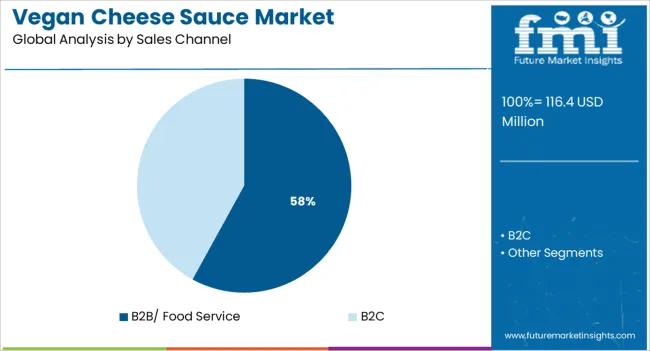
        6.3.1. B2B/ Food Service

            6.3.1.1. Hotels

            6.3.1.2. Restaurants

            6.3.1.3. Cafes

        6.3.2. B2C

            6.3.2.1. Hypermarkets / Supermarkets

            6.3.2.2. Convenience Stores

            6.3.2.3. Mom-and-Pop Stores

            6.3.2.4. Discount Stores

            6.3.2.5. Food & Drink Specialty Stores

            6.3.2.6. Independent Small Groceries

            6.3.2.7. Online Retail

            6.3.2.8. Other Retail Formats

    6.4. Y-o-Y Growth Trend Analysis By Sales Channel, 2018 to 2022

    6.5. Absolute $ Opportunity Analysis By Sales Channel, 2023 to 2033

7. Global Market Analysis 2018 to 2022 and Forecast 2023 to 2033, By Region

    7.1. Introduction

    7.2. Historical Market Size Value (US$ Million) & Volume (MT) Analysis By Region, 2018 to 2022

    7.3. Current Market Size Value (US$ Million) & Volume (MT) Analysis and Forecast By Region, 2023 to 2033

        7.3.1. North America

        7.3.2. Latin America

        7.3.3. Europe

        7.3.4. East Asia

        7.3.5. South Asia

        7.3.6. Oceania

        7.3.7. Middle East and Africa (MEA)

    7.4. Market Attractiveness Analysis By Region

8. North America Market Analysis 2018 to 2022 and Forecast 2023 to 2033, By Country

    8.1. Historical Market Size Value (US$ Million) & Volume (MT) Trend Analysis By Market Taxonomy, 2018 to 2022

    8.2. Market Size Value (US$ Million) & Volume (MT) Forecast By Market Taxonomy, 2023 to 2033

        8.2.1. By Country

            8.2.1.1. United States of America

            8.2.1.2. Canada

        8.2.2. By Source

        8.2.3. By Sales Channel

    8.3. Market Attractiveness Analysis

        8.3.1. By Country

        8.3.2. By Source

        8.3.3. By Sales Channel

    8.4. Key Takeaways

9. Latin America Market Analysis 2018 to 2022 and Forecast 2023 to 2033, By Country

    9.1. Historical Market Size Value (US$ Million) & Volume (MT) Trend Analysis By Market Taxonomy, 2018 to 2022

    9.2. Market Size Value (US$ Million) & Volume (MT) Forecast By Market Taxonomy, 2023 to 2033

        9.2.1. By Country

            9.2.1.1. Brazil

            9.2.1.2. Mexico

            9.2.1.3. Argentina

            9.2.1.4. Chile

            9.2.1.5. Peru

            9.2.1.6. Rest of Latin America

        9.2.2. By Source

        9.2.3. By Sales Channel

    9.3. Market Attractiveness Analysis

        9.3.1. By Country

        9.3.2. By Source

        9.3.3. By Sales Channel

    9.4. Key Takeaways

10. Europe Market Analysis 2018 to 2022 and Forecast 2023 to 2033, By Country

    10.1. Historical Market Size Value (US$ Million) & Volume (MT) Trend Analysis By Market Taxonomy, 2018 to 2022

    10.2. Market Size Value (US$ Million) & Volume (MT) Forecast By Market Taxonomy, 2023 to 2033

        10.2.1. By Country

            10.2.1.1. Germany

            10.2.1.2. Italy

            10.2.1.3. France

            10.2.1.4. United Kingdom

            10.2.1.5. Spain

            10.2.1.6. Russia

            10.2.1.7. BENELUX

            10.2.1.8. Poland

            10.2.1.9. Nordic Countries

            10.2.1.10. Rest of Europe

        10.2.2. By Source

        10.2.3. By Sales Channel

    10.3. Market Attractiveness Analysis

        10.3.1. By Country

        10.3.2. By Source

        10.3.3. By Sales Channel

    10.4. Key Takeaways

11. East Asia Market Analysis 2018 to 2022 and Forecast 2023 to 2033, By Country

    11.1. Historical Market Size Value (US$ Million) & Volume (MT) Trend Analysis By Market Taxonomy, 2018 to 2022

    11.2. Market Size Value (US$ Million) & Volume (MT) Forecast By Market Taxonomy, 2023 to 2033

        11.2.1. By Country

            11.2.1.1. China

            11.2.1.2. Japan

            11.2.1.3. South Korea

        11.2.2. By Source

        11.2.3. By Sales Channel

    11.3. Market Attractiveness Analysis

        11.3.1. By Country

        11.3.2. By Source

        11.3.3. By Sales Channel

    11.4. Key Takeaways

12. South Asia Market Analysis 2018 to 2022 and Forecast 2023 to 2033, By Country

    12.1. Historical Market Size Value (US$ Million) & Volume (MT) Trend Analysis By Market Taxonomy, 2018 to 2022

    12.2. Market Size Value (US$ Million) & Volume (MT) Forecast By Market Taxonomy, 2023 to 2033

        12.2.1. By Country

            12.2.1.1. India

            12.2.1.2. Thailand

            12.2.1.3. Malaysia

            12.2.1.4. Indonesia

            12.2.1.5. Singapore

            12.2.1.6. Rest of South Asia

        12.2.2. By Source

        12.2.3. By Sales Channel

    12.3. Market Attractiveness Analysis

        12.3.1. By Country

        12.3.2. By Source

        12.3.3. By Sales Channel

    12.4. Key Takeaways

13. Oceania Market Analysis 2018 to 2022 and Forecast 2023 to 2033, By Country

    13.1. Historical Market Size Value (US$ Million) & Volume (MT) Trend Analysis By Market Taxonomy, 2018 to 2022

    13.2. Market Size Value (US$ Million) & Volume (MT) Forecast By Market Taxonomy, 2023 to 2033

        13.2.1. By Country

            13.2.1.1. Australia

            13.2.1.2. New Zealand

        13.2.2. By Source

        13.2.3. By Sales Channel

    13.3. Market Attractiveness Analysis

        13.3.1. By Country

        13.3.2. By Source

        13.3.3. By Sales Channel

    13.4. Key Takeaways

14. MEA Market Analysis 2018 to 2022 and Forecast 2023 to 2033, By Country

    14.1. Historical Market Size Value (US$ Million) & Volume (MT) Trend Analysis By Market Taxonomy, 2018 to 2022

    14.2. Market Size Value (US$ Million) & Volume (MT) Forecast By Market Taxonomy, 2023 to 2033

        14.2.1. By Country

            14.2.1.1. GCC Countries

            14.2.1.2. South Africa

            14.2.1.3. Central Africa

            14.2.1.4. North Africa

        14.2.2. By Source

        14.2.3. By Sales Channel

    14.3. Market Attractiveness Analysis

        14.3.1. By Country

        14.3.2. By Source

        14.3.3. By Sales Channel

    14.4. Key Takeaways

15. Key Countries Market Analysis

    15.1. United States of America

        15.1.1. Pricing Analysis

        15.1.2. Market Share Analysis, 2022

            15.1.2.1. By Source

            15.1.2.2. By Sales Channel

    15.2. Canada

        15.2.1. Pricing Analysis

        15.2.2. Market Share Analysis, 2022

            15.2.2.1. By Source

            15.2.2.2. By Sales Channel

    15.3. Brazil

        15.3.1. Pricing Analysis

        15.3.2. Market Share Analysis, 2022

            15.3.2.1. By Source

            15.3.2.2. By Sales Channel

    15.4. Mexico

        15.4.1. Pricing Analysis

        15.4.2. Market Share Analysis, 2022

            15.4.2.1. By Source

            15.4.2.2. By Sales Channel

    15.5. Argentina

        15.5.1. Pricing Analysis

        15.5.2. Market Share Analysis, 2022

            15.5.2.1. By Source

            15.5.2.2. By Sales Channel

    15.6. Chile

        15.6.1. Pricing Analysis

        15.6.2. Market Share Analysis, 2022

            15.6.2.1. By Source

            15.6.2.2. By Sales Channel

    15.7. Peru

        15.7.1. Pricing Analysis

        15.7.2. Market Share Analysis, 2022

            15.7.2.1. By Source

            15.7.2.2. By Sales Channel

    15.8. Germany

        15.8.1. Pricing Analysis

        15.8.2. Market Share Analysis, 2022

            15.8.2.1. By Source

            15.8.2.2. By Sales Channel

    15.9. Italy

        15.9.1. Pricing Analysis

        15.9.2. Market Share Analysis, 2022

            15.9.2.1. By Source

            15.9.2.2. By Sales Channel

    15.10. France

        15.10.1. Pricing Analysis

        15.10.2. Market Share Analysis, 2022

            15.10.2.1. By Source

            15.10.2.2. By Sales Channel

    15.11. Spain

        15.11.1. Pricing Analysis

        15.11.2. Market Share Analysis, 2022

            15.11.2.1. By Source

            15.11.2.2. By Sales Channel

    15.12. United Kingdom

        15.12.1. Pricing Analysis

        15.12.2. Market Share Analysis, 2022

            15.12.2.1. By Source

            15.12.2.2. By Sales Channel

    15.13. Russia

        15.13.1. Pricing Analysis

        15.13.2. Market Share Analysis, 2022

            15.13.2.1. By Source

            15.13.2.2. By Sales Channel

    15.14. Poland

        15.14.1. Pricing Analysis

        15.14.2. Market Share Analysis, 2022

            15.14.2.1. By Source

            15.14.2.2. By Sales Channel

    15.15. BENELUX

        15.15.1. Pricing Analysis

        15.15.2. Market Share Analysis, 2022

            15.15.2.1. By Source

            15.15.2.2. By Sales Channel

    15.16. Nordic Countries

        15.16.1. Pricing Analysis

        15.16.2. Market Share Analysis, 2022

            15.16.2.1. By Source

            15.16.2.2. By Sales Channel

    15.17. China

        15.17.1. Pricing Analysis

        15.17.2. Market Share Analysis, 2022

            15.17.2.1. By Source

            15.17.2.2. By Sales Channel

    15.18. Japan

        15.18.1. Pricing Analysis

        15.18.2. Market Share Analysis, 2022

            15.18.2.1. By Source

            15.18.2.2. By Sales Channel

    15.19. South Korea

        15.19.1. Pricing Analysis

        15.19.2. Market Share Analysis, 2022

            15.19.2.1. By Source

            15.19.2.2. By Sales Channel

    15.20. India

        15.20.1. Pricing Analysis

        15.20.2. Market Share Analysis, 2022

            15.20.2.1. By Source

            15.20.2.2. By Sales Channel

    15.21. Thailand

        15.21.1. Pricing Analysis

        15.21.2. Market Share Analysis, 2022

            15.21.2.1. By Source

            15.21.2.2. By Sales Channel

    15.22. Indonesia

        15.22.1. Pricing Analysis

        15.22.2. Market Share Analysis, 2022

            15.22.2.1. By Source

            15.22.2.2. By Sales Channel

    15.23. Malaysia

        15.23.1. Pricing Analysis

        15.23.2. Market Share Analysis, 2022

            15.23.2.1. By Source

            15.23.2.2. By Sales Channel

    15.24. Singapore

        15.24.1. Pricing Analysis

        15.24.2. Market Share Analysis, 2022

            15.24.2.1. By Source

            15.24.2.2. By Sales Channel

    15.25. Australia

        15.25.1. Pricing Analysis

        15.25.2. Market Share Analysis, 2022

            15.25.2.1. By Source

            15.25.2.2. By Sales Channel

    15.26. New Zealand

        15.26.1. Pricing Analysis

        15.26.2. Market Share Analysis, 2022

            15.26.2.1. By Source

            15.26.2.2. By Sales Channel

    15.27. GCC Countries

        15.27.1. Pricing Analysis

        15.27.2. Market Share Analysis, 2022

            15.27.2.1. By Source

            15.27.2.2. By Sales Channel

    15.28. South Africa

        15.28.1. Pricing Analysis

        15.28.2. Market Share Analysis, 2022

            15.28.2.1. By Source

            15.28.2.2. By Sales Channel

    15.29. North Africa

        15.29.1. Pricing Analysis

        15.29.2. Market Share Analysis, 2022

            15.29.2.1. By Source

            15.29.2.2. By Sales Channel

    15.30. Central Africa

        15.30.1. Pricing Analysis

        15.30.2. Market Share Analysis, 2022

            15.30.2.1. By Source

            15.30.2.2. By Sales Channel

16. Market Structure Analysis

    16.1. Competition Dashboard

    16.2. Competition Benchmarking

    16.3. Market Share Analysis of Top Players

        16.3.1. By Regional

        16.3.2. By Source

        16.3.3. By Sales Channel

17. Competition Analysis

    17.1. Competition Deep Dive

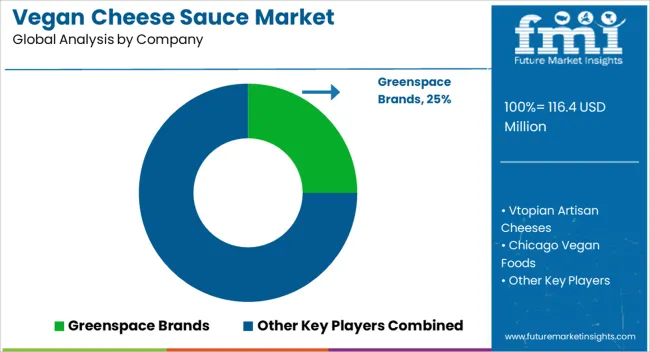
        17.1.1. Greenspace Brands

            17.1.1.1. Overview

            17.1.1.2. Product Portfolio

            17.1.1.3. Profitability by Market Segments (Product/Age /Sales Channel/Region)

            17.1.1.4. Sales Footprint

            17.1.1.5. Strategy Overview

                17.1.1.5.1. Marketing Strategy

                17.1.1.5.2. Product Strategy

                17.1.1.5.3. Channel Strategy

        17.1.2. Vtopian Artisan Cheeses

            17.1.2.1. Overview

            17.1.2.2. Product Portfolio

            17.1.2.3. Profitability by Market Segments (Product/Age /Sales Channel/Region)

            17.1.2.4. Sales Footprint

            17.1.2.5. Strategy Overview

                17.1.2.5.1. Marketing Strategy

                17.1.2.5.2. Product Strategy

                17.1.2.5.3. Channel Strategy

        17.1.3. Chicago Vegan Foods

            17.1.3.1. Overview

            17.1.3.2. Product Portfolio

            17.1.3.3. Profitability by Market Segments (Product/Age /Sales Channel/Region)

            17.1.3.4. Sales Footprint

            17.1.3.5. Strategy Overview

                17.1.3.5.1. Marketing Strategy

                17.1.3.5.2. Product Strategy

                17.1.3.5.3. Channel Strategy

        17.1.4. Bute Island Foods Ltd

            17.1.4.1. Overview

            17.1.4.2. Product Portfolio

            17.1.4.3. Profitability by Market Segments (Product/Age /Sales Channel/Region)

            17.1.4.4. Sales Footprint

            17.1.4.5. Strategy Overview

                17.1.4.5.1. Marketing Strategy

                17.1.4.5.2. Product Strategy

                17.1.4.5.3. Channel Strategy

        17.1.5. Gardener Cheese Company

            17.1.5.1. Overview

            17.1.5.2. Product Portfolio

            17.1.5.3. Profitability by Market Segments (Product/Age /Sales Channel/Region)

            17.1.5.4. Sales Footprint

            17.1.5.5. Strategy Overview

                17.1.5.5.1. Marketing Strategy

                17.1.5.5.2. Product Strategy

                17.1.5.5.3. Channel Strategy

18. Assumptions & Acronyms Used

19. Research Methodology

List of Tables

Table 1: Global Market Value (US$ Million) Forecast by Region, 2018 to 2033

Table 2: Global Market Volume (MT) Forecast by Region, 2018 to 2033

Table 3: Global Market Value (US$ Million) Forecast by Source, 2018 to 2033

Table 4: Global Market Volume (MT) Forecast by Source, 2018 to 2033

Table 5: Global Market Value (US$ Million) Forecast by Sales Channel, 2018 to 2033

Table 6: Global Market Volume (MT) Forecast by Sales Channel, 2018 to 2033

Table 7: North America Market Value (US$ Million) Forecast by Country, 2018 to 2033

Table 8: North America Market Volume (MT) Forecast by Country, 2018 to 2033

Table 9: North America Market Value (US$ Million) Forecast by Source, 2018 to 2033

Table 10: North America Market Volume (MT) Forecast by Source, 2018 to 2033

Table 11: North America Market Value (US$ Million) Forecast by Sales Channel, 2018 to 2033

Table 12: North America Market Volume (MT) Forecast by Sales Channel, 2018 to 2033

Table 13: Latin America Market Value (US$ Million) Forecast by Country, 2018 to 2033

Table 14: Latin America Market Volume (MT) Forecast by Country, 2018 to 2033

Table 15: Latin America Market Value (US$ Million) Forecast by Source, 2018 to 2033

Table 16: Latin America Market Volume (MT) Forecast by Source, 2018 to 2033

Table 17: Latin America Market Value (US$ Million) Forecast by Sales Channel, 2018 to 2033

Table 18: Latin America Market Volume (MT) Forecast by Sales Channel, 2018 to 2033

Table 19: Europe Market Value (US$ Million) Forecast by Country, 2018 to 2033

Table 20: Europe Market Volume (MT) Forecast by Country, 2018 to 2033

Table 21: Europe Market Value (US$ Million) Forecast by Source, 2018 to 2033

Table 22: Europe Market Volume (MT) Forecast by Source, 2018 to 2033

Table 23: Europe Market Value (US$ Million) Forecast by Sales Channel, 2018 to 2033

Table 24: Europe Market Volume (MT) Forecast by Sales Channel, 2018 to 2033

Table 25: East Asia Market Value (US$ Million) Forecast by Country, 2018 to 2033

Table 26: East Asia Market Volume (MT) Forecast by Country, 2018 to 2033

Table 27: East Asia Market Value (US$ Million) Forecast by Source, 2018 to 2033

Table 28: East Asia Market Volume (MT) Forecast by Source, 2018 to 2033

Table 29: East Asia Market Value (US$ Million) Forecast by Sales Channel, 2018 to 2033

Table 30: East Asia Market Volume (MT) Forecast by Sales Channel, 2018 to 2033

Table 31: South Asia Market Value (US$ Million) Forecast by Country, 2018 to 2033

Table 32: South Asia Market Volume (MT) Forecast by Country, 2018 to 2033

Table 33: South Asia Market Value (US$ Million) Forecast by Source, 2018 to 2033

Table 34: South Asia Market Volume (MT) Forecast by Source, 2018 to 2033

Table 35: South Asia Market Value (US$ Million) Forecast by Sales Channel, 2018 to 2033

Table 36: South Asia Market Volume (MT) Forecast by Sales Channel, 2018 to 2033

Table 37: Oceania Market Value (US$ Million) Forecast by Country, 2018 to 2033

Table 38: Oceania Market Volume (MT) Forecast by Country, 2018 to 2033

Table 39: Oceania Market Value (US$ Million) Forecast by Source, 2018 to 2033

Table 40: Oceania Market Volume (MT) Forecast by Source, 2018 to 2033

Table 41: Oceania Market Value (US$ Million) Forecast by Sales Channel, 2018 to 2033

Table 42: Oceania Market Volume (MT) Forecast by Sales Channel, 2018 to 2033

Table 43: MEA Market Value (US$ Million) Forecast by Country, 2018 to 2033

Table 44: MEA Market Volume (MT) Forecast by Country, 2018 to 2033

Table 45: MEA Market Value (US$ Million) Forecast by Source, 2018 to 2033

Table 46: MEA Market Volume (MT) Forecast by Source, 2018 to 2033

Table 47: MEA Market Value (US$ Million) Forecast by Sales Channel, 2018 to 2033

Table 48: MEA Market Volume (MT) Forecast by Sales Channel, 2018 to 2033

List of Charts

Figure 1: Global Market Value (US$ Million) by Source, 2023 to 2033

Figure 2: Global Market Value (US$ Million) by Sales Channel, 2023 to 2033

Figure 3: Global Market Value (US$ Million) by Region, 2023 to 2033

Figure 4: Global Market Value (US$ Million) Analysis by Region, 2018 to 2033

Figure 5: Global Market Volume (MT) Analysis by Region, 2018 to 2033

Figure 6: Global Market Value Share (%) and BPS Analysis by Region, 2023 to 2033

Figure 7: Global Market Y-o-Y Growth (%) Projections by Region, 2023 to 2033

Figure 8: Global Market Value (US$ Million) Analysis by Source, 2018 to 2033

Figure 9: Global Market Volume (MT) Analysis by Source, 2018 to 2033

Figure 10: Global Market Value Share (%) and BPS Analysis by Source, 2023 to 2033

Figure 11: Global Market Y-o-Y Growth (%) Projections by Source, 2023 to 2033

Figure 12: Global Market Value (US$ Million) Analysis by Sales Channel, 2018 to 2033

Figure 13: Global Market Volume (MT) Analysis by Sales Channel, 2018 to 2033

Figure 14: Global Market Value Share (%) and BPS Analysis by Sales Channel, 2023 to 2033

Figure 15: Global Market Y-o-Y Growth (%) Projections by Sales Channel, 2023 to 2033

Figure 16: Global Market Attractiveness by Source, 2023 to 2033

Figure 17: Global Market Attractiveness by Sales Channel, 2023 to 2033

Figure 18: Global Market Attractiveness by Region, 2023 to 2033

Figure 19: North America Market Value (US$ Million) by Source, 2023 to 2033

Figure 20: North America Market Value (US$ Million) by Sales Channel, 2023 to 2033

Figure 21: North America Market Value (US$ Million) by Country, 2023 to 2033

Figure 22: North America Market Value (US$ Million) Analysis by Country, 2018 to 2033

Figure 23: North America Market Volume (MT) Analysis by Country, 2018 to 2033

Figure 24: North America Market Value Share (%) and BPS Analysis by Country, 2023 to 2033

Figure 25: North America Market Y-o-Y Growth (%) Projections by Country, 2023 to 2033

Figure 26: North America Market Value (US$ Million) Analysis by Source, 2018 to 2033

Figure 27: North America Market Volume (MT) Analysis by Source, 2018 to 2033

Figure 28: North America Market Value Share (%) and BPS Analysis by Source, 2023 to 2033

Figure 29: North America Market Y-o-Y Growth (%) Projections by Source, 2023 to 2033

Figure 30: North America Market Value (US$ Million) Analysis by Sales Channel, 2018 to 2033

Figure 31: North America Market Volume (MT) Analysis by Sales Channel, 2018 to 2033

Figure 32: North America Market Value Share (%) and BPS Analysis by Sales Channel, 2023 to 2033

Figure 33: North America Market Y-o-Y Growth (%) Projections by Sales Channel, 2023 to 2033

Figure 34: North America Market Attractiveness by Source, 2023 to 2033

Figure 35: North America Market Attractiveness by Sales Channel, 2023 to 2033

Figure 36: North America Market Attractiveness by Country, 2023 to 2033

Figure 37: Latin America Market Value (US$ Million) by Source, 2023 to 2033

Figure 38: Latin America Market Value (US$ Million) by Sales Channel, 2023 to 2033

Figure 39: Latin America Market Value (US$ Million) by Country, 2023 to 2033

Figure 40: Latin America Market Value (US$ Million) Analysis by Country, 2018 to 2033

Figure 41: Latin America Market Volume (MT) Analysis by Country, 2018 to 2033

Figure 42: Latin America Market Value Share (%) and BPS Analysis by Country, 2023 to 2033

Figure 43: Latin America Market Y-o-Y Growth (%) Projections by Country, 2023 to 2033

Figure 44: Latin America Market Value (US$ Million) Analysis by Source, 2018 to 2033

Figure 45: Latin America Market Volume (MT) Analysis by Source, 2018 to 2033

Figure 46: Latin America Market Value Share (%) and BPS Analysis by Source, 2023 to 2033

Figure 47: Latin America Market Y-o-Y Growth (%) Projections by Source, 2023 to 2033

Figure 48: Latin America Market Value (US$ Million) Analysis by Sales Channel, 2018 to 2033

Figure 49: Latin America Market Volume (MT) Analysis by Sales Channel, 2018 to 2033

Figure 50: Latin America Market Value Share (%) and BPS Analysis by Sales Channel, 2023 to 2033

Figure 51: Latin America Market Y-o-Y Growth (%) Projections by Sales Channel, 2023 to 2033

Figure 52: Latin America Market Attractiveness by Source, 2023 to 2033

Figure 53: Latin America Market Attractiveness by Sales Channel, 2023 to 2033

Figure 54: Latin America Market Attractiveness by Country, 2023 to 2033

Figure 55: Europe Market Value (US$ Million) by Source, 2023 to 2033

Figure 56: Europe Market Value (US$ Million) by Sales Channel, 2023 to 2033

Figure 57: Europe Market Value (US$ Million) by Country, 2023 to 2033

Figure 58: Europe Market Value (US$ Million) Analysis by Country, 2018 to 2033

Figure 59: Europe Market Volume (MT) Analysis by Country, 2018 to 2033

Figure 60: Europe Market Value Share (%) and BPS Analysis by Country, 2023 to 2033

Figure 61: Europe Market Y-o-Y Growth (%) Projections by Country, 2023 to 2033

Figure 62: Europe Market Value (US$ Million) Analysis by Source, 2018 to 2033

Figure 63: Europe Market Volume (MT) Analysis by Source, 2018 to 2033

Figure 64: Europe Market Value Share (%) and BPS Analysis by Source, 2023 to 2033

Figure 65: Europe Market Y-o-Y Growth (%) Projections by Source, 2023 to 2033

Figure 66: Europe Market Value (US$ Million) Analysis by Sales Channel, 2018 to 2033

Figure 67: Europe Market Volume (MT) Analysis by Sales Channel, 2018 to 2033

Figure 68: Europe Market Value Share (%) and BPS Analysis by Sales Channel, 2023 to 2033

Figure 69: Europe Market Y-o-Y Growth (%) Projections by Sales Channel, 2023 to 2033

Figure 70: Europe Market Attractiveness by Source, 2023 to 2033

Figure 71: Europe Market Attractiveness by Sales Channel, 2023 to 2033

Figure 72: Europe Market Attractiveness by Country, 2023 to 2033

Figure 73: East Asia Market Value (US$ Million) by Source, 2023 to 2033

Figure 74: East Asia Market Value (US$ Million) by Sales Channel, 2023 to 2033

Figure 75: East Asia Market Value (US$ Million) by Country, 2023 to 2033

Figure 76: East Asia Market Value (US$ Million) Analysis by Country, 2018 to 2033

Figure 77: East Asia Market Volume (MT) Analysis by Country, 2018 to 2033

Figure 78: East Asia Market Value Share (%) and BPS Analysis by Country, 2023 to 2033

Figure 79: East Asia Market Y-o-Y Growth (%) Projections by Country, 2023 to 2033

Figure 80: East Asia Market Value (US$ Million) Analysis by Source, 2018 to 2033

Figure 81: East Asia Market Volume (MT) Analysis by Source, 2018 to 2033

Figure 82: East Asia Market Value Share (%) and BPS Analysis by Source, 2023 to 2033

Figure 83: East Asia Market Y-o-Y Growth (%) Projections by Source, 2023 to 2033

Figure 84: East Asia Market Value (US$ Million) Analysis by Sales Channel, 2018 to 2033

Figure 85: East Asia Market Volume (MT) Analysis by Sales Channel, 2018 to 2033

Figure 86: East Asia Market Value Share (%) and BPS Analysis by Sales Channel, 2023 to 2033

Figure 87: East Asia Market Y-o-Y Growth (%) Projections by Sales Channel, 2023 to 2033

Figure 88: East Asia Market Attractiveness by Source, 2023 to 2033

Figure 89: East Asia Market Attractiveness by Sales Channel, 2023 to 2033

Figure 90: East Asia Market Attractiveness by Country, 2023 to 2033

Figure 91: South Asia Market Value (US$ Million) by Source, 2023 to 2033

Figure 92: South Asia Market Value (US$ Million) by Sales Channel, 2023 to 2033

Figure 93: South Asia Market Value (US$ Million) by Country, 2023 to 2033

Figure 94: South Asia Market Value (US$ Million) Analysis by Country, 2018 to 2033

Figure 95: South Asia Market Volume (MT) Analysis by Country, 2018 to 2033

Figure 96: South Asia Market Value Share (%) and BPS Analysis by Country, 2023 to 2033

Figure 97: South Asia Market Y-o-Y Growth (%) Projections by Country, 2023 to 2033

Figure 98: South Asia Market Value (US$ Million) Analysis by Source, 2018 to 2033

Figure 99: South Asia Market Volume (MT) Analysis by Source, 2018 to 2033

Figure 100: South Asia Market Value Share (%) and BPS Analysis by Source, 2023 to 2033

Figure 101: South Asia Market Y-o-Y Growth (%) Projections by Source, 2023 to 2033

Figure 102: South Asia Market Value (US$ Million) Analysis by Sales Channel, 2018 to 2033

Figure 103: South Asia Market Volume (MT) Analysis by Sales Channel, 2018 to 2033

Figure 104: South Asia Market Value Share (%) and BPS Analysis by Sales Channel, 2023 to 2033

Figure 105: South Asia Market Y-o-Y Growth (%) Projections by Sales Channel, 2023 to 2033

Figure 106: South Asia Market Attractiveness by Source, 2023 to 2033

Figure 107: South Asia Market Attractiveness by Sales Channel, 2023 to 2033

Figure 108: South Asia Market Attractiveness by Country, 2023 to 2033

Figure 109: Oceania Market Value (US$ Million) by Source, 2023 to 2033

Figure 110: Oceania Market Value (US$ Million) by Sales Channel, 2023 to 2033

Figure 111: Oceania Market Value (US$ Million) by Country, 2023 to 2033

Figure 112: Oceania Market Value (US$ Million) Analysis by Country, 2018 to 2033

Figure 113: Oceania Market Volume (MT) Analysis by Country, 2018 to 2033

Figure 114: Oceania Market Value Share (%) and BPS Analysis by Country, 2023 to 2033

Figure 115: Oceania Market Y-o-Y Growth (%) Projections by Country, 2023 to 2033

Figure 116: Oceania Market Value (US$ Million) Analysis by Source, 2018 to 2033

Figure 117: Oceania Market Volume (MT) Analysis by Source, 2018 to 2033

Figure 118: Oceania Market Value Share (%) and BPS Analysis by Source, 2023 to 2033

Figure 119: Oceania Market Y-o-Y Growth (%) Projections by Source, 2023 to 2033

Figure 120: Oceania Market Value (US$ Million) Analysis by Sales Channel, 2018 to 2033

Figure 121: Oceania Market Volume (MT) Analysis by Sales Channel, 2018 to 2033

Figure 122: Oceania Market Value Share (%) and BPS Analysis by Sales Channel, 2023 to 2033

Figure 123: Oceania Market Y-o-Y Growth (%) Projections by Sales Channel, 2023 to 2033

Figure 124: Oceania Market Attractiveness by Source, 2023 to 2033

Figure 125: Oceania Market Attractiveness by Sales Channel, 2023 to 2033

Figure 126: Oceania Market Attractiveness by Country, 2023 to 2033

Figure 127: MEA Market Value (US$ Million) by Source, 2023 to 2033

Figure 128: MEA Market Value (US$ Million) by Sales Channel, 2023 to 2033

Figure 129: MEA Market Value (US$ Million) by Country, 2023 to 2033

Figure 130: MEA Market Value (US$ Million) Analysis by Country, 2018 to 2033

Figure 131: MEA Market Volume (MT) Analysis by Country, 2018 to 2033

Figure 132: MEA Market Value Share (%) and BPS Analysis by Country, 2023 to 2033

Figure 133: MEA Market Y-o-Y Growth (%) Projections by Country, 2023 to 2033

Figure 134: MEA Market Value (US$ Million) Analysis by Source, 2018 to 2033

Figure 135: MEA Market Volume (MT) Analysis by Source, 2018 to 2033

Figure 136: MEA Market Value Share (%) and BPS Analysis by Source, 2023 to 2033

Figure 137: MEA Market Y-o-Y Growth (%) Projections by Source, 2023 to 2033

Figure 138: MEA Market Value (US$ Million) Analysis by Sales Channel, 2018 to 2033

Figure 139: MEA Market Volume (MT) Analysis by Sales Channel, 2018 to 2033

Figure 140: MEA Market Value Share (%) and BPS Analysis by Sales Channel, 2023 to 2033

Figure 141: MEA Market Y-o-Y Growth (%) Projections by Sales Channel, 2023 to 2033

Figure 142: MEA Market Attractiveness by Source, 2023 to 2033

Figure 143: MEA Market Attractiveness by Sales Channel, 2023 to 2033

Figure 144: MEA Market Attractiveness by Country, 2023 to 2033

Recommendations

Food and Beverage

Vegan Pasta Market

Published : August 2023

Food and Beverage

Vegan Yogurt Market

Published : February 2023

Explore Food and Beverage Insights

View Reports

Vegan Cheese Sauce Market