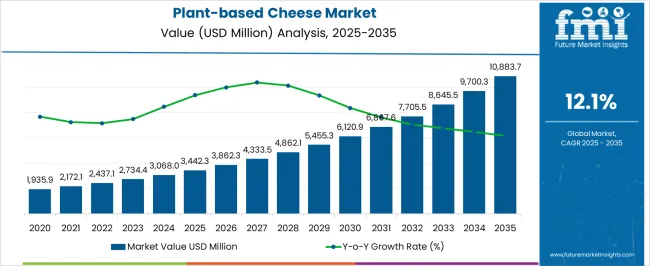
The Plant-based Cheese Market is estimated to be valued at USD 3442.3 million in 2025 and is projected to reach USD 10883.7 million by 2035, registering a compound annual growth rate (CAGR) of 12.1% over the forecast period.
| Metric | Value |
|---|---|
| Plant-based Cheese Market Estimated Value in (2025 E) | USD 3442.3 million |
| Plant-based Cheese Market Forecast Value in (2035 F) | USD 10883.7 million |
| Forecast CAGR (2025 to 2035) | 12.1% |
The plant-based cheese market is expanding quickly, supported by rising consumer preference for dairy alternatives and growing awareness of lactose intolerance and vegan lifestyles. The market benefits from innovation in taste, texture, and nutritional composition, which has improved acceptance among mainstream consumers.
Increasing investments from established dairy companies and specialized plant-based brands are further accelerating growth. Distribution is expanding through both retail and business-to-business channels, driven by strong demand from foodservice outlets and processed food manufacturers.
Clean-label trends and sustainability concerns are reinforcing consumer interest, as plant-based cheese offers lower environmental impact compared to dairy-based products. Looking ahead, technological improvements in fermentation and ingredient sourcing are expected to enhance product quality and cost competitiveness, ensuring a strong growth outlook for the sector.
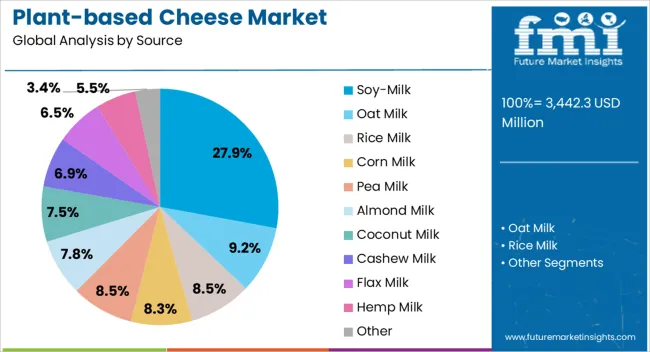
The soy-milk segment accounts for approximately 27.90% share of the source category in the plant-based cheese market. This leadership is supported by soy’s high protein content, wide availability, and functional properties that enhance cheese texture and melting characteristics.
Soy-based formulations have been well established in dairy alternatives, making them a familiar choice for both producers and consumers. The segment benefits from cost advantages and scalability in production, ensuring consistent supply across global markets.
Demand is reinforced by increasing consumer trust in soy as a reliable plant protein source. With ongoing innovation in flavor enhancement and allergen-free variants, the soy-milk segment is positioned to maintain its strong share, particularly in regions with high demand for affordable and protein-rich dairy alternatives.
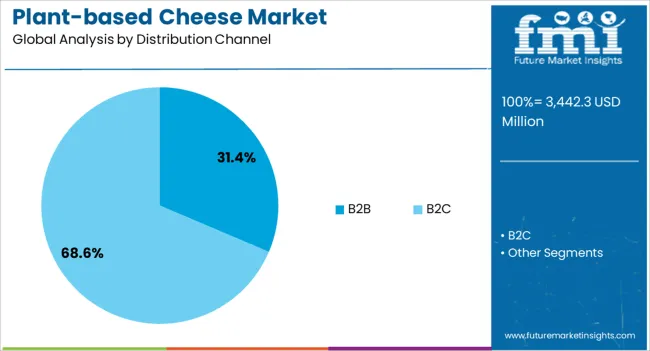
The B2B segment leads the distribution channel category, holding approximately 31.40% share of the plant-based cheese market. This segment’s growth is fueled by strong demand from foodservice operators, restaurants, and food manufacturers integrating plant-based cheese into menus and processed products.
Rising adoption in quick-service restaurants, pizzerias, and ready-to-eat packaged foods has reinforced its share. The B2B model ensures higher volume sales and consistent demand compared to retail channels, making it a strategic focus for producers.
As consumer preference for plant-based dining options grows, foodservice providers are increasingly relying on plant-based cheese to expand menu offerings. With the ongoing mainstreaming of plant-based diets, the B2B segment is expected to sustain its leadership position in the distribution category.
This section provides extensive assessments of certain segments of the plant-based cheese business. The current study focuses on two primary features: the Soy milk-based cheese segment and the B2C distribution channel.
| Attributes | Details |
|---|---|
| Top Source | Soy Milk |
| Market Share in 2025 | 38.2% |
In 2025, the soy milk-based cheese category is estimated to rule the plant-based cheese market, with a whopping 38.2% share. There are several reasons for this inclination for soy milk source:
| Attributes | Details |
|---|---|
| Top Distribution Channel | B2C |
| Market Share in 2025 | 83.8% |
The distribution channel that gained significant traction was business-to-consumer, with an expected 83.8% market share in 2025. The following is a description of this supremacy:
highlighting the predicted growth patterns for the plant-based cheese market. An impressive historical compound annual growth rate of 11.6% indicates the market is steadily expanding. Moreover, the industry is anticipated to grow at an astounding 12.2% through 2035.
| Historical CAGR | 11.6% |
|---|---|
| Forecast CAGR | 12.2% |
Product innovation and growing consumer acceptance of veganism are just a few of the positive factors driving the industry's expansion. Many clients have been drawn to these nutritional substances because of their versatility, simplicity, and flexibility for customization.
Crucial factors that are anticipated to influence the demand for vegan cheese through 2035.
Due to these proactive features, which position the industry for long-term success, market participants must continue to be strategic and adaptive during the estimated period.
Popularity of Veganism in the Mainstream Media
Given the substantial nutritional content and numerous health advantages, plant-based diets are growing popular among individuals concerned about their health. These meals are rich in fiber, which helps reduce cholesterol and blood glucose levels, promoting overall well-being.
As the trend toward vegetarianism continues to gain momentum, more and more people are turning to plant-based cheese products, such as plant-based parmesan, which has led to exponential growth in the non-dairy cheese market. This rise in consumer inclination toward plant-based cheese is expected to drive sales in the coming years.
Adaption of Vegan Culinary Innovations in the HoReCa Sector
The millennial generation's growing interest in veganism and vegetarianism enhances the hotel, restaurant, and café industries. This change has also influenced the worldwide market for plant-based cheese, encouraging the food industry to innovate and create new goods and raising spending on research and development.
Vegan cheese is becoming increasingly popular because of its great taste and practicality. It has a longer shelf life, better flavor, and a better texture. The food sector is undergoing considerable transformation because of the rising trend of veganism and vegetarianism, driving innovation and growth in plant-based diets.
Health and Safety Code Shifts the Plant-based Cheese Market
Growing consumer knowledge of the health dangers connected with dairy products, including lactose intolerance, allergies, and cholesterol problems, has led many to choose vegan cheese as a superior alternative suitable for dietary restrictions or health goals.
As per the World Health Organization, diabetes is a primary cause of blindness, heart disease, renal issues, lower limb amputation, and several other health complications. Many consumers have switched to plant-based meals because of this. There are several health advantages to plant-based cheese, including decreased blood sugar, enhanced insulin sensitivity, and a reduced risk of type 2 diabetes.
The industry is growing because vegan cheese is recommended for lactose intolerant people and has a higher medical impact than typical dairy cheese.
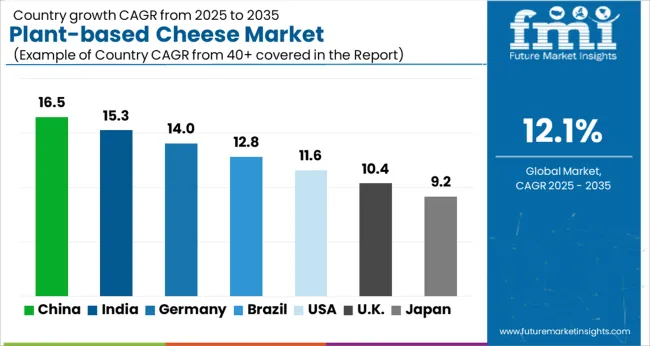
This section examines the markets for plant-based cheese in several countries, such as the United States, China, India, Germany, and the United Kingdom. The section explores the aspects influencing the demand, acceptance, and sales of plant-based cheese in particular countries.
| Country | CAGR |
|---|---|
| United States | 8.2% |
| Germany | 10.2% |
| United Kingdom | 8.7% |
| India | 8.4% |
| China | 3.3% |
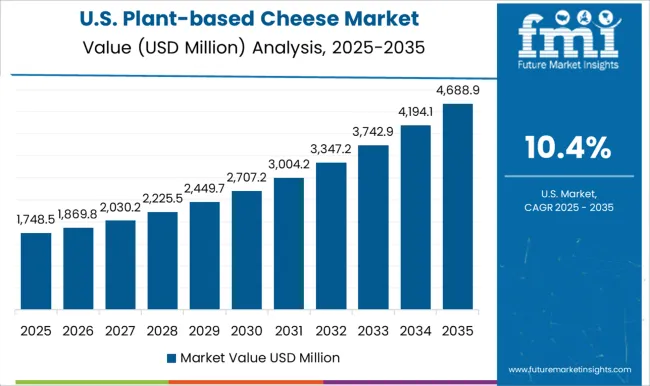
In the United States, the demand for plant-based cheese is anticipated to expand at a compound annual growth rate of 8.2% through 2035. This quick growth is fueled by the following factors:
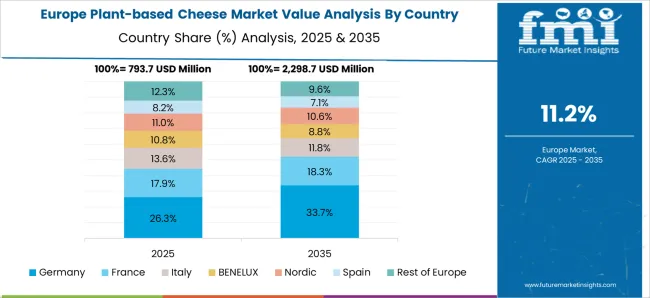
Germany is experiencing a surge in plant-based cheese demand, with a predicted CAGR of 10.2% through 2035. Some of the primary drivers include:
China is seeing an increase in demand for plant-based cheese, with a predicted CAGR of 3.3% through 2035. Among the main trends are:
The market for plant-based cheese is expanding in the United Kingdom with an estimated CAGR of 8.7% through 2035. Here are a few of the key trends:
Through 2035, the market for plant-based cheese in India is anticipated to increase at a CAGR of 8.4%. Several of the key trends are as follows:
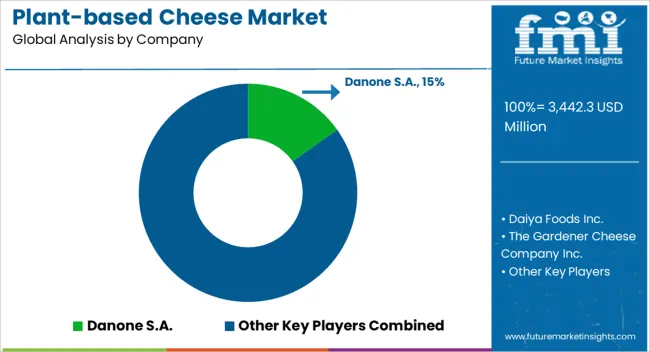
The highly competitive and rapidly expanding plant-based cheese business is crowded with companies striving for market domination and a solid basis. Several factors, including price strategies, marketing campaigns, research and development, and the development of new products, largely drive the rivalry. The vegan cheese sector is notably fragmented, with competitors vying for market dominance. Therefore, strategic decision-making and competitive pressures are given greater weight. To keep ahead of the competition, players in the industry invest a lot of money in research and development to create innovative, highly effective, cruelty-free dairy products.
In today's intensely competitive environment, businesses always seek ways to increase their market share and operational effectiveness. Market players actively look for strategic alliances, collaborations, and partnerships to do this. Companies collaborating to achieve common goals can benefit from each other's resources and expertise.
Plant-based dairy product manufacturers employ many marketing tactics, including partnerships and new product launches, to expand their presence. Thanks to these measures, they can get a competitive edge in the market and raise product awareness. Through constant innovation and the development of fresh approaches to engage their target market, companies may remain ahead of the curve and retain their leading positions in the sector.
Recent Developments in the Plant-based Cheese Industry:
| Report Attributes | Details |
|---|---|
| Current Total Market Size (2025) | USD 3,068 million |
| Projected Market Size (2035) | USD 9,658 million |
| CAGR (2025 to 2035) | 12.2% |
| Base Year for Estimation | 2025 |
| Historical Period | 2020 to 2025 |
| Projections Period | 2025 to 2035 |
| Quantitative Units | USD million for value and thousand tons for volume |
| Sources Analyzed (Segment 1) | Oat Milk, Rice Milk, Corn Milk, Soy Milk, Pea Milk, Almond Milk, Coconut Milk, Cashew Milk, Flax Milk, Hemp Milk, Other |
| Distribution Channels Analyzed (Segment 2) | B2B (Hotels, Restaurants, Cafes), B2C (Hypermarkets/Supermarkets, Convenience Stores, Specialty Stores, Mom and Pop Stores, Discount Stores, Food & Drink Specialty Stores, Independent Small Groceries, Online Retail, Others) |
| Regions Covered | North America; Latin America; Western Europe; Eastern Europe; South Asia and Pacific; East Asia; Middle East & Africa |
| Countries Covered | United States, Canada, Mexico, Brazil, Argentina, Germany, France, United Kingdom, Italy, Spain, Netherlands, China, India, Japan, South Korea, ANZ, GCC Countries, South Africa |
| Key Players influencing the Plant-based Cheese Market | Daiya Foods Inc., The Gardener Cheese Company Inc., Kite Hill, Miyoko’s Creamery, Field Roast, Puris Foods, Bute Island Foods Ltd., Follow Your Heart, WayFare Foods, GreenSpace Brands, Danone S.A. |
| Additional Attributes | Consumer shift toward clean-label, vegan dairy alternatives, E-commerce expansion in dairy-free segments, Regional growth in soy and almond-based cheese products, Innovation in meltability, flavor, and nutrition of plant-based cheese formulations |
| Customization and Pricing | Customization and Pricing Available on Request |
The global plant-based cheese market is estimated to be valued at USD 3,442.3 million in 2025.
The market size for the plant-based cheese market is projected to reach USD 10,883.7 million by 2035.
The plant-based cheese market is expected to grow at a 12.1% CAGR between 2025 and 2035.
The key product types in plant-based cheese market are soy-milk, oat milk, rice milk, corn milk, pea milk, almond milk, coconut milk, cashew milk, flax milk, hemp milk and other.
In terms of distribution channel, b2b segment to command 31.4% share in the plant-based cheese market in 2025.


Full Research Suite comprises of:
Market outlook & trends analysis
Interviews & case studies
Strategic recommendations
Vendor profiles & capabilities analysis
5-year forecasts
8 regions and 60+ country-level data splits
Market segment data splits
12 months of continuous data updates
DELIVERED AS:
PDF EXCEL ONLINE
Demand for Plant-Based Cheese in EU Size and Share Forecast Outlook 2025 to 2035
Demand for Plant-based Cheese & Spreads in CIS Size and Share Forecast Outlook 2025 to 2035
High-Protein Plant-Based Cheese Alternatives in the EU Analysis Size and Share Forecast Outlook 2025 to 2035
Cheese Packaging Market Forecast and Outlook 2025 to 2035
Cheese Concentrates Market Size and Share Forecast Outlook 2025 to 2035
Cheese Ingredient Market Size and Share Forecast Outlook 2025 to 2035
Cheese Color Market Size and Share Forecast Outlook 2025 to 2035
Cheese Market Size and Share Forecast Outlook 2025 to 2035
Cheese Cutting Machine Market Size and Share Forecast Outlook 2025 to 2035
Cheese Flavor Market Size, Growth, and Forecast for 2025 to 2035
Cheese Market Analysis - Size, Share, and Forecast Outlook 2025 to 2035
Cheese Powder Market Size, Growth, and Forecast for 2025 to 2035
Cheese Alternatives Market Analysis - Size, Share, and Forecast 2025 to 2035
Cheese Analogue Market Insights - Growth & Demand Analysis 2025 to 2035
Cheese Liners Market
Vegan Cheese Market Size and Share Forecast Outlook 2025 to 2035
Cream Cheese Market Analysis – Size, Share, and Forecast 2025 to 2035
Vegan Cheese Sauce Market Size and Share Forecast Outlook 2025 to 2035
Nacho Cheese Warmers Market – Hot & Fresh Cheese Dispensing 2025 to 2035
Spray Cheese Market Analysis by Flavours, Distribution Channel and Region through 2035

Thank you!
You will receive an email from our Business Development Manager. Please be sure to check your SPAM/JUNK folder too.
Chat With
MaRIA