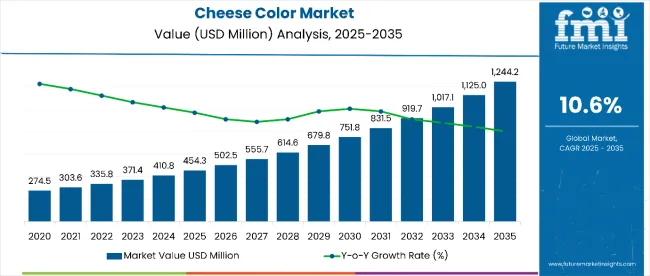
The cheese color market is valued at USD 454.3 million in 2025 and is slated to reach USD 1244.2 million by 2035, at a CAGR of 10.6%. The market is expected to add an absolute dollar opportunity of USD 789.9 million during this period, reflecting a 2.74 times growth.
| Metric | Value |
|---|---|
| Market Estimated Value in (2025E) | USD 454.3 million |
| Market Forecast Value in (2035F) | USD 1244.2 million |
| Forecast CAGR (2025 to 2035) | 10.6% |
This expansion will be driven by rising demand for cheese colorants in both processed and specialty cheese segments to enhance visual appeal, cater to natural color preferences, and support growing cheese consumption worldwide.
By 2030, the market is projected to reach approximately USD 751.8 million, generating an incremental value of USD 297.5 million in the first half of the period. Clean-label trends are encouraging the shift toward natural over synthetic colorants, especially in premium cheese categories. Manufacturers are responding with plant-based pigment solutions that maintain stability during cheese processing. Expanding demand from specialty cheese manufacturers and increasing retail shelf competition will sustain market growth across both developed and emerging regions.
Key companies operating in the market include Chr. Hansen Holding A/S with a 16% market share, DDW (a Kerry Group company), Sensient Technologies Corporation, BASF SE, and Arla Foods. These players are focusing on responsible sourcing of raw materials, advanced dairy processing technologies, and R&D to enhance color intensity and stability. Strategic partnerships with dairy producers and innovation in natural color formulations are central to gaining a competitive edge. Regulatory compliance, food safety standards, and increasing consumer awareness about natural ingredients will shape market competition and product development strategies over the forecast period.
The market accounts for a significant share of the global dairy colorant industry, supported by its dominant role in enhancing the visual appeal of cheese products across both natural and processed varieties. In the cheese ingredients segment, it is led by cow milk-derived products, which command 80% of the source share. Natural cheese colors hold a 50% share of the type segment, reflecting growing consumer preference for clean-label and plant-based coloring solutions. The USA, China, Germany, India, and the UK collectively represent key growth markets, driven by rising cheese consumption and demand for premium, visually appealing dairy products.
The market is undergoing structural transformation due to increasing adoption of natural coloring agents over synthetic alternatives in cheese production. Innovations in extraction processes and formulation stability are enabling consistent color retention during production and storage. Manufacturers are focusing on sustainable sourcing, dairy-friendly pigments, and compliance with stringent food safety regulations. Product diversification, including both water- and oil-soluble formats, is expanding application potential in retail cheese, foodservice, and industrial dairy processing segments worldwide.
Cheese color’s ability to enhance visual appeal, maintain stability during processing, and align with clean-label demands makes it a preferred choice for both natural and processed cheese applications. With cow milk accounting for 80% of the source segment and natural cheese colors holding a 50% share, the market is benefiting from a strong shift toward plant-based and naturally derived coloring agents.
Rising consumer awareness of natural ingredients, coupled with the premiumization of cheese products, is accelerating adoption in retail, foodservice, and industrial dairy production. Innovations in extraction techniques and formulation stability are improving product consistency, shelf life, and compatibility with diverse cheese varieties.
As global dairy consumption expands and consumers prioritize authenticity, quality, and sustainability, cheese colors are becoming integral to brand differentiation and product innovation. With key markets in the USA, China, Germany, India, and the UK, the industry is well-positioned for growth driven by clean-label trends, sustainable sourcing practices, and the growing popularity of premium cheese products worldwide.
The market is segmented by source, type, end use, and region. By source, the market is divided into cow milk, sheep milk, goat milk, buffalo milk, whole milk, and skimmed milk. Based on type, the market is bifurcated into natural cheese color and processed cheese color. In terms of end use, the market is classified into mozzarella cheese, cheddar cheese, feta cheese, parmesan cheese, roque fort cheese, and others (blue cheese, gouda, brie, camembert, and specialty artisanal cheeses). Regionally, the market is divided into North America, Latin America, Western Europe, Eastern Europe, South Asia and Pacific, East Asia, and the Middle East & Africa.
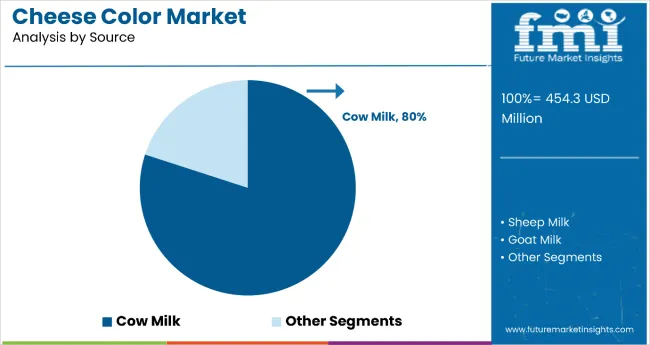
Cheese color derived from cow’s milk is the most lucrative source segment, commanding 80% share of the market in 2025 and capturing the bulk of industrial demand. This dominance is rooted in scaled cow’s milk supplies, making it the primary feed stock for high-volume cheeses such as mozzarella and cheddar, which together drive large, stable colorant purchases. Natural colorants (notably annatto and β-carotene) are widely used to standardize cow-milk cheese hues and remain technically well-matched to the fat matrix of cow cheeses, giving suppliers reliable performance and cost efficiency versus niche milk types.
Market momentum toward clean-label, year-round color consistency, and processed/foodservice cheese growth further tightens margins and volume opportunities for cow-milk colorants; manufacturers benefit from long contracts with large dairy processors and lower per-unit application R&D compared with small-batch sheep or goat cheeses. In short, cow-milk colorants combine scale, technical fit (fat-soluble natural pigments), established supply chains, and strong end-market demand, all of which contribute to this dominance.
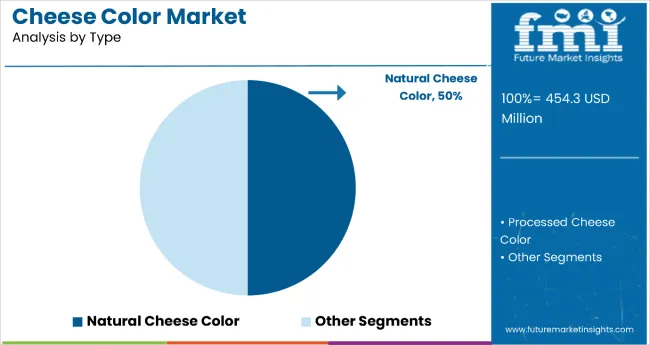
Natural cheese color is the most lucrative type segment in the market, holding a 50% share in 2025 and experiencing rapid adoption driven by clean-label and natural ingredient trends. This segment primarily uses plant-derived pigments such as annatto, β-carotene, paprika, and turmeric, which provide stable, vibrant coloring while meeting consumer demand for chemical-free dairy products. Natural colorants are particularly favored in premium and specialty cheeses, where product authenticity and minimal processing are key selling points.
Regulatory pressure in North America and Europe to reduce or eliminate synthetic dyes from food products is accelerating the shift toward natural formulations, creating strong tailwinds for this segment. Advancements in pigment extraction and microencapsulation technology have improved color stability during cheese maturation and storage, further enhancing product appeal. With expanding retail, foodservice, and export opportunities, natural cheese color is positioned as a high-margin, high-growth category within the market.
From 2025 to 2035, global dairy producers increasingly adopted advanced cheese coloring technologies to ensure consistent visual appeal, improve shelf presentation, and enhance brand differentiation. This shift positions cheese color suppliers offering high-quality, natural, and stable pigments as key partners in supporting next-generation cheese production and premium product positioning.
Rising Dairy Industry Innovation Drives Cheese Color Market Growth
The steady rise in dairy R&D investment and focus on clean-label, naturally colored cheeses has been identified as the primary catalyst for growth in the cheese color market. In 2024, breakthrough developments in pigment stabilization and microencapsulation prompted cheese manufacturers worldwide to incorporate plant-based colorants such as annatto, β-carotene, and paprika into their formulations. By 2025, producers were upgrading coloring systems to ensure uniformity across seasonal milk variations and meet stricter regulatory requirements in key markets.
Advanced Pigment Technology Integration Creates Market Expansion Opportunity
In 2024, leading cheese brands began integrating advanced extraction and encapsulation technologies with natural pigments to improve color stability during cheese maturation, melting, and storage, leading to more consistent product quality and visual appeal. By 2025, these enhanced coloring systems were being embedded directly into cheese-making processes, allowing real-time adjustment for desired shade, intensity, and uniformity. These implementations demonstrate that when advanced coloring technologies are combined with high-quality natural pigments, product consistency and marketability are significantly enhanced.
| Countries | CAGR |
|---|---|
| USA | 25.2% |
| China | 12.3% |
| Germany | 8.3% |
| India | 6.1% |
| UK | 6.0% |
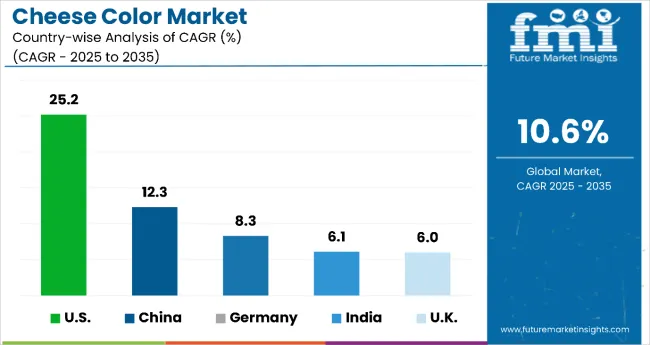
In the global cheese color market, the USA leads in growth momentum with an exceptionally high projected CAGR of 25.2%, driven by robust adoption across both natural and synthetic segments. China follows with a CAGR of 12.3%, fueled by urban dietary shifts and Western-style cheese consumption. Germany maintains a healthy growth rate of 8.3%, supported by EU-driven natural color adoption and strong export demand. India registers a steady CAGR of 6.1%, propelled by QSR demand and processed cheese expansion. The UK sees a similar CAGR of 6.0%, underpinned by artisanal cheese growth and premium product positioning.
The report covers an in-depth analysis of 40+ countries; five top-performing OECD countries are highlighted below.
The USA cheese color demand is projected to expand at a CAGR of 25.2% from 2025 to 2035, driven by strong demand for both natural and synthetic colorants across processed cheese and artisanal cheese segments. Increasing consumer preference for visually appealing dairy products, coupled with the growth of premium cheese brands, is boosting adoption. Clean-label trends are fueling the use of natural colorants like annatto, turmeric, and paprika, while the processed cheese sector continues to rely on stable synthetic options for consistency. The expanding foodservice sector, along with the rise in specialty cheese production, further supports market growth. Domestic manufacturers are focusing on advanced formulation techniques to enhance color stability, even under high-temperature processing.
Revenue from cheese color in China is expected to grow at a CAGR of 12.3% between 2025 and 2035, fueled by the rapid expansion of Western-style cheese consumption in urban areas and the growing popularity of fusion cuisines. International cheese brands entering the Chinese market are driving demand for consistent, high-quality colorants to maintain product appeal. The processed cheese segment, especially in QSRs and bakery applications, is a major consumer of synthetic colorants, while health-conscious urban buyers are creating a niche market for natural options like beta-carotene and paprika extracts. Government support for dairy sector modernization is also encouraging investment in high-performance food coloring technology. By 2035, China is expected to be one of the fastest-growing markets for cheese color in the Asia-Pacific region.
Sales of cheese color in Germany are forecast to grow at a steady CAGR of 8.3% between 2025 and 2035, supported by its strong dairy processing industry and the rising popularity of specialty cheese varieties. Natural colorants, particularly those derived from carotenoids and plant extracts, are gaining traction due to stringent EU labeling regulations and increasing consumer demand for clean-label products. The country’s cheese exports, especially to European neighbors, are fueling higher adoption of stable color solutions for long shelf-life products. Innovation in cheese aesthetics, including unique color blends for premium retail brands, is boosting the market. The growth of private-label cheese brands in Germany’s supermarket chains also plays a key role in driving demand for both natural and synthetic cheese colors.
Revenue from cheese color in India is expected to expand rapidly, registering a CAGR of 6.1% from 2025 to 2035, propelled by the growing processed cheese segment and rising urban consumption of Western-style dairy products. The demand for vibrant and uniform cheese coloring is increasing in quick-service restaurants (QSRs) and retail packaged cheese. Domestic cheese manufacturers are adopting natural colorants such as turmeric and beta-carotene to align with the country’s health-conscious consumer base, while still using synthetic options in mass-produced cheese for cost efficiency. Rapid growth in the organized retail sector and the expansion of the Indian cheese export industry are driving innovation in heat-stable and pH-resistant color formulations.
Sales of cheese color in the UK are projected to grow at a CAGR of 6.0% during 2025-2035, driven by increasing consumer interest in premium and artisanal cheeses. Natural cheese colorants are in high demand due to clean-label preferences and compliance with strict UK food safety standards. Domestic cheese brands are incorporating plant-based pigments like annatto and beetroot extracts to differentiate products in the retail space. The growing export of specialty British cheeses, such as cheddar and blue varieties, is also boosting adoption of advanced coloring solutions for consistency and shelf stability. Supermarket private labels and gourmet cheese shops are expanding their product lines, further increasing the demand for innovative cheese color formulations. By 2035, the UK is expected to be a leader in natural cheese color adoption in Europe.
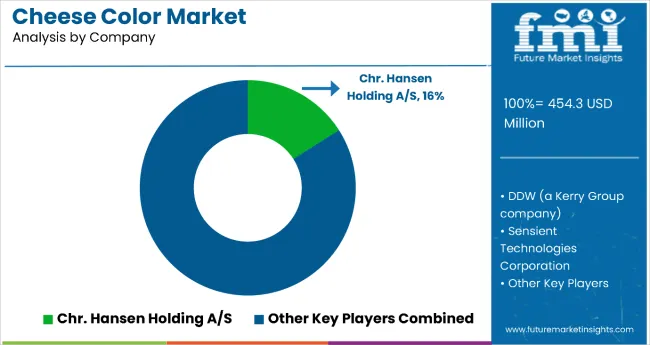
The market is moderately consolidated, with key players leveraging advanced pigment extraction, stabilization, and formulation technologies. Chr. Hansen Holding A/S and DSM-Firmenich dominate the natural cheese color segment, offering plant-based and carotenoid-derived solutions aligned with clean-label trends and stringent food safety standards.
Givaudan and Sensient Technologies specialize in customized cheese color formulations for both artisanal and industrial applications, enabling precise shade matching and long-lasting vibrancy. Kalsec Inc. focuses on spice-derived colorants such as paprika and annatto, catering to premium and specialty cheese brands seeking natural differentiation.
Regional producers like DDW The Color House and Aarkay Food Products emphasize cost-effective, region-specific solutions, ensuring supply reliability for local cheese processors. Entry barriers remain substantial due to regulatory compliance, shade consistency requirements, and stability challenges in varied cheese processing conditions.
| Item | Value |
|---|---|
| Quantitative Units | USD 454.3 million |
| Source | Cow Milk, Sheep Milk, Goat Milk, Buffalo Milk, Whole Milk, Skimmed Milk |
| Type | Natural Cheese Color and Processed Cheese Color |
| End Use | Mozzarella, Cheddar, Feta, Parmesan, Roquefort, and Others (including Gouda, Swiss, Blue, and specialty cheeses) |
| Regions Covered | North America, Europe, Asia-Pacific, Latin America, Middle East & Africa |
| Countries Covered | United States, Canada, Germany, France, United Kingdom, China, Japan, India, Brazil, South Africa, Australia and 40+ countries |
| Key Companies Profiled | Britannia Industries Limited, Almarai Co. Ltd., Vindija dd, Arla Foods, Kraft Heinz, Bletsoe Cheese Inc., FrieslandCampina, Saputo Inc., Associated Milk Producers Inc., Bel Group, Gebrüder Woerle Ges.m.b.H, Fonterra Food, Mother Dairy, Sargento Foods Incorporated, and Parag Milk Foods Old Fashioned Cheese |
| Additional Attributes | Dollar sales by product category and application, rising demand in processed cheese and artisanal cheese sectors, strong clean-label movement driving natural pigment adoption, advancements in color stability for high-temperature and long-shelf-life cheese products, growing customization for regional cheese varieties |
The global cheese color market is estimated to be valued at USD 0.5 billion in 2025.
The market size for the cheese color market is projected to reach USD 1.2 billion by 2035.
The cheese color market is expected to grow at a 10.1% CAGR between 2025 and 2035.
The key product types in cheese color market are cow milk, sheep milk, goat milk, buffalo milk, whole milk and skimmed milk.
In terms of type, natural segment to command 57.4% share in the cheese color market in 2025.


Our Research Products

The "Full Research Suite" delivers actionable market intel, deep dives on markets or technologies, so clients act faster, cut risk, and unlock growth.

The Leaderboard benchmarks and ranks top vendors, classifying them as Established Leaders, Leading Challengers, or Disruptors & Challengers.

Locates where complements amplify value and substitutes erode it, forecasting net impact by horizon

We deliver granular, decision-grade intel: market sizing, 5-year forecasts, pricing, adoption, usage, revenue, and operational KPIs—plus competitor tracking, regulation, and value chains—across 60 countries broadly.

Spot the shifts before they hit your P&L. We track inflection points, adoption curves, pricing moves, and ecosystem plays to show where demand is heading, why it is changing, and what to do next across high-growth markets and disruptive tech

Real-time reads of user behavior. We track shifting priorities, perceptions of today’s and next-gen services, and provider experience, then pace how fast tech moves from trial to adoption, blending buyer, consumer, and channel inputs with social signals (#WhySwitch, #UX).

Partner with our analyst team to build a custom report designed around your business priorities. From analysing market trends to assessing competitors or crafting bespoke datasets, we tailor insights to your needs.
Supplier Intelligence
Discovery & Profiling
Capacity & Footprint
Performance & Risk
Compliance & Governance
Commercial Readiness
Who Supplies Whom
Scorecards & Shortlists
Playbooks & Docs
Category Intelligence
Definition & Scope
Demand & Use Cases
Cost Drivers
Market Structure
Supply Chain Map
Trade & Policy
Operating Norms
Deliverables
Buyer Intelligence
Account Basics
Spend & Scope
Procurement Model
Vendor Requirements
Terms & Policies
Entry Strategy
Pain Points & Triggers
Outputs
Pricing Analysis
Benchmarks
Trends
Should-Cost
Indexation
Landed Cost
Commercial Terms
Deliverables
Brand Analysis
Positioning & Value Prop
Share & Presence
Customer Evidence
Go-to-Market
Digital & Reputation
Compliance & Trust
KPIs & Gaps
Outputs
Full Research Suite comprises of:
Market outlook & trends analysis
Interviews & case studies
Strategic recommendations
Vendor profiles & capabilities analysis
5-year forecasts
8 regions and 60+ country-level data splits
Market segment data splits
12 months of continuous data updates
DELIVERED AS:
PDF EXCEL ONLINE
Cheese Packaging Market Forecast and Outlook 2025 to 2035
Cheese Concentrates Market Size and Share Forecast Outlook 2025 to 2035
Cheese Ingredient Market Size and Share Forecast Outlook 2025 to 2035
Cheese Market Size and Share Forecast Outlook 2025 to 2035
Color Detection Sensors Market Size and Share Forecast Outlook 2025 to 2035
Cheese Cutting Machine Market Size and Share Forecast Outlook 2025 to 2035
Colorectal Cancer Molecular Diagnostics Market Size and Share Forecast Outlook 2025 to 2035
Cheese Flavor Market Size, Growth, and Forecast for 2025 to 2035
Coloring Foodstuffs Market Insights – Natural Pigments & Growth 2025 to 2035
Cheese Market Analysis - Size, Share, and Forecast Outlook 2025 to 2035
Cheese Powder Market Size, Growth, and Forecast for 2025 to 2035
Cheese Alternatives Market Analysis - Size, Share, and Forecast 2025 to 2035
Colorimeter Market Growth - Trends & Forecast 2025 to 2035
Cheese Analogue Market Insights - Growth & Demand Analysis 2025 to 2035
Examining Market Share Trends in the Colored Gemstones Industry
Colored BIPV Market Report – Trends, Demand & Growth through 2034
Colorimetric Indicator Labels Market Trends – Growth & Forecast 2024-2034
Cheese Liners Market
Color Meter Market
Color Concentrates Market

Thank you!
You will receive an email from our Business Development Manager. Please be sure to check your SPAM/JUNK folder too.
Chat With
MaRIA