Reports

- Global Locations -

Headquarters

Future Market Insights, Inc.

Christiana Corporate, 200
Continental Drive, Suite 401,
Newark, Delaware - 19713,
United States

T: +1-845-579-5705

Americas

Future Market Insights, Inc.

616 Corporate Way, Suite 2-9018,
Valley Cottage, NY 10989, United States

T: +1-347-918-3531

MEA

Future Market Insights

1602-6 Jumeirah Bay X2 Tower, Plot No: JLT-PH2-X2A,
Jumeirah Lakes Towers, Dubai,
United Arab Emirates

Europe

Future Market Insights

3rd Floor, 207 Regent Street,
W1B 3HH London
United Kingdom

T: + 44 (0) 20 8123 9659
D: +44 (0) 20 3287 4268

Asia Pacific

Future Market Insights

IndiaLand Global Tech Park, Unit UG-1, Behind Grand HighStreet, Phase 1, Hinjawadi, MH, Pune – 411057, India

Frozen Cheese Market Outlook (2022 to 2032)

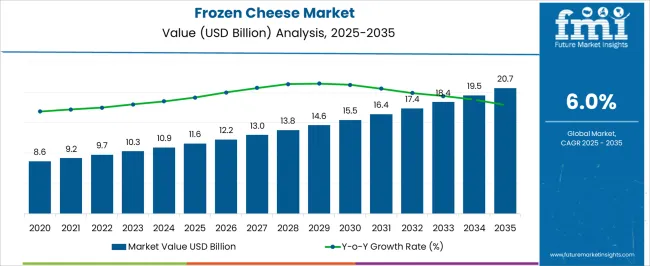
The global frozen cheese market size is expected to reach a valuation of US$ 9.7 Billion in 2022. Furthermore, with the increasing usage of frozen cheese for making a wide range of dishes, the overall demand for frozen cheese is likely to grow at a healthy CAGR of 6% between 2022 and 2032, totaling around US$ 17.4 Billion by 2032.

The total frozen cheese market accounted for 10% of the global healthy snacking market in 2022, and this number is anticipated to grow further due to customer preference for healthy foods with low fat and cholesterol levels to maintain good health.

Since its introduction, freezing has become one of the popular methods or techniques for preserving foods. It is an effective way of increasing the shelf life of foods like cheese and meat, reducing waste, and saving money.

Frozen cheese is made by freezing hard or soft varieties of cheese at lower temperatures to enhance its shelf life. It is mostly used in cooked dishes rather than eaten fresh. Increasing consumer spending and growing usage of frozen cheese within the food industry will therefore continue to drive the global frozen cheese market during the forecast period.

Attributes Details
Frozen Cheese Market Estimated Size (2022E) US$ 9.7 Billion
Projected Market Size (2032F) US$ 17.4 Billion
Value-based CAGR (2022 to 2032) 6%CAGR
Top 3 Countries' Market Share 35%

Don't pay for what you don't need

Customize your report by selecting specific countries or regions and save 30%!

2017 to 2021 Frozen Cheese Market Outlook Compared to 2022 to 2032 Forecast

Global demand for frozen Cheese grew at 5.5% CAGR during the historical period of 2017 and 2021. However, with the growing usage of frozen cheese over fresh one for making varieties of dishes within the food industry, the overall demand for frozen cheese is set to grow at a CAGR of 6% between 2022 and 2032.

Since cheese and several other food products cannot last for too long, manufacturers are employing techniques like freezing to preserve them. Cheese is generally frozen within 72 hours of manufacture by using technologies like IQF to arrest protein breakdown and flavor development. Adoption of these freezing techniques preserves the cheese quality and makes it easy to store and use for an extended period of time.

Frozen cheese has a similar taste to fresh cheese since freezing doesn’t impact the taste and texture. As a result, it has become an ideal alternative to fresh cheese and is being increasingly used in everyday meals, snacks, and desserts.

Along with frozen vegetables, frozen fruits, and frozen meats, the trend for frozen cheese is expected to surge in near future. Frozen cheese is being increasingly used in salads, pasta, soups, and several other applications. This widespread application in the food and beverage industry is expected to propel the demand for frozen cheese in the near future.

Similarly, manufacturers are investing in developing technology to freeze different types of cheese to prolong their shelf life without altering their taste and texture. This will further accelerate the growth of the frozen cheese market during the assessment period.

Frozen Cheese Market

What are the Key Trends Driving the Global Frozen Cheese Market?

Rising Usage in Cooked Food Fostering Frozen Cheese Sales in the Global Market

Most of the frozen cheese is being used for cooking dishes in which changes to texture are less noticeable, such as in sauces or on pizza and grilled cheese sandwiches.

Rising production and consumption of these food products as a result of a rapidly growing population, changing lifestyles, and increasing disposable income will therefore continue to push the demand for frozen cheese during the forecast period.

It is better to freeze cheese that is designed to be used in cooking food. However, some forms of cheese should be frozen and others should be refrigerated for optimum taste and flavor. Mozzarella and pizza cheese in addition to soft goat cheese are suitable for freezing. Handmade cheese on the other hand should be consumed fresh to maintain its natural aroma.
Nandini Roy Choudhury

Principal Consultant

Talk to Analyst

Find your sweet spots for generating winning opportunities in this market.

Country-wise Insights

How is the USA Frozen Cheese Market Shaping?

Easy Availability of Multiple Brands Propelling Growth in the USA Frozen Cheese Market

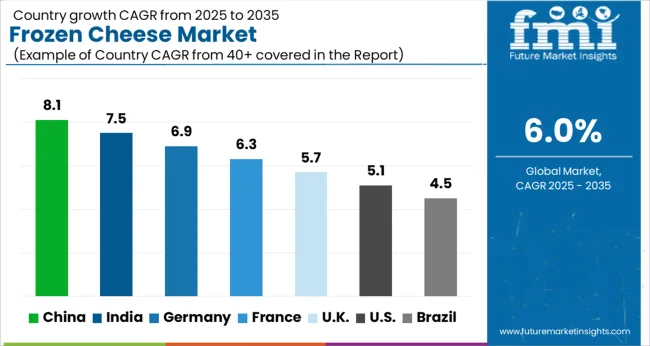
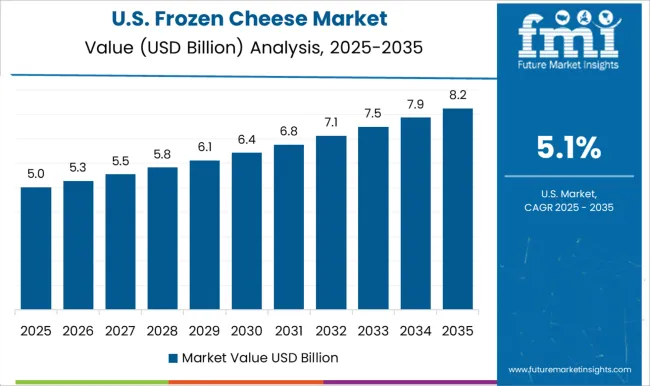
As per FMI, the USA frozen cheese is expected to reach a value of about US$ 1.8 Billion in 2022 which is approximately 23% of the global frozen cheese market. Demand for cheese is high in North American nations like the USA due to the easy availability of different brands that offer vegan and plant-based variants.

Cheese is consumed through different food products and is included in everyday snacks and meals. Families generally buy cheese in bulk in order to avail of different offers at supermarkets. Hence freezing cheese is a common practice across the USA

Many players are also offering frozen cheese in different varieties and flavors which is expected to raise the demand for frozen cheese in the market during the forecast period. Besides this, rising consumers' shift towards cheese that has a longer shelf life and is highly portable with a similar nutritional profile as conventional cheese will bode well for the USA frozen cheese market.

In addition to this, increasing consumer spending on fast foods like pizza and hamburgers is likely to act as a catalyst for accelerating growth in the USA frozen cheese market during the forecast period.

Why is India Considered a Promising Market for Frozen Cheese?

Rise in Number of Frozen Cheese Startups Driving Market Growth in India

According to Future Market Insights, the Indian frozen cheese market is expected to reach a valuation of US$ 0.9 Billion in 2022 which is approximately 18% of the global frozen cheese market. This can be attributed to the rising production and consumption of fast foods, exploding population, rising disposable income, and surge in the number of startups offering frozen cheese.

Over the years, the surge in the number of women joining the workforce has increased the demand for ready-to-eat food in the market. Consumers prefer to buy eatables that are easy to cook and have a longer shelf life. Due to the willingness of consumers to try different international cuisines whose critical ingredient is cheese, sales of frozen cheese are slated to grow at a healthy pace across India.

Similarly, the easy availability of a few foreign brands offering different variants of frozen cheese is expected to further push the revenue generation of the frozen cheese market in the country.

Category-wise Insights

Which is the Most Consumed Frozen Cheese Type?

Demand to Remain High for Cow Cheese in The Market

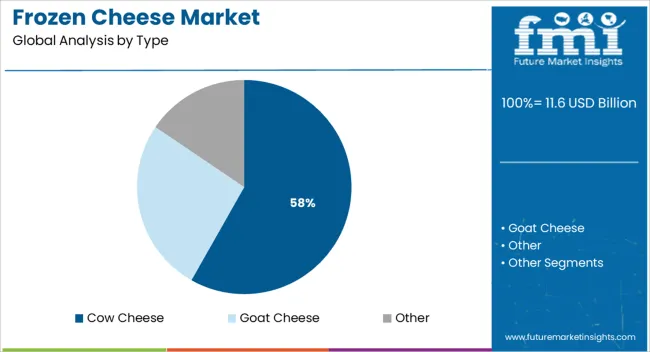
As per FMI, demand for frozen cow cheese will continue to outpace other types during the forecast period, owing to the easy availability of cow’s milk in large quantities and growing consumer preference for cheese derived from cow’s milk because of its peculiar taste and texture.

Cow cheese is available in different forms and flavors and pack sizes for consumers to choose from. Consumers are purchasing food that is easy to make but maintains an essential nutritional profile. These factors are expected to propel the demand for frozen cows’ cheese in the future.

Which Sales Channel Generates Maximum Revenue in Frozen Cheese Market?

Frozen Cheese Sales to Grow at Highest Pace Through Online Sales Channel

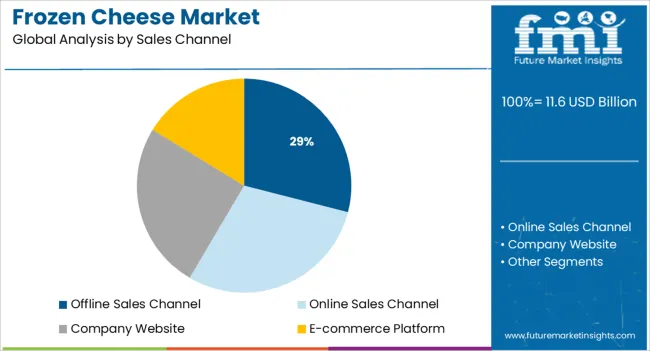
As per FMI, the online channel is predicted to grow at a 6.7% annual rate between 2022 and 2032, accounting for 50% of all sales. In order to increase product awareness brands are collaborating with online marketplaces like Amazon and Walmart. They are using machine learning and artificial intelligence to improve the consumer experience and make it easier for consumers to navigate the website.

Similarly, to increase consumer awareness, new products are displayed on a variety of internet portals and company websites. Consumers can now select from a variety of frozen cheeses from a variety of brands and price points. In the coming years, this is projected to have a favorable impact on the demand for frozen cheese.
Get the data you need at a Fraction of the cost

Personalize your report by choosing insights you need
and save 40%!

Competitive Landscape

Manufacturers of frozen cheese are experimenting with new methods to meet increased consumer demand for healthful foods. New cheese kinds are being developed by major manufacturers that are healthy to eat.

  • Nomad Foods, Europe’s largest frozen food player announced the plan to acquire Fortenova’s frozen savory and ice cream assets for approximately euro 615 million.
  • In 2020, Savencia Cheese USA launched CheeseLoverShop.com, a one-stop shop for premium cheeses.
  • In 2021, BelGioioso announced the acquisition of the Polly-O Cheese Brand from Lactalis.

Similarly, startups like GOOD PLANeT Foods (founded in 2017) and Daiya (2008)are entering the frozen cheese space by launching various frozen cheese varieties including plant-based ones.

Eurial, Avergavenny Fine Food Co., and Delamere Dairy- Top 3 Players in the Field of Frozen Cheese

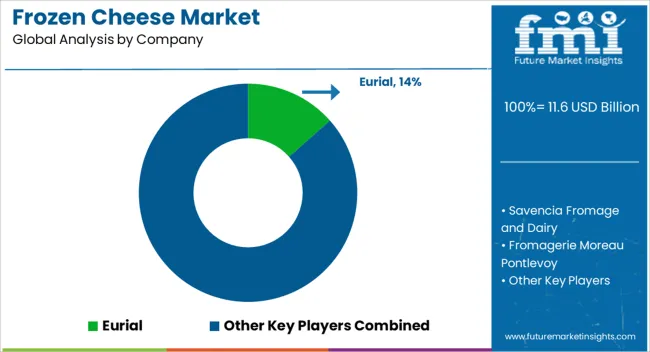
Eurial is one of the prominent players in the frozen cheese space. The company pioneered IQF for cheese through its frozen SOIGNON goat’s cheese slices. Eurial also has a strong presence in the mozzarella cheese category.

The company has over 16 production sites across the globe. It has more than 5,000 producers and 2,500 farms where products are made for specific purposes such as frozen cheese, butter, and cream.

The company has a strong presence in Europe, however, it is also focusing on increasing its revenues from other countries. At present, Eurial’s international activity represents over 35% of its turnover. The company is also focusing on accelerating its international presence through Fromager d’ Affinois & Grand Fermage brands.

Abergavenny Fine Food Co. is another leading player in the frozen cheese space. It has a robust presence in this space through Abergavenny Creamery. The company has a strong focus on sourcing ingredients locally. It also has an excellent supply relationship with farmers who provide the company with fresh milk on a daily basis.

The company has a strong presence in Europe and is well-known for its products. For instance, in 2021, the company was named one of the top 50 fastest-growing independents in the United Kingdom Abergavenny Fine Food Co. is also focusing on partnering with other organizations to consolidate its position. For instance, in 2021, it partnered up with Somerdale International for expanding its blended cheese business.

Delamere Dairy is a United Kingdom-based company with a significant presence in Italy, Hong Kong, Singapore, and the Middle East. The company works with goat farmers across the world as goat milk is one of its primary products.

The company is also focused on sustainable packaging as a preference for environmental conservation is growing. The company further launched new packaging in July 2022 which is made from 75% paperboard renewable raw materials. Further, it is focusing on boosting its export capabilities internationally. For instance, in July 2022, the company announced that it will be exporting its products to Vietnam.

Scope of the Report

Attributes Details
Estimated Market Size (2022) US$ 9.7 Billion
Projected Market Size (2032) US$ 17.4 Billion
Anticipated Growth Rate (2022 to 2032) 6% CAGR
Forecast Period 2022 to 2032
Historical Data Available for 2017 to 2021
Market Analysis US$ Million for Value and Million. Sq. M. for Volume
Key Regions Covered North America, Latin America, Europe, East Asia, South Asia, and the Middle East & Africa
Key Countries Covered USA, Brazil, Mexico, Germany, United Kingdom, China, India, Japan, Australia, and GCC Countries
Key Segments Covered Form, Type, Source, End-Use Application, Sales Channel, and Region
Key Companies Profiled
  • Eurial
  • Savencia Fromage and Dairy
  • Fromagerie Moreau Pontlevoy
  • Abergavenny Fine Foods
  • Ile de France
  • Henri Willig
  • LACTEOS SEGARRA
  • President
  • Le Larry
  • Delamere Dairy
Report Coverage Market Forecast, Company Share Analysis, Competition Intelligence, Drivers, Restraints, Opportunities and Threats Analysis, Market Dynamics and Challenges, and Strategic Growth Initiatives

Frozen Cheese Market by Category

By Type:

  • Goat Cheese
  • Cow Cheese
  • Other

By Sales Channel:

  • Offline Sales Channel
    • Supermarkets/Hypermarkets
    • Departmental Stores
    • Convenience Store
    • Other Sales Channel
  • Online Sales Channel
    • Company Website
    • E-commerce Platform

By Region:

  • North America
  • Latin America
  • Europe
  • East Asia
  • South Asia
  • Oceania
  • Middle East and Africa

Frequently Asked Questions

What is the current size of the global frozen cheese market?

The global frozen cheese market is estimated to reach around US$ 9.7 Billion in 2022.

What is the demand outlook for frozen cheese market?

As per FMI, the global frozen market is forecast to grow at a 6% CAGR between 2022 and 2032, surpassing a valuation of US$ 17.4 by the end of 2032.

What was the last 5-year CAGR of the frozen cheese market?

Between 2017 and 2021, the global frozen cheese market grew at a 5.5 % CAGR.

What are the key trends shaping the frozen cheese market?

Consumer inclination towards convenient and ready-to-cook food, the development of advanced freezing technologies, and an increase in consumer spending capacity are some of the key trends shaping the frozen cheese market.

At what rate will frozen cheese demand grow in North America?

Demand for frozen cheese will grow at 5.6% CAGR between 2022 and 2032.

Table of Content

1. Executive Summary | Frozen Cheese Market

    1.1. Global Market Outlook

    1.2. Demand-side Trends

    1.3. Supply-side Trends

    1.4. Technology Roadmap Analysis

    1.5. Analysis and Recommendations

2. Market Overview

    2.1. Market Coverage / Taxonomy

    2.2. Market Definition / Scope / Limitations

3. Market Background

    3.1. Market Dynamics

        3.1.1. Drivers

        3.1.2. Restraints

        3.1.3. Opportunity

        3.1.4. Trends

    3.2. Scenario Forecast

        3.2.1. Demand in Optimistic Scenario

        3.2.2. Demand in Likely Scenario

        3.2.3. Demand in Conservative Scenario

    3.3. Product launches & Recent Developments

    3.4. Product Life Cycle Analysis

    3.5. Value Chain Analysis

        3.5.1. Supply Side Participants and their Roles

            3.5.1.1. Producers

            3.5.1.2. Mid-Level Participants (Traders/ Agents/ Brokers)

            3.5.1.3. Wholesalers and Distributors

        3.5.2. % of Operating Margin Analysis

        3.5.3. List of Raw Material Suppliers

        3.5.4. List of Existing and Potential Buyers

    3.6. Global Market - Pricing Analysis

        3.6.1. Price Point Assessment by Region

        3.6.2. Price Point Assessment by Type

        3.6.3. Price Forecast till 2032

        3.6.4. Factors affecting pricing

    3.7. Forecast Factors - Relevance & Impact

    3.8. Regulatory Landscape

        3.8.1. Packaging & Labelling Regulations

        3.8.2. Certifications and Certifying Agency Overview

        3.8.3. Import/Export Policies

    3.9. Regional Parent Market Outlook

    3.10. Consumers Survey Analysis

    3.11. Macro-Economic Factors

    3.12. Product Claims & Nutritional Information scanned by Buyers

4. Global Market Analysis 2017 to 2021 and Forecast, 2022 to 2032

    4.1. Historical Market Size Value (US$ Billion) & Volume (MT) Analysis, 2017 to 2021

    4.2. Current and Future Market Size Value (US$ Billion) & Volume (MT) Projections, 2022 to 2032

        4.2.1. Y-o-Y Growth Trend Analysis

        4.2.2. Absolute $ Opportunity Analysis

5. Global Market Analysis 2017 to 2021 and Forecast 2022 to 2032, By Type

    5.1. Introduction / Key Findings

    5.2. Historical Market Size Value (US$ Billion) & Volume (MT) Analysis By Type, 2017 to 2021

    5.3. Current and Future Market Size Value (US$ Billion) & Volume (MT) Analysis and Forecast By Type, 2022 to 2032

        5.3.1. Goat Cheese

        5.3.2. Cow Cheese

        5.3.3. Other

    5.4. Y-o-Y Growth Trend Analysis By Type, 2017 to 2021

    5.5. Absolute $ Opportunity Analysis By Type, 2022 to 2032

6. Global Market Analysis 2017 to 2021 and Forecast 2022 to 2032, By Sales Channel

    6.1. Introduction / Key Findings

    6.2. Historical Market Size Value (US$ Billion) & Volume (MT) Analysis By Sales Channel, 2017 to 2021

    6.3. Current and Future Market Size Value (US$ Billion) & Volume (MT) Analysis and Forecast By Sales Channel, 2022 to 2032

        6.3.1. Offline Sales Channel

            6.3.1.1. Supermarkets/Hypermarkets

            6.3.1.2. Departmental Stores

            6.3.1.3. Convenience Store

            6.3.1.4. Other Sales Channel

        6.3.2. Online Sales Channel

            6.3.2.1. Company Website

            6.3.2.2. E-Commerce Platform

        6.3.3. Other Facilities

    6.4. Y-o-Y Growth Trend Analysis By Sales Channel, 2017 to 2021

    6.5. Absolute $ Opportunity Analysis By Sales Channel, 2022 to 2032

7. Global Market Analysis 2017 to 2021 and Forecast 2022 to 2032, By Region

    7.1. Introduction

    7.2. Historical Market Size Value (US$ Billion) & Volume (MT) Analysis By Region, 2017 to 2021

    7.3. Current Market Size Value (US$ Billion) & Volume (MT) Analysis and Forecast By Region, 2022 to 2032

        7.3.1. North America

        7.3.2. Latin America

        7.3.3. Europe

        7.3.4. East Asia

        7.3.5. South Asia

        7.3.6. Oceania

        7.3.7. Middle East and Africa

    7.4. Market Attractiveness Analysis By Region

8. North America Market Analysis 2017 to 2021 and Forecast 2022 to 2032, By Country

    8.1. Historical Market Size Value (US$ Billion) & Volume (MT) Trend Analysis By Market Taxonomy, 2017 to 2021

    8.2. Market Size Value (US$ Billion) & Volume (MT) Forecast By Market Taxonomy, 2022 to 2032

        8.2.1. By Country

            8.2.1.1. United States of America

            8.2.1.2. Canada

        8.2.2. By Type

        8.2.3. By Sales Channel

    8.3. Market Attractiveness Analysis

        8.3.1. By Country

        8.3.2. By Type

        8.3.3. By Sales Channel

    8.4. Key Takeaways

9. Latin America Market Analysis 2017 to 2021 and Forecast 2022 to 2032, By Country

    9.1. Historical Market Size Value (US$ Billion) & Volume (MT) Trend Analysis By Market Taxonomy, 2017 to 2021

    9.2. Market Size Value (US$ Billion) & Volume (MT) Forecast By Market Taxonomy, 2022 to 2032

        9.2.1. By Country

            9.2.1.1. Brazil

            9.2.1.2. Mexico

            9.2.1.3. Argentina

            9.2.1.4. Chile

            9.2.1.5. Peru

            9.2.1.6. Rest of Latin America

        9.2.2. By Type

        9.2.3. By Sales Channel

    9.3. Market Attractiveness Analysis

        9.3.1. By Country

        9.3.2. By Type

        9.3.3. By Sales Channel

    9.4. Key Takeaways

10. Europe Market Analysis 2017 to 2021 and Forecast 2022 to 2032, By Country

    10.1. Historical Market Size Value (US$ Billion) & Volume (MT) Trend Analysis By Market Taxonomy, 2017 to 2021

    10.2. Market Size Value (US$ Billion) & Volume (MT) Forecast By Market Taxonomy, 2022 to 2032

        10.2.1. By Country

            10.2.1.1. Germany

            10.2.1.2. Italy

            10.2.1.3. France

            10.2.1.4. United Kingdom

            10.2.1.5. Spain

            10.2.1.6. Russia

            10.2.1.7. BENELUX

            10.2.1.8. Poland

            10.2.1.9. Nordic Countries

            10.2.1.10. Rest of Europe

        10.2.2. By Type

        10.2.3. By Sales Channel

    10.3. Market Attractiveness Analysis

        10.3.1. By Country

        10.3.2. By Type

        10.3.3. By Sales Channel

    10.4. Key Takeaways

11. East Asia Market Analysis 2017 to 2021 and Forecast 2022 to 2032, By Country

    11.1. Historical Market Size Value (US$ Billion) & Volume (MT) Trend Analysis By Market Taxonomy, 2017 to 2021

    11.2. Market Size Value (US$ Billion) & Volume (MT) Forecast By Market Taxonomy, 2022 to 2032

        11.2.1. By Country

            11.2.1.1. China

            11.2.1.2. Japan

            11.2.1.3. South Korea

        11.2.2. By Type

        11.2.3. By Sales Channel

    11.3. Market Attractiveness Analysis

        11.3.1. By Country

        11.3.2. By Type

        11.3.3. By Sales Channel

    11.4. Key Takeaways

12. South Asia Market Analysis 2017 to 2021 and Forecast 2022 to 2032, By Country

    12.1. Historical Market Size Value (US$ Billion) & Volume (MT) Trend Analysis By Market Taxonomy, 2017 to 2021

    12.2. Market Size Value (US$ Billion) & Volume (MT) Forecast By Market Taxonomy, 2022 to 2032

        12.2.1. By Country

            12.2.1.1. India

            12.2.1.2. Thailand

            12.2.1.3. Malaysia

            12.2.1.4. Indonesia

            12.2.1.5. Singapore

            12.2.1.6. Rest of South Asia

        12.2.2. By Type

        12.2.3. By Sales Channel

    12.3. Market Attractiveness Analysis

        12.3.1. By Country

        12.3.2. By Type

        12.3.3. By Sales Channel

    12.4. Key Takeaways

13. Oceania Market Analysis 2017 to 2021 and Forecast 2022 to 2032, By Country

    13.1. Historical Market Size Value (US$ Billion) & Volume (MT) Trend Analysis By Market Taxonomy, 2017 to 2021

    13.2. Market Size Value (US$ Billion) & Volume (MT) Forecast By Market Taxonomy, 2022 to 2032

        13.2.1. By Country

            13.2.1.1. Australia

            13.2.1.2. New Zealand

        13.2.2. By Type

        13.2.3. By Sales Channel

    13.3. Market Attractiveness Analysis

        13.3.1. By Country

        13.3.2. By Type

        13.3.3. By Sales Channel

    13.4. Key Takeaways

14. Middle East and Africa Market Analysis 2017 to 2021 and Forecast 2022 to 2032, By Country

    14.1. Historical Market Size Value (US$ Billion) & Volume (MT) Trend Analysis By Market Taxonomy, 2017 to 2021

    14.2. Market Size Value (US$ Billion) & Volume (MT) Forecast By Market Taxonomy, 2022 to 2032

        14.2.1. By Country

            14.2.1.1. GCC Countries

            14.2.1.2. South Africa

            14.2.1.3. Central Africa

            14.2.1.4. North Africa

        14.2.2. By Type

        14.2.3. By Sales Channel

    14.3. Market Attractiveness Analysis

        14.3.1. By Country

        14.3.2. By Type

        14.3.3. By Sales Channel

    14.4. Key Takeaways

15. Key Countries Market Analysis

    15.1. United States of America

        15.1.1. Pricing Analysis

        15.1.2. Market Share Analysis, 2021

            15.1.2.1. By Type

            15.1.2.2. By Sales Channel

    15.2. Canada

        15.2.1. Pricing Analysis

        15.2.2. Market Share Analysis, 2021

            15.2.2.1. By Type

            15.2.2.2. By Sales Channel

    15.3. Brazil

        15.3.1. Pricing Analysis

        15.3.2. Market Share Analysis, 2021

            15.3.2.1. By Type

            15.3.2.2. By Sales Channel

    15.4. Mexico

        15.4.1. Pricing Analysis

        15.4.2. Market Share Analysis, 2021

            15.4.2.1. By Type

            15.4.2.2. By Sales Channel

    15.5. Argentina

        15.5.1. Pricing Analysis

        15.5.2. Market Share Analysis, 2021

            15.5.2.1. By Type

            15.5.2.2. By Sales Channel

    15.6. Chile

        15.6.1. Pricing Analysis

        15.6.2. Market Share Analysis, 2021

            15.6.2.1. By Type

            15.6.2.2. By Sales Channel

    15.7. Peru

        15.7.1. Pricing Analysis

        15.7.2. Market Share Analysis, 2021

            15.7.2.1. By Type

            15.7.2.2. By Sales Channel

    15.8. Germany

        15.8.1. Pricing Analysis

        15.8.2. Market Share Analysis, 2021

            15.8.2.1. By Type

            15.8.2.2. By Sales Channel

    15.9. Italy

        15.9.1. Pricing Analysis

        15.9.2. Market Share Analysis, 2021

            15.9.2.1. By Type

            15.9.2.2. By Sales Channel

    15.10. France

        15.10.1. Pricing Analysis

        15.10.2. Market Share Analysis, 2021

            15.10.2.1. By Type

            15.10.2.2. By Sales Channel

    15.11. Spain

        15.11.1. Pricing Analysis

        15.11.2. Market Share Analysis, 2021

            15.11.2.1. By Type

            15.11.2.2. By Sales Channel

    15.12. United Kingdom

        15.12.1. Pricing Analysis

        15.12.2. Market Share Analysis, 2021

            15.12.2.1. By Type

            15.12.2.2. By Sales Channel

    15.13. Russia

        15.13.1. Pricing Analysis

        15.13.2. Market Share Analysis, 2021

            15.13.2.1. By Type

            15.13.2.2. By Sales Channel

    15.14. Poland

        15.14.1. Pricing Analysis

        15.14.2. Market Share Analysis, 2021

            15.14.2.1. By Type

            15.14.2.2. By Sales Channel

    15.15. BENELUX

        15.15.1. Pricing Analysis

        15.15.2. Market Share Analysis, 2021

            15.15.2.1. By Type

            15.15.2.2. By Sales Channel

    15.16. Nordic Countries

        15.16.1. Pricing Analysis

        15.16.2. Market Share Analysis, 2021

            15.16.2.1. By Type

            15.16.2.2. By Sales Channel

    15.17. China

        15.17.1. Pricing Analysis

        15.17.2. Market Share Analysis, 2021

            15.17.2.1. By Type

            15.17.2.2. By Sales Channel

    15.18. Japan

        15.18.1. Pricing Analysis

        15.18.2. Market Share Analysis, 2021

            15.18.2.1. By Type

            15.18.2.2. By Sales Channel

    15.19. South Korea

        15.19.1. Pricing Analysis

        15.19.2. Market Share Analysis, 2021

            15.19.2.1. By Type

            15.19.2.2. By Sales Channel

    15.20. India

        15.20.1. Pricing Analysis

        15.20.2. Market Share Analysis, 2021

            15.20.2.1. By Type

            15.20.2.2. By Sales Channel

    15.21. Thailand

        15.21.1. Pricing Analysis

        15.21.2. Market Share Analysis, 2021

            15.21.2.1. By Type

            15.21.2.2. By Sales Channel

    15.22. Indonesia

        15.22.1. Pricing Analysis

        15.22.2. Market Share Analysis, 2021

            15.22.2.1. By Type

            15.22.2.2. By Sales Channel

    15.23. Malaysia

        15.23.1. Pricing Analysis

        15.23.2. Market Share Analysis, 2021

            15.23.2.1. By Type

            15.23.2.2. By Sales Channel

    15.24. Singapore

        15.24.1. Pricing Analysis

        15.24.2. Market Share Analysis, 2021

            15.24.2.1. By Type

            15.24.2.2. By Sales Channel

    15.25. Australia

        15.25.1. Pricing Analysis

        15.25.2. Market Share Analysis, 2021

            15.25.2.1. By Type

            15.25.2.2. By Sales Channel

    15.26. New Zealand

        15.26.1. Pricing Analysis

        15.26.2. Market Share Analysis, 2021

            15.26.2.1. By Type

            15.26.2.2. By Sales Channel

    15.27. GCC Countries

        15.27.1. Pricing Analysis

        15.27.2. Market Share Analysis, 2021

            15.27.2.1. By Type

            15.27.2.2. By Sales Channel

    15.28. South Africa

        15.28.1. Pricing Analysis

        15.28.2. Market Share Analysis, 2021

            15.28.2.1. By Type

            15.28.2.2. By Sales Channel

    15.29. North Africa

        15.29.1. Pricing Analysis

        15.29.2. Market Share Analysis, 2021

            15.29.2.1. By Type

            15.29.2.2. By Sales Channel

    15.30. Central Africa

        15.30.1. Pricing Analysis

        15.30.2. Market Share Analysis, 2021

            15.30.2.1. By Type

            15.30.2.2. By Sales Channel

16. Market Structure Analysis

    16.1. Competition Dashboard

    16.2. Competition Benchmarking

    16.3. Market Share Analysis of Top Players

        16.3.1. By Regional

        16.3.2. By Type

        16.3.3. By Sales Channel

17. Competition Analysis

    17.1. Competition Deep Dive

        17.1.1. Eurial

            17.1.1.1. Overview

            17.1.1.2. Product Portfolio

            17.1.1.3. Profitability by Market Segments (Type/Sales Channel/Region)

            17.1.1.4. Sales Footprint

            17.1.1.5. Strategy Overview

                17.1.1.5.1. Marketing Strategy

                17.1.1.5.2. Product Strategy

                17.1.1.5.3. Channel Strategy

        17.1.2. Savencia Fromage and Dairy

            17.1.2.1. Overview

            17.1.2.2. Product Portfolio

            17.1.2.3. Profitability by Market Segments (Type/Sales Channel/Region)

            17.1.2.4. Sales Footprint

            17.1.2.5. Strategy Overview

                17.1.2.5.1. Marketing Strategy

                17.1.2.5.2. Product Strategy

                17.1.2.5.3. Channel Strategy

        17.1.3. Fromagerie Moreau Pontlevoy

            17.1.3.1. Overview

            17.1.3.2. Product Portfolio

            17.1.3.3. Profitability by Market Segments (Type/Sales Channel/Region)

            17.1.3.4. Sales Footprint

            17.1.3.5. Strategy Overview

                17.1.3.5.1. Marketing Strategy

                17.1.3.5.2. Product Strategy

                17.1.3.5.3. Channel Strategy

        17.1.4. Abergavenny Fine Foods

            17.1.4.1. Overview

            17.1.4.2. Product Portfolio

            17.1.4.3. Profitability by Market Segments (Type/Sales Channel/Region)

            17.1.4.4. Sales Footprint

            17.1.4.5. Strategy Overview

                17.1.4.5.1. Marketing Strategy

                17.1.4.5.2. Product Strategy

                17.1.4.5.3. Channel Strategy

        17.1.5. Ile De France

            17.1.5.1. Overview

            17.1.5.2. Product Portfolio

            17.1.5.3. Profitability by Market Segments (Type/Sales Channel/Region)

            17.1.5.4. Sales Footprint

            17.1.5.5. Strategy Overview

                17.1.5.5.1. Marketing Strategy

                17.1.5.5.2. Product Strategy

                17.1.5.5.3. Channel Strategy

        17.1.6. Henri Willig

            17.1.6.1. Overview

            17.1.6.2. Product Portfolio

            17.1.6.3. Profitability by Market Segments (Type/Sales Channel/Region)

            17.1.6.4. Sales Footprint

            17.1.6.5. Strategy Overview

                17.1.6.5.1. Marketing Strategy

                17.1.6.5.2. Product Strategy

                17.1.6.5.3. Channel Strategy

        17.1.7. LACTEOS SEGARRA

            17.1.7.1. Overview

            17.1.7.2. Product Portfolio

            17.1.7.3. Profitability by Market Segments (Type/Sales Channel/Region)

            17.1.7.4. Sales Footprint

            17.1.7.5. Strategy Overview

                17.1.7.5.1. Marketing Strategy

                17.1.7.5.2. Product Strategy

                17.1.7.5.3. Channel Strategy

        17.1.8. President

            17.1.8.1. Overview

            17.1.8.2. Product Portfolio

            17.1.8.3. Profitability by Market Segments (Type/Sales Channel/Region)

            17.1.8.4. Sales Footprint

            17.1.8.5. Strategy Overview

                17.1.8.5.1. Marketing Strategy

                17.1.8.5.2. Product Strategy

                17.1.8.5.3. Channel Strategy

        17.1.9. Le Larry

            17.1.9.1. Overview

            17.1.9.2. Product Portfolio

            17.1.9.3. Profitability by Market Segments (Type/Sales Channel/Region)

            17.1.9.4. Sales Footprint

            17.1.9.5. Strategy Overview

                17.1.9.5.1. Marketing Strategy

                17.1.9.5.2. Product Strategy

                17.1.9.5.3. Channel Strategy

        17.1.10. Delamere Dairy

            17.1.10.1. Overview

            17.1.10.2. Product Portfolio

            17.1.10.3. Profitability by Market Segments (Type/Sales Channel/Region)

            17.1.10.4. Sales Footprint

            17.1.10.5. Strategy Overview

                17.1.10.5.1. Marketing Strategy

                17.1.10.5.2. Product Strategy

                17.1.10.5.3. Channel Strategy

        17.1.11. Others on Additional Request

            17.1.11.1. Overview

            17.1.11.2. Product Portfolio

            17.1.11.3. Profitability by Market Segments (Type/Sales Channel/Region)

            17.1.11.4. Sales Footprint

            17.1.11.5. Strategy Overview

                17.1.11.5.1. Marketing Strategy

                17.1.11.5.2. Product Strategy

                17.1.11.5.3. Channel Strategy

18. Assumptions & Acronyms Used

19. Research Methodology

List of Tables

Table 1: Global Market Value (US$ Million/Billion) Forecast by Region, 2017 to 2032

Table 2: Global Market Volume (MT) Forecast by Region, 2017 to 2032

Table 3: Global Market Value (US$ Million/Billion) Forecast by Type, 2017 to 2032

Table 4: Global Market Volume (MT) Forecast by Type, 2017 to 2032

Table 5: Global Market Value (US$ Million/Billion) Forecast by Sales Channel, 2017 to 2032

Table 6: Global Market Volume (MT) Forecast by Sales Channel, 2017 to 2032

Table 7: North America Market Value (US$ Million/Billion) Forecast by Country, 2017 to 2032

Table 8: North America Market Volume (MT) Forecast by Country, 2017 to 2032

Table 9: North America Market Value (US$ Million/Billion) Forecast by Type, 2017 to 2032

Table 10: North America Market Volume (MT) Forecast by Type, 2017 to 2032

Table 11: North America Market Value (US$ Million/Billion) Forecast by Sales Channel, 2017 to 2032

Table 12: North America Market Volume (MT) Forecast by Sales Channel, 2017 to 2032

Table 13: Latin America Market Value (US$ Million/Billion) Forecast by Country, 2017 to 2032

Table 14: Latin America Market Volume (MT) Forecast by Country, 2017 to 2032

Table 15: Latin America Market Value (US$ Million/Billion) Forecast by Type, 2017 to 2032

Table 16: Latin America Market Volume (MT) Forecast by Type, 2017 to 2032

Table 17: Latin America Market Value (US$ Million/Billion) Forecast by Sales Channel, 2017 to 2032

Table 18: Latin America Market Volume (MT) Forecast by Sales Channel, 2017 to 2032

Table 19: Europe Market Value (US$ Million/Billion) Forecast by Country, 2017 to 2032

Table 20: Europe Market Volume (MT) Forecast by Country, 2017 to 2032

Table 21: Europe Market Value (US$ Million/Billion) Forecast by Type, 2017 to 2032

Table 22: Europe Market Volume (MT) Forecast by Type, 2017 to 2032

Table 23: Europe Market Value (US$ Million/Billion) Forecast by Sales Channel, 2017 to 2032

Table 24: Europe Market Volume (MT) Forecast by Sales Channel, 2017 to 2032

Table 25: East Asia Market Value (US$ Million/Billion) Forecast by Country, 2017 to 2032

Table 26: East Asia Market Volume (MT) Forecast by Country, 2017 to 2032

Table 27: East Asia Market Value (US$ Million/Billion) Forecast by Type, 2017 to 2032

Table 28: East Asia Market Volume (MT) Forecast by Type, 2017 to 2032

Table 29: East Asia Market Value (US$ Million/Billion) Forecast by Sales Channel, 2017 to 2032

Table 30: East Asia Market Volume (MT) Forecast by Sales Channel, 2017 to 2032

Table 31: South Asia Market Value (US$ Million/Billion) Forecast by Country, 2017 to 2032

Table 32: South Asia Market Volume (MT) Forecast by Country, 2017 to 2032

Table 33: South Asia Market Value (US$ Million/Billion) Forecast by Type, 2017 to 2032

Table 34: South Asia Market Volume (MT) Forecast by Type, 2017 to 2032

Table 35: South Asia Market Value (US$ Million/Billion) Forecast by Sales Channel, 2017 to 2032

Table 36: South Asia Market Volume (MT) Forecast by Sales Channel, 2017 to 2032

Table 37: Oceania Market Value (US$ Million/Billion) Forecast by Country, 2017 to 2032

Table 38: Oceania Market Volume (MT) Forecast by Country, 2017 to 2032

Table 39: Oceania Market Value (US$ Million/Billion) Forecast by Type, 2017 to 2032

Table 40: Oceania Market Volume (MT) Forecast by Type, 2017 to 2032

Table 41: Oceania Market Value (US$ Million/Billion) Forecast by Sales Channel, 2017 to 2032

Table 42: Oceania Market Volume (MT) Forecast by Sales Channel, 2017 to 2032

Table 43: Middle East and Africa Market Value (US$ Million/Billion) Forecast by Country, 2017 to 2032

Table 44: Middle East and Africa Market Volume (MT) Forecast by Country, 2017 to 2032

Table 45: Middle East and Africa Market Value (US$ Million/Billion) Forecast by Type, 2017 to 2032

Table 46: Middle East and Africa Market Volume (MT) Forecast by Type, 2017 to 2032

Table 47: Middle East and Africa Market Value (US$ Million/Billion) Forecast by Sales Channel, 2017 to 2032

Table 48: Middle East and Africa Market Volume (MT) Forecast by Sales Channel, 2017 to 2032

List of Charts

Figure 1: Global Market Value (US$ Million/Billion) by Type, 2022 to 2032

Figure 2: Global Market Value (US$ Million/Billion) by Sales Channel, 2022 to 2032

Figure 3: Global Market Value (US$ Million/Billion) by Region, 2022 to 2032

Figure 4: Global Market Value (US$ Million/Billion) Analysis by Region, 2017 to 2032

Figure 5: Global Market Volume (MT) Analysis by Region, 2017 to 2032

Figure 6: Global Market Value Share (%) and BPS Analysis by Region, 2022 to 2032

Figure 7: Global Market Y-o-Y Growth (%) Projections by Region, 2022 to 2032

Figure 8: Global Market Value (US$ Million/Billion) Analysis by Type, 2017 to 2032

Figure 9: Global Market Volume (MT) Analysis by Type, 2017 to 2032

Figure 10: Global Market Value Share (%) and BPS Analysis by Type, 2022 to 2032

Figure 11: Global Market Y-o-Y Growth (%) Projections by Type, 2022 to 2032

Figure 12: Global Market Value (US$ Million/Billion) Analysis by Sales Channel, 2017 to 2032

Figure 13: Global Market Volume (MT) Analysis by Sales Channel, 2017 to 2032

Figure 14: Global Market Value Share (%) and BPS Analysis by Sales Channel, 2022 to 2032

Figure 15: Global Market Y-o-Y Growth (%) Projections by Sales Channel, 2022 to 2032

Figure 16: Global Market Attractiveness by Type, 2022 to 2032

Figure 17: Global Market Attractiveness by Sales Channel, 2022 to 2032

Figure 18: Global Market Attractiveness by Region, 2022 to 2032

Figure 19: North America Market Value (US$ Million/Billion) by Type, 2022 to 2032

Figure 20: North America Market Value (US$ Million/Billion) by Sales Channel, 2022 to 2032

Figure 21: North America Market Value (US$ Million/Billion) by Country, 2022 to 2032

Figure 22: North America Market Value (US$ Million/Billion) Analysis by Country, 2017 to 2032

Figure 23: North America Market Volume (MT) Analysis by Country, 2017 to 2032

Figure 24: North America Market Value Share (%) and BPS Analysis by Country, 2022 to 2032

Figure 25: North America Market Y-o-Y Growth (%) Projections by Country, 2022 to 2032

Figure 26: North America Market Value (US$ Million/Billion) Analysis by Type, 2017 to 2032

Figure 27: North America Market Volume (MT) Analysis by Type, 2017 to 2032

Figure 28: North America Market Value Share (%) and BPS Analysis by Type, 2022 to 2032

Figure 29: North America Market Y-o-Y Growth (%) Projections by Type, 2022 to 2032

Figure 30: North America Market Value (US$ Million/Billion) Analysis by Sales Channel, 2017 to 2032

Figure 31: North America Market Volume (MT) Analysis by Sales Channel, 2017 to 2032

Figure 32: North America Market Value Share (%) and BPS Analysis by Sales Channel, 2022 to 2032

Figure 33: North America Market Y-o-Y Growth (%) Projections by Sales Channel, 2022 to 2032

Figure 34: North America Market Attractiveness by Type, 2022 to 2032

Figure 35: North America Market Attractiveness by Sales Channel, 2022 to 2032

Figure 36: North America Market Attractiveness by Country, 2022 to 2032

Figure 37: Latin America Market Value (US$ Million/Billion) by Type, 2022 to 2032

Figure 38: Latin America Market Value (US$ Million/Billion) by Sales Channel, 2022 to 2032

Figure 39: Latin America Market Value (US$ Million/Billion) by Country, 2022 to 2032

Figure 40: Latin America Market Value (US$ Million/Billion) Analysis by Country, 2017 to 2032

Figure 41: Latin America Market Volume (MT) Analysis by Country, 2017 to 2032

Figure 42: Latin America Market Value Share (%) and BPS Analysis by Country, 2022 to 2032

Figure 43: Latin America Market Y-o-Y Growth (%) Projections by Country, 2022 to 2032

Figure 44: Latin America Market Value (US$ Million/Billion) Analysis by Type, 2017 to 2032

Figure 45: Latin America Market Volume (MT) Analysis by Type, 2017 to 2032

Figure 46: Latin America Market Value Share (%) and BPS Analysis by Type, 2022 to 2032

Figure 47: Latin America Market Y-o-Y Growth (%) Projections by Type, 2022 to 2032

Figure 48: Latin America Market Value (US$ Million/Billion) Analysis by Sales Channel, 2017 to 2032

Figure 49: Latin America Market Volume (MT) Analysis by Sales Channel, 2017 to 2032

Figure 50: Latin America Market Value Share (%) and BPS Analysis by Sales Channel, 2022 to 2032

Figure 51: Latin America Market Y-o-Y Growth (%) Projections by Sales Channel, 2022 to 2032

Figure 52: Latin America Market Attractiveness by Type, 2022 to 2032

Figure 53: Latin America Market Attractiveness by Sales Channel, 2022 to 2032

Figure 54: Latin America Market Attractiveness by Country, 2022 to 2032

Figure 55: Europe Market Value (US$ Million/Billion) by Type, 2022 to 2032

Figure 56: Europe Market Value (US$ Million/Billion) by Sales Channel, 2022 to 2032

Figure 57: Europe Market Value (US$ Million/Billion) by Country, 2022 to 2032

Figure 58: Europe Market Value (US$ Million/Billion) Analysis by Country, 2017 to 2032

Figure 59: Europe Market Volume (MT) Analysis by Country, 2017 to 2032

Figure 60: Europe Market Value Share (%) and BPS Analysis by Country, 2022 to 2032

Figure 61: Europe Market Y-o-Y Growth (%) Projections by Country, 2022 to 2032

Figure 62: Europe Market Value (US$ Million/Billion) Analysis by Type, 2017 to 2032

Figure 63: Europe Market Volume (MT) Analysis by Type, 2017 to 2032

Figure 64: Europe Market Value Share (%) and BPS Analysis by Type, 2022 to 2032

Figure 65: Europe Market Y-o-Y Growth (%) Projections by Type, 2022 to 2032

Figure 66: Europe Market Value (US$ Million/Billion) Analysis by Sales Channel, 2017 to 2032

Figure 67: Europe Market Volume (MT) Analysis by Sales Channel, 2017 to 2032

Figure 68: Europe Market Value Share (%) and BPS Analysis by Sales Channel, 2022 to 2032

Figure 69: Europe Market Y-o-Y Growth (%) Projections by Sales Channel, 2022 to 2032

Figure 70: Europe Market Attractiveness by Type, 2022 to 2032

Figure 71: Europe Market Attractiveness by Sales Channel, 2022 to 2032

Figure 72: Europe Market Attractiveness by Country, 2022 to 2032

Figure 73: East Asia Market Value (US$ Million/Billion) by Type, 2022 to 2032

Figure 74: East Asia Market Value (US$ Million/Billion) by Sales Channel, 2022 to 2032

Figure 75: East Asia Market Value (US$ Million/Billion) by Country, 2022 to 2032

Figure 76: East Asia Market Value (US$ Million/Billion) Analysis by Country, 2017 to 2032

Figure 77: East Asia Market Volume (MT) Analysis by Country, 2017 to 2032

Figure 78: East Asia Market Value Share (%) and BPS Analysis by Country, 2022 to 2032

Figure 79: East Asia Market Y-o-Y Growth (%) Projections by Country, 2022 to 2032

Figure 80: East Asia Market Value (US$ Million/Billion) Analysis by Type, 2017 to 2032

Figure 81: East Asia Market Volume (MT) Analysis by Type, 2017 to 2032

Figure 82: East Asia Market Value Share (%) and BPS Analysis by Type, 2022 to 2032

Figure 83: East Asia Market Y-o-Y Growth (%) Projections by Type, 2022 to 2032

Figure 84: East Asia Market Value (US$ Million/Billion) Analysis by Sales Channel, 2017 to 2032

Figure 85: East Asia Market Volume (MT) Analysis by Sales Channel, 2017 to 2032

Figure 86: East Asia Market Value Share (%) and BPS Analysis by Sales Channel, 2022 to 2032

Figure 87: East Asia Market Y-o-Y Growth (%) Projections by Sales Channel, 2022 to 2032

Figure 88: East Asia Market Attractiveness by Type, 2022 to 2032

Figure 89: East Asia Market Attractiveness by Sales Channel, 2022 to 2032

Figure 90: East Asia Market Attractiveness by Country, 2022 to 2032

Figure 91: South Asia Market Value (US$ Million/Billion) by Type, 2022 to 2032

Figure 92: South Asia Market Value (US$ Million/Billion) by Sales Channel, 2022 to 2032

Figure 93: South Asia Market Value (US$ Million/Billion) by Country, 2022 to 2032

Figure 94: South Asia Market Value (US$ Million/Billion) Analysis by Country, 2017 to 2032

Figure 95: South Asia Market Volume (MT) Analysis by Country, 2017 to 2032

Figure 96: South Asia Market Value Share (%) and BPS Analysis by Country, 2022 to 2032

Figure 97: South Asia Market Y-o-Y Growth (%) Projections by Country, 2022 to 2032

Figure 98: South Asia Market Value (US$ Million/Billion) Analysis by Type, 2017 to 2032

Figure 99: South Asia Market Volume (MT) Analysis by Type, 2017 to 2032

Figure 100: South Asia Market Value Share (%) and BPS Analysis by Type, 2022 to 2032

Figure 101: South Asia Market Y-o-Y Growth (%) Projections by Type, 2022 to 2032

Figure 102: South Asia Market Value (US$ Million/Billion) Analysis by Sales Channel, 2017 to 2032

Figure 103: South Asia Market Volume (MT) Analysis by Sales Channel, 2017 to 2032

Figure 104: South Asia Market Value Share (%) and BPS Analysis by Sales Channel, 2022 to 2032

Figure 105: South Asia Market Y-o-Y Growth (%) Projections by Sales Channel, 2022 to 2032

Figure 106: South Asia Market Attractiveness by Type, 2022 to 2032

Figure 107: South Asia Market Attractiveness by Sales Channel, 2022 to 2032

Figure 108: South Asia Market Attractiveness by Country, 2022 to 2032

Figure 109: Oceania Market Value (US$ Million/Billion) by Type, 2022 to 2032

Figure 110: Oceania Market Value (US$ Million/Billion) by Sales Channel, 2022 to 2032

Figure 111: Oceania Market Value (US$ Million/Billion) by Country, 2022 to 2032

Figure 112: Oceania Market Value (US$ Million/Billion) Analysis by Country, 2017 to 2032

Figure 113: Oceania Market Volume (MT) Analysis by Country, 2017 to 2032

Figure 114: Oceania Market Value Share (%) and BPS Analysis by Country, 2022 to 2032

Figure 115: Oceania Market Y-o-Y Growth (%) Projections by Country, 2022 to 2032

Figure 116: Oceania Market Value (US$ Million/Billion) Analysis by Type, 2017 to 2032

Figure 117: Oceania Market Volume (MT) Analysis by Type, 2017 to 2032

Figure 118: Oceania Market Value Share (%) and BPS Analysis by Type, 2022 to 2032

Figure 119: Oceania Market Y-o-Y Growth (%) Projections by Type, 2022 to 2032

Figure 120: Oceania Market Value (US$ Million/Billion) Analysis by Sales Channel, 2017 to 2032

Figure 121: Oceania Market Volume (MT) Analysis by Sales Channel, 2017 to 2032

Figure 122: Oceania Market Value Share (%) and BPS Analysis by Sales Channel, 2022 to 2032

Figure 123: Oceania Market Y-o-Y Growth (%) Projections by Sales Channel, 2022 to 2032

Figure 124: Oceania Market Attractiveness by Type, 2022 to 2032

Figure 125: Oceania Market Attractiveness by Sales Channel, 2022 to 2032

Figure 126: Oceania Market Attractiveness by Country, 2022 to 2032

Figure 127: Middle East and Africa Market Value (US$ Million/Billion) by Type, 2022 to 2032

Figure 128: Middle East and Africa Market Value (US$ Million/Billion) by Sales Channel, 2022 to 2032

Figure 129: Middle East and Africa Market Value (US$ Million/Billion) by Country, 2022 to 2032

Figure 130: Middle East and Africa Market Value (US$ Million/Billion) Analysis by Country, 2017 to 2032

Figure 131: Middle East and Africa Market Volume (MT) Analysis by Country, 2017 to 2032

Figure 132: Middle East and Africa Market Value Share (%) and BPS Analysis by Country, 2022 to 2032

Figure 133: Middle East and Africa Market Y-o-Y Growth (%) Projections by Country, 2022 to 2032

Figure 134: Middle East and Africa Market Value (US$ Million/Billion) Analysis by Type, 2017 to 2032

Figure 135: Middle East and Africa Market Volume (MT) Analysis by Type, 2017 to 2032

Figure 136: Middle East and Africa Market Value Share (%) and BPS Analysis by Type, 2022 to 2032

Figure 137: Middle East and Africa Market Y-o-Y Growth (%) Projections by Type, 2022 to 2032

Figure 138: Middle East and Africa Market Value (US$ Million/Billion) Analysis by Sales Channel, 2017 to 2032

Figure 139: Middle East and Africa Market Volume (MT) Analysis by Sales Channel, 2017 to 2032

Figure 140: Middle East and Africa Market Value Share (%) and BPS Analysis by Sales Channel, 2022 to 2032

Figure 141: Middle East and Africa Market Y-o-Y Growth (%) Projections by Sales Channel, 2022 to 2032

Figure 142: Middle East and Africa Market Attractiveness by Type, 2022 to 2032

Figure 143: Middle East and Africa Market Attractiveness by Sales Channel, 2022 to 2032

Figure 144: Middle East and Africa Market Attractiveness by Country, 2022 to 2032

Recommendations

Food and Beverage

Cheese Color Market

Published : September 2023

Food and Beverage

Cheese Concentrates Market

Published : July 2023

Food and Beverage

Cheese Market

Published : February 2023

Explore Food and Beverage Insights

View Reports