Frozen Vegetable Market Size and Share Forecast Outlook 2025 to 2035

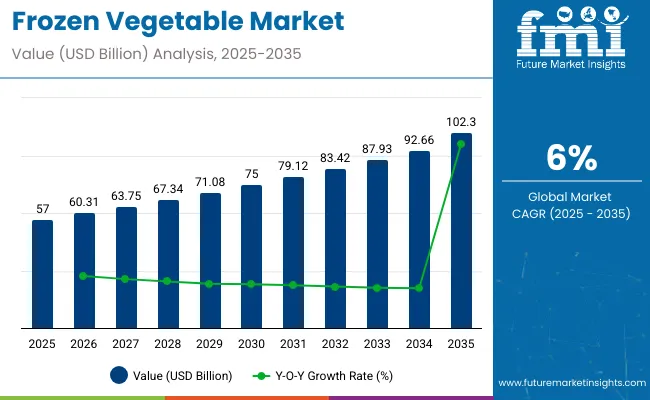
The global frozen vegetable market is projected to grow from USD 57 billion in 2025 to USD 102.3 billion by 2035, registering a CAGR of 6%. The market expansion is being driven by rising urbanization, busy lifestyles, and the growing demand for convenient, ready-to-cook food options.
Quick Stats for Frozen Vegetable Market

  • Market Value (2025): USD 57 billion
  • Forecast Value (2035): USD 102.3 billion
  • Forecast CAGR: 6%
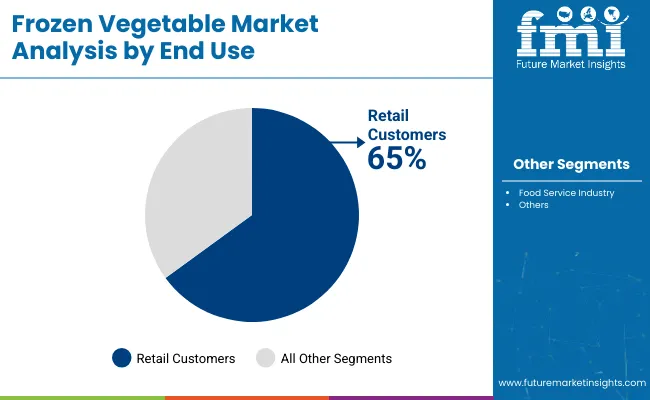
  • End User Leader in 2025: Retail Customers (65% market share)
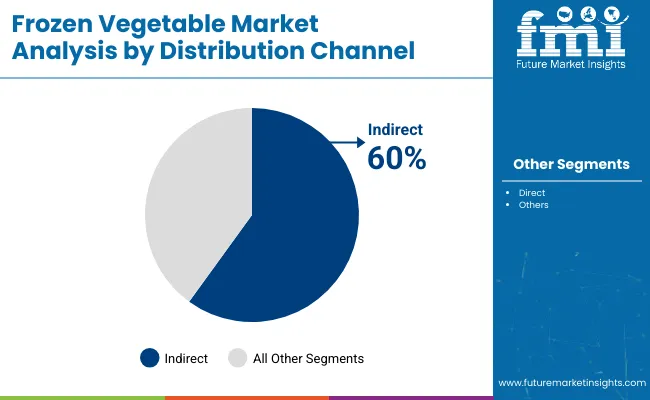
  • Top Distribution Channel Segment: Indirect (60% share)
  • Key Growth Region: East Asia (Japan is the fastest-growing market with a 6.1% CAGR)

Frozen Vegetable Market Industry Value Analysis

Metric Value
Industry Size (2025E) USD 57 billion
Industry Value (2035F) USD 102.3 billion
CAGR (2025 to 2035) 6%

Health-conscious consumer trends and the emphasis on nutrition retention are encouraging the adoption of frozen vegetables as viable alternatives to fresh produce. Technological advancements in freezing techniques, attractive packaging innovations, and improved cold chain logistics are enhancing product quality and shelf life, fostering broader market adoption across retail and food service sectors.

The market holds a significant share within its parent markets. It accounts for 25% of the global frozen food market, reflecting its staple status. Within the processed food market, it contributes nearly 5%, while in the broader packaged food market, its share is around 4% due to high retail penetration.

In the food and beverage market, frozen vegetables comprise roughly 1%, indicating niche yet steady growth. It holds a strong share in the frozen food segment (25%) and notable positions in processed and packaged food markets, though its footprint in the broader consumer products sector remains limited at under 0.1%.

Government regulations impacting the market focus on food safety standards, cold chain management, and nutrition labelling. The Food Safety and Standards (Food Products Standards and Food Additives) Regulations, 2011, and the Food Safety and Standards (Packaging and Labelling) Regulations, 2011 in India set strict norms for processing, packaging, and temperature control to ensure product quality and consumer safety.

Additionally, guidelines under the FSSAI mandate clear labelling of nutritional content and storage instructions for frozen vegetables, driving manufacturers to maintain compliance, improve operational practices, and ensure safer and healthier food choices for consumers.

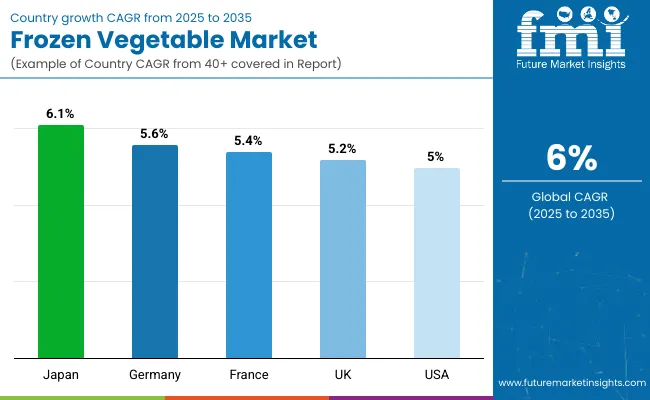
Japan is projected to be the fastest-growing market, expected to expand at a CAGR of 6.1% from 2025 to 2035. Retail customers will lead the end user segment with a 65% share, while indirectchannel will dominate the distribution channel segment with a 60% share. The UK and USA markets are also expected to grow steadily at CAGRs of 5.2% and 5%, respectively, while Germany and France will record CAGRs of 5.6% and 5.4%, respectively.

Analyzing Frozen Vegetable Market by Top Investment Segments

The market is segmented by product type, end user, distribution channel, and region. By product type, the market is divided into broccoli, green peas, asparagus, mushrooms, spinach, corn, green beans, and others (mixed vegetables, carrots, bell peppers, okra). In terms of end user, the market is bifurcated into the food service industry and retail customers.

Based on distribution channel, the market is bifurcated into direct and indirect (hypermarkets/supermarkets, convenience stores, grocery stores, online retailers, and other channels). Regionally, the market is classified into North America, Latin America, Western Europe, Eastern Europe, South Asia & Pacific, East Asia, and the Middle East & Africa.
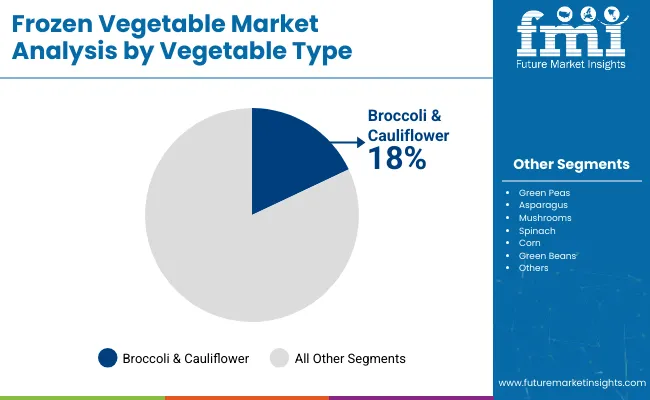
Broccoli to Lead the Product Type Segment with 18% Market Share

Broccoli is projected to lead the product type segment, capturing 18% of the market share by 2025. This vegetable remains a top choice among health-conscious consumers and food service menus.
  • Broccoli offers high nutritional value with vitamins, minerals, and fiber, aligning with consumer health trends.
  • Rising popularity of plant-based and vegan diets further drives broccoli demand in the frozen segment.

Frozen Vegetable Market Analysis By Product Type

Retail Customers to Capture End User Segment with 65% Market Share

Retail customers are expected to capture 65% of the market share by 2025, driven by rising urbanization, busy lifestyles, and increasing consumer preference for convenient, nutritious frozen vegetable options for home cooking and daily meals.
  • Growing urbanization and busy lifestyles are fueling demand for convenient, ready-to-cook frozen vegetables among households.
  • Availability of diverse frozen vegetable options at affordable prices encourages bulk buying by retail customers.

Frozen Vegetable Market Analysis By End User

Indirect Channel to Lead the Distribution Channel Segment with 60% Market Share

Indirect channel is projected to dominate the distribution channel segment with a 60% global market share by 2025, driven by wide product availability, strong retail presence, and consumer trust in quality and variety.

  • These stores offer extensive frozen food sections, wide product varieties, and attractive promotions, enhancing consumer purchase decisions.
  • Easy accessibility and trust in established retail chains continue to drive high sales volumes through this channel.

Frozen Vegetable Market Analysis By Distribution Channel

Top Frozen Vegetable Market Dynamics

The global frozen vegetable market is experiencing steady growth, driven by increasing urbanization, busy lifestyles, and rising demand for convenient, nutritious food options. Frozen vegetables play a crucial role in ensuring year-round availability of produce with minimal nutrient loss, catering to both retail consumers and the food service industry.
Recent Trends in the Frozen Vegetable Market

  • Rising popularity of plant-based diets and vegan lifestyles is boosting demand for frozen vegetables, especially broccoli, spinach, and mixed vegetable blends.
  • Technological advancements in flash freezing and packaging are enhancing nutrient retention, texture, and shelf life, increasing consumer confidence in frozen products.

Challenges in the Frozen Vegetable Market

  • Fluctuating availability and prices of raw vegetables due to climate change and agricultural uncertainties impact production and profit margins for manufacturers.
  • High operational costs for maintaining cold chain logistics and storage facilities pose barriers for smaller producers and retailers, limiting market penetration in certain regions.

Top Countries Producing, Processing, and Driving Demand for Frozen Vegetables

Japan momentum in the frozen vegetable market is driven by its aging population, high demand for convenience foods, and strong retail cold chain infrastructure. Germany and France maintain consistent demand driven by health-conscious consumers and the popularity of plant-based diets. In contrast, developed economies such as the USA (5% CAGR), UK (5.2%), and Japan (6.1%) are expected to expand at a steady 0.83-1.01x of the global growth rate.

Japan leads growth due to strong demand for convenient, premium-quality frozen vegetables catering to aging populations and busy professionals. Germany follows with steady expansion driven by health trends, organic product demand, and stringent EU labelling standards. France maintains similar growth, supported by national nutrition policies and preference for mixed vegetable blends in traditional cuisine.

UK growth is slightly slower, supported by rising veganism and health campaigns, though impacted by post-Brexit pricing adjustments. USA growth remains moderate, driven by health-conscious meal preparation and organic preferences, with strong retail promotions and private label offerings contributing to market value expansion.

The report covers an in-depth analysis of 40+ countries; five top-performing OECD countries are highlighted below.

In-depth Analysis of Frozen Vegetable Demand in Japan

The Japan frozen vegetable revenue is growing at a CAGR of 6.1% from 2025 to 2035. Growth is driven by demand for easy-to-prepare vegetables among aging populations and working professionals. As a technology-driven OECD economy, Japan prioritizes high-quality frozen produce with advanced packaging and extended shelf life.

  • High demand in retail meal solutions and bento offerings.
  • Preference for premium quality and innovative packaging.

Growth Outlook for Frozen Vegetable in Germany

Frozen vegetable sales in Germany are expected to expand at a 5.6% CAGR during the forecast period, slightly below the global average but strongly health-trend led. EU clean label goals, dietary shifts towards vegetarian meals, and sustainability standards are pushing adoption of frozen vegetables.

  • Strong EU compliance pressures in food labelling and quality.
  • Rising demand for organic frozen vegetable products.

Frozen Vegetable Demand in France

The French frozen vegetable market is projected to grow at a 5.4% CAGR during the forecast period, mirroring Germany in its health-conscious adoption trajectory. Demand is driven by national nutrition policies, consumer preference for convenience foods, and culinary tradition adaptations.

  • Mixed vegetable blends preferred for traditional dishes.
  • High adoption in hospitality, schools, and catering.

Demand Trajectory for Frozen Vegetable in the USA

The USA frozen vegetable market is projected to grow at 5% CAGR from 2025 to 2035, translating to 0.83x the global rate. Unlike emerging markets focused on price-driven consumption, USA demand is heavily tied to health trends, home cooking, and meal preparation practices.

  • Strong demand for organic and non-GMO frozen vegetables.
  • Retail promotions and meal prep trends fuel adoption.

Frozen Vegetable Trends in the UK

The UK frozen vegetable revenue is projected to grow at a CAGR of 5.2% from 2025 to 2035, representing slower growth among top OECD nations, at 0.87 times the global pace. Growth is supported by health campaigns and rising veganism in retail and food service industries. Post-Brexit import adjustments have slightly affected pricing structures.
  • Focus on vegan and plant-based frozen vegetable options.
  • Pricing adjustments post-Brexit influence import dynamics.

Leading Frozen Vegetable Suppliers and Manufacturers

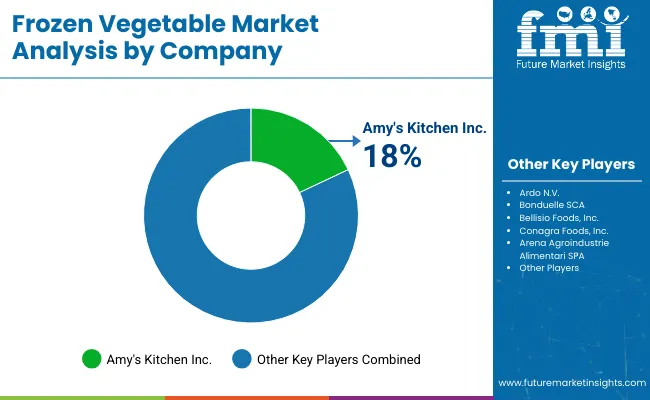
The market is moderately consolidated, with leading players like Nestle, Bonduelle SCA, Conagra Foods, Inc., General Mills Inc., and Ardo N.V. dominating the industry. These companies provide a wide range of high-quality frozen vegetables catering to retail consumers and the food service sector. Nestle focuses on premium frozen vegetable products with innovative packaging solutions, while Bonduelle SCA specializes in diverse frozen vegetable blends and ready-to-cook options.

Conagra Foods, Inc. delivers convenient, nutritious frozen vegetable meals under multiple brands. General Mills Inc. offers versatile frozen vegetable products catering to health-conscious consumers. Ardo N.V. is known for its extensive vegetable portfolio with sustainable sourcing practices.

Other key players like Amy's Kitchen, Inc., Bellisio Foods, Inc., Arena Agroindustrie Alimentari SPA, Findus Group, Goya Foods, Inc., H.J. Heinz Company, Iceland Foods Ltd, Kellogg Co., and B&G Foods, Inc. contribute by providing specialized, high-quality frozen vegetables for varied global culinary applications.

Frozen Vegetable Market Analysis By Company

Recent Frozen Vegetable Market Industry News

  • In September 2024, Green Giant launched twelve new frozen vegetable products, including Crispy Smashed Potatoes, Corn Cob Bites, Veggie Ramen, and Roasting Veggies, targeting consumers seeking convenient and affordable meal solutions.
  • In June 2024, Conagra Brands rolled out over 50 new frozen offerings, ranging from meals and vegetables to snacks, featuring gluten-free cookies, pretzels, Dolly Parton-inspired Southern dishes, and innovative side vegetable options.

Frozen Vegetable Market Report Scope

Report Attributes Details
Market Size (2025) USD 57 billion
Projected Market Size (2035) USD 102.3 billion
CAGR (2025 to 2035) 6%
Base Year for Estimation 2024
Historical Period 2020 to 2024
Projections Period 2025 to 2035
Report Parameter USD billion for value/kilotons for volume
Product Type Analyzed Broccoli, Green Peas, Asparagus, Mushrooms, Spinach, Corn, Green Beans, and Others (Mixed Vegetables, Carrots, Bell Peppers, and Okra)
End User Analyzed Food Service Industry, Retail Customers
Distribution Channel Analyzed Direct and Indirect (Hypermarkets/Supermarkets, Convenience Stores, Grocery Stores, Online Retailers, and Other Channels)
Regions Covered North America, Latin America, Western Europe, Eastern Europe, South Asia and Pacific, East Asia, Middle East and Africa
Countries Covered United States, United Kingdom, Germany, France, Japan, China, India, Brazil, South Korea, Australia
Key Players Influencing the Market Amy's Kitchen, Inc., Ardo N.V., Bonduelle SCA, Bellisio Foods, Inc., Conagra Foods, Inc., Arena Agroindustrie Alimentari SPA, Findus Group, Goya Foods, Inc., H.J. Heinz Company, Iceland Foods Ltd, General Mills Inc., Nestle, Kellogg Co., and B&G Foods, Inc.
Additional Attributes Dollar sales by product type, share by distribution channel, regional demand growth, policy influence, convenience trends, competitive benchmarking

Key Segmentation

By Vegetable Type:

  • Broccoli and cauliflower
  • Green Peas
  • Asparagus
  • Mushrooms
  • Spinach
  • Corn
  • Green Beans
  • Others

By Nature:

  • Organic
  • Conventional

By End Use:

  • Food Service Industry
  • Retail Customers

By Distribution Channel:

  • Direct
  • Indirect
    • Hypermarkets/Supermarkets
    • Convenience Stores
    • Grocery Stores
    • Online Retailers
    • Other Channels

By Region:

  • North America
  • Latin America
  • Europe
  • East Asia
  • South Asia
  • Oceania
  • Middle East and Africa

Table of Content

  1. Executive Summary
    • Global Market Outlook
    • Demand-side Trends
    • Supply-side Trends
    • Technology Roadmap Analysis
    • Analysis and Recommendations
  2. Market Overview
    • Market Coverage/Taxonomy
    • Market Definition/Scope/Limitations
  3. Market Background
    • Market Dynamics
      • Drivers
      • Restraints
      • Opportunity
      • Trends
    • Scenario Forecast
      • Demand in Optimistic Scenario
      • Demand in Likely Scenario
      • Demand in Conservative Scenario
    • Opportunity Map Analysis
    • Product Life Cycle Analysis
    • Supply Chain Analysis
      • Supply Side Participants and their Roles
        • Producers
        • Mid-Level Participants (Traders/ Agents/ Brokers)
        • Wholesalers and Distributors
      • Value Added and Value Created at Node in the Supply Chain
      • List of Raw Material Suppliers
      • List of Existing and Potential Buyer’s
    • Investment Feasibility Matrix
    • Value Chain Analysis
      • Profit Margin Analysis
      • Wholesalers and Distributors
      • Retailers
    • PESTLE and Porter’s Analysis
    • Regulatory Landscape
      • By Key Regions
      • By Key Countries
    • Regional Parent Market Outlook
    • Production and Consumption Statistics
    • Import and Export Statistics
  4. Global Market Analysis 2020 to 2024 and Forecast, 2025 to 2035
    • Historical Market Size Value (USD Billion) & Volume (Kilotons) Analysis, 2020 to 2024
    • Current and Future Market Size Value (USD Billion) & Volume (Kilotons) Projections, 2025 to 2035
      • Y-o-Y Growth Trend Analysis
      • Absolute $ Opportunity Analysis
  5. Global Market Pricing Analysis 2020 to 2024 and Forecast 2025 to 2035
  6. Global Market Analysis 2020 to 2024 and Forecast 2025 to 2035, By Product Type
    • Introduction/Key Findings
    • Historical Market Size Value (USD Billion) & Volume (Kilotons) Analysis By Product Type, 2020 to 2024
    • Current and Future Market Size Value (USD Billion) & Volume (Kilotons) Analysis and Forecast By Product Type, 2025 to 2035
      • Broccoli
      • Green Peas
      • Asparagus
      • Mushrooms
      • Spinach
      • Corn
      • Green Beans
      • others (Mixed Vegetables, Carrots, Bell Peppers, Okra)
    • Y-o-Y Growth Trend Analysis By Product Type, 2020 to 2024
    • Absolute $ Opportunity Analysis By Product Type, 2025 to 2035
  7. Global Market Analysis 2020 to 2024 and Forecast 2025 to 2035, By End User
    • Introduction/Key Findings
    • Historical Market Size Value (USD Billion) & Volume (Kilotons) Analysis By End User, 2020 to 2024
    • Current and Future Market Size Value (USD Billion) & Volume (Kilotons) Analysis and Forecast By End User, 2025 to 2035
      • Food Service Industry
      • Retail Customers
    • Y-o-Y Growth Trend Analysis By End User, 2020 to 2024
    • Absolute $ Opportunity Analysis By End User, 2025 to 2035
  8. Global Market Analysis 2020 to 2024 and Forecast 2025 to 2035, By Distribution Channel
    • Introduction/Key Findings
    • Historical Market Size Value (USD Billion) & Volume (Kilotons) Analysis By Distribution Channel, 2020 to 2024
    • Current and Future Market Size Value (USD Billion) & Volume (Kilotons) Analysis and Forecast By Distribution Channel, 2025 to 2035
      • Direct
      • Indirect
        • Hypermarkets/Supermarkets
        • Convenience Stores
        • Grocery Stores
        • Online Retailers
        • Other Channels
    • Y-o-Y Growth Trend Analysis By Distribution Channel, 2020 to 2024
    • Absolute $ Opportunity Analysis By Distribution Channel, 2025 to 2035
  9. Global Market Analysis 2020 to 2024 and Forecast 2025 to 2035, By Region
    • Introduction
    • Historical Market Size Value (USD Billion) & Volume (Kilotons) Analysis By Region, 2020 to 2024
    • Current Market Size Value (USD Billion) & Volume (Kilotons) Analysis and Forecast By Region, 2025 to 2035
      • North America
      • Latin America
      • Western Europe
      • Eastern Europe
      • East Asia
      • South Asia & Pacific
      • Middle East and Africa
    • Market Attractiveness Analysis By Region
  10. North America Market Analysis 2020 to 2024 and Forecast 2025 to 2035, By Country
    • Historical Market Size Value (USD Billion) & Volume (Kilotons) Trend Analysis By Market Taxonomy, 2020 to 2024
    • Market Size Value (USD Billion) & Volume (Kilotons) Forecast By Market Taxonomy, 2025 to 2035
      • By Country
        • USA
        • Canada
        • Mexico
      • By Product Type
      • By End User
      • By Distribution Channel
    • Market Attractiveness Analysis
      • By Country
      • By Product Type
      • By End User
      • By Distribution Channel
    • Key Takeaways
  11. Latin America Market Analysis 2020 to 2024 and Forecast 2025 to 2035, By Country
    • Historical Market Size Value (USD Billion) & Volume (Kilotons) Trend Analysis By Market Taxonomy, 2020 to 2024
    • Market Size Value (USD Billion) & Volume (Kilotons) Forecast By Market Taxonomy, 2025 to 2035
      • By Country
        • Brazil
        • Argentina
        • Rest of LATAM
      • By Product Type
      • By End User
      • By Distribution Channel
    • Market Attractiveness Analysis
      • By Country
      • By Product Type
      • By End User
      • By Distribution Channel
    • Key Takeaways
  12. Western Europe Market Analysis 2020 to 2024 and Forecast 2025 to 2035, By Country
    • Historical Market Size Value (USD Billion) & Volume (Kilotons) Trend Analysis By Market Taxonomy, 2020 to 2024
    • Market Size Value (USD Billion) & Volume (Kilotons) Forecast By Market Taxonomy, 2025 to 2035
      • By Country
        • Germany
        • Italy
        • France
        • UK
        • Spain
        • BENELUX
        • Nordic
        • Rest of W.Europe
      • By Product Type
      • By End User
      • By Distribution Channel
    • Market Attractiveness Analysis
      • By Country
      • By Product Type
      • By End User
      • By Distribution Channel
    • Key Takeaways
  13. Eastern Europe Market Analysis 2020 to 2024 and Forecast 2025 to 2035, By Country
    • Historical Market Size Value (USD Billion) & Volume (Kilotons) Trend Analysis By Market Taxonomy, 2020 to 2024
    • Market Size Value (USD Billion) & Volume (Kilotons) Forecast By Market Taxonomy, 2025 to 2035
      • By Country
        • Russia
        • Hungary
        • Poland
        • Balkan & Baltics
        • Rest of E. Europe
      • By Product Type
      • By End User
      • By Distribution Channel
    • Market Attractiveness Analysis
      • By Country
      • By Product Type
      • By End User
      • By Distribution Channel
    • Key Takeaways
  14. East Asia Market Analysis 2020 to 2024 and Forecast 2025 to 2035, By Country
    • Historical Market Size Value (USD Billion) & Volume (Kilotons) Trend Analysis By Market Taxonomy, 2020 to 2024
    • Market Size Value (USD Billion) & Volume (Kilotons) Forecast By Market Taxonomy, 2025 to 2035
      • By Country
        • China
        • Japan
        • South Korea
      • By Product Type
      • By End User
      • By Distribution Channel
    • Market Attractiveness Analysis
      • By Country
      • By Product Type
      • By End User
      • By Distribution Channel
    • Key Takeaways
  15. South Asia & Pacific Market Analysis 2020 to 2024 and Forecast 2025 to 2035, By Country
    • Historical Market Size Value (USD Billion) & Volume (Kilotons) Trend Analysis By Market Taxonomy, 2020 to 2024
    • Market Size Value (USD Billion) & Volume (Kilotons) Forecast By Market Taxonomy, 2025 to 2035
      • By Country
        • India
        • Australia & New Zealand
        • ASEAN
        • Rest of SAP
      • By Product Type
      • By End User
      • By Distribution Channel
    • Market Attractiveness Analysis
      • By Country
      • By Product Type
      • By End User
      • By Distribution Channel
    • Key Takeaways
  16. Middle East and Africa Market Analysis 2020 to 2024 and Forecast 2025 to 2035, By Country
    • Historical Market Size Value (USD Billion) & Volume (Kilotons) Trend Analysis By Market Taxonomy, 2020 to 2024
    • Market Size Value (USD Billion) & Volume (Kilotons) Forecast By Market Taxonomy, 2025 to 2035
      • By Country
        • GCC Countries
        • Northern Africa
        • South Africa
        • Turkiye
        • Rest of MEA
      • By Product Type
      • By End User
      • By Distribution Channel
    • Market Attractiveness Analysis
      • By Country
      • By Product Type
      • By End User
      • By Distribution Channel
    • Key Takeaways
  17. Key Countries Market Analysis
    • USA
      • Pricing Analysis
      • Market Share Analysis, 2024
        • By Product Type
        • By End User
        • By Distribution Channel
    • Canada
      • Pricing Analysis
      • Market Share Analysis, 2024
        • By Product Type
        • By End User
        • By Distribution Channel
    • Brazil
      • Pricing Analysis
      • Market Share Analysis, 2024
        • By Product Type
        • By End User
        • By Distribution Channel
    • Mexico
      • Pricing Analysis
      • Market Share Analysis, 2024
        • By Product Type
        • By End User
        • By Distribution Channel
    • Argentina
      • Pricing Analysis
      • Market Share Analysis, 2024
        • By Product Type
        • By End User
        • By Distribution Channel
  18. Market Structure Analysis
    • Competition Dashboard
    • Competition Benchmarking
    • Market Share Analysis of Top Players
      • By Regional
      • By Product Type
      • By End User
      • By Distribution Channel
  19. Competition Analysis
    • Competition Deep Dive
      • Amy's Kitchen, Inc.
        • Overview
        • Product Portfolio
        • Profitability by Market Segments (Product/Age /Sales Channel/Region)
        • Sales Footprint
        • Strategy Overview
          • Marketing Strategy
          • Product Strategy
          • Channel Strategy
      • Ardo N.V.
        • Overview
        • Product Portfolio
        • Profitability by Market Segments (Product/Age /Sales Channel/Region)
        • Sales Footprint
        • Strategy Overview
          • Marketing Strategy
          • Product Strategy
          • Channel Strategy
      • Bonduelle SCA
        • Overview
        • Product Portfolio
        • Profitability by Market Segments (Product/Age /Sales Channel/Region)
        • Sales Footprint
        • Strategy Overview
          • Marketing Strategy
          • Product Strategy
          • Channel Strategy
      • Bellisio Foods, Inc.
        • Overview
        • Product Portfolio
        • Profitability by Market Segments (Product/Age /Sales Channel/Region)
        • Sales Footprint
        • Strategy Overview
          • Marketing Strategy
          • Product Strategy
          • Channel Strategy
      • Conagra Foods, Inc.
        • Overview
        • Product Portfolio
        • Profitability by Market Segments (Product/Age /Sales Channel/Region)
        • Sales Footprint
        • Strategy Overview
          • Marketing Strategy
          • Product Strategy
          • Channel Strategy
      • Arena Agroindustrie Alimentari SPA
        • Overview
        • Product Portfolio
        • Profitability by Market Segments (Product/Age /Sales Channel/Region)
        • Sales Footprint
        • Strategy Overview
          • Marketing Strategy
          • Product Strategy
          • Channel Strategy
      • Findus Group
        • Overview
        • Product Portfolio
        • Profitability by Market Segments (Product/Age /Sales Channel/Region)
        • Sales Footprint
        • Strategy Overview
          • Marketing Strategy
          • Product Strategy
          • Channel Strategy
      • Goya Foods, Inc.
        • Overview
        • Product Portfolio
        • Profitability by Market Segments (Product/Age /Sales Channel/Region)
        • Sales Footprint
        • Strategy Overview
          • Marketing Strategy
          • Product Strategy
          • Channel Strategy
      • H.J. Heinz Company
        • Overview
        • Product Portfolio
        • Profitability by Market Segments (Product/Age /Sales Channel/Region)
        • Sales Footprint
        • Strategy Overview
          • Marketing Strategy
          • Product Strategy
          • Channel Strategy
      • Iceland Foods Ltd
        • Overview
        • Product Portfolio
        • Profitability by Market Segments (Product/Age /Sales Channel/Region)
        • Sales Footprint
        • Strategy Overview
          • Marketing Strategy
          • Product Strategy
          • Channel Strategy
      • General Mills Inc.
        • Overview
        • Product Portfolio
        • Profitability by Market Segments (Product/Age /Sales Channel/Region)
        • Sales Footprint
        • Strategy Overview
          • Marketing Strategy
          • Product Strategy
          • Channel Strategy
      • Nestle
        • Overview
        • Product Portfolio
        • Profitability by Market Segments (Product/Age /Sales Channel/Region)
        • Sales Footprint
        • Strategy Overview
          • Marketing Strategy
          • Product Strategy
          • Channel Strategy
      • Kellogg Co.
        • Overview
        • Product Portfolio
        • Profitability by Market Segments (Product/Age /Sales Channel/Region)
        • Sales Footprint
        • Strategy Overview
          • Marketing Strategy
          • Product Strategy
          • Channel Strategy
      • B&G Foods, Inc.
        • Overview
        • Product Portfolio
        • Profitability by Market Segments (Product/Age /Sales Channel/Region)
        • Sales Footprint
        • Strategy Overview
          • Marketing Strategy
          • Product Strategy
          • Channel Strategy
  20. Assumptions & Acronyms Used
  21. Research Methodology

List of Tables

  • Table 1: Global Market Value (USD Billion) Forecast by Region, 2020-2035
  • Table 2: Global Market Volume (Kilotons) Forecast by Region, 2020-2035
  • Table 3: Global Market Value (USD Billion) Forecast by Product Type, 2020-2035
  • Table 4: Global Market Volume (Kilotons) Forecast by Product Type, 2020-2035
  • Table 5: Global Market Value (USD Billion) Forecast by End User, 2020-2035
  • Table 6: Global Market Volume (Kilotons) Forecast by End User, 2020-2035
  • Table 7: Global Market Value (USD Billion) Forecast by Distribution Channel, 2020-2035
  • Table 8: Global Market Volume (Kilotons) Forecast by Distribution Channel, 2020-2035
  • Table 9: North America Market Value (USD Billion) Forecast by Country, 2020-2035
  • Table 10: North America Market Volume (Kilotons) Forecast by Country, 2020-2035
  • Table 11: North America Market Value (USD Billion) Forecast by Product Type, 2020-2035
  • Table 12: North America Market Volume (Kilotons) Forecast by Product Type, 2020-2035
  • Table 13: North America Market Value (USD Billion) Forecast by End User, 2020-2035
  • Table 14: North America Market Volume (Kilotons) Forecast by End User, 2020-2035
  • Table 15: North America Market Value (USD Billion) Forecast by Distribution Channel, 2020-2035
  • Table 16: North America Market Volume (Kilotons) Forecast by Distribution Channel, 2020-2035
  • Table 17: Latin America Market Value (USD Billion) Forecast by Country, 2020-2035
  • Table 18: Latin America Market Volume (Kilotons) Forecast by Country, 2020-2035
  • Table 19: Latin America Market Value (USD Billion) Forecast by Product Type, 2020-2035
  • Table 20: Latin America Market Volume (Kilotons) Forecast by Product Type, 2020-2035
  • Table 21: Latin America Market Value (USD Billion) Forecast by End User, 2020-2035
  • Table 22: Latin America Market Volume (Kilotons) Forecast by End User, 2020-2035
  • Table 23: Latin America Market Value (USD Billion) Forecast by Distribution Channel, 2020-2035
  • Table 24: Latin America Market Volume (Kilotons) Forecast by Distribution Channel, 2020-2035
  • Table 25: Western Europe Market Value (USD Billion) Forecast by Country, 2020-2035
  • Table 26: Western Europe Market Volume (Kilotons) Forecast by Country, 2020-2035
  • Table 27: Western Europe Market Value (USD Billion) Forecast by Product Type, 2020-2035
  • Table 28: Western Europe Market Volume (Kilotons) Forecast by Product Type, 2020-2035
  • Table 29: Western Europe Market Value (USD Billion) Forecast by End User, 2020-2035
  • Table 30: Western Europe Market Volume (Kilotons) Forecast by End User, 2020-2035
  • Table 31: Western Europe Market Value (USD Billion) Forecast by Distribution Channel, 2020-2035
  • Table 32: Western Europe Market Volume (Kilotons) Forecast by Distribution Channel, 2020-2035
  • Table 33: Eastern Europe Market Value (USD Billion) Forecast by Country, 2020-2035
  • Table 34: Eastern Europe Market Volume (Kilotons) Forecast by Country, 2020-2035
  • Table 35: Eastern Europe Market Value (USD Billion) Forecast by Product Type, 2020-2035
  • Table 36: Eastern Europe Market Volume (Kilotons) Forecast by Product Type, 2020-2035
  • Table 37: Eastern Europe Market Value (USD Billion) Forecast by End User, 2020-2035
  • Table 38: Eastern Europe Market Volume (Kilotons) Forecast by End User, 2020-2035
  • Table 39: Eastern Europe Market Value (USD Billion) Forecast by Distribution Channel, 2020-2035
  • Table 40: Eastern Europe Market Volume (Kilotons) Forecast by Distribution Channel, 2020-2035
  • Table 41: East Asia Market Value (USD Billion) Forecast by Country, 2020-2035
  • Table 42: East Asia Market Volume (Kilotons) Forecast by Country, 2020-2035
  • Table 43: East Asia Market Value (USD Billion) Forecast by Product Type, 2020-2035
  • Table 44: East Asia Market Volume (Kilotons) Forecast by Product Type, 2020-2035
  • Table 45: East Asia Market Value (USD Billion) Forecast by End User, 2020-2035
  • Table 46: East Asia Market Volume (Kilotons) Forecast by End User, 2020-2035
  • Table 47: East Asia Market Value (USD Billion) Forecast by Distribution Channel, 2020-2035
  • Table 48: East Asia Market Volume (Kilotons) Forecast by Distribution Channel, 2020-2035
  • Table 49: South Asia & Pacific Market Value (USD Billion) Forecast by Country, 2020-2035
  • Table 50: South Asia & Pacific Market Volume (Kilotons) Forecast by Country, 2020-2035
  • Table 51: South Asia & Pacific Market Value (USD Billion) Forecast by Product Type, 2020-2035
  • Table 52: South Asia & Pacific Market Volume (Kilotons) Forecast by Product Type, 2020-2035
  • Table 53: South Asia & Pacific Market Value (USD Billion) Forecast by End User, 2020-2035
  • Table 54: South Asia & Pacific Market Volume (Kilotons) Forecast by End User, 2020-2035
  • Table 55: South Asia & Pacific Market Value (USD Billion) Forecast by Distribution Channel, 2020-2035
  • Table 56: South Asia & Pacific Market Volume (Kilotons) Forecast by Distribution Channel, 2020-2035
  • Table 57: Middle East and Africa Market Value (USD Billion) Forecast by Country, 2020-2035
  • Table 58: Middle East and Africa Market Volume (Kilotons) Forecast by Country, 2020-2035
  • Table 59: Middle East and Africa Market Value (USD Billion) Forecast by Product Type, 2020-2035
  • Table 60: Middle East and Africa Market Volume (Kilotons) Forecast by Product Type, 2020-2035
  • Table 61: Middle East and Africa Market Value (USD Billion) Forecast by End User, 2020-2035
  • Table 62: Middle East and Africa Market Volume (Kilotons) Forecast by End User, 2020-2035
  • Table 63: Middle East and Africa Market Value (USD Billion) Forecast by Distribution Channel, 2020-2035
  • Table 64: Middle East and Africa Market Volume (Kilotons) Forecast by Distribution Channel, 2020-2035

List of Figures

  • Figure 1: Global Market Volume (Kilotons) Forecast 2020-2035
  • Figure 2: Global Market Pricing Analysis
  • Figure 3: Global Market Value (USD Billion) Forecast 2020-2035
  • Figure 4: Global Market Value Share and BPS Analysis by Product Type, 2025 and 2035
  • Figure 5: Global Market Y-o-Y Growth Comparison by Product Type, 2025-2035
  • Figure 6: Global Market Attractiveness Analysis by Product Type
  • Figure 7: Global Market Value Share and BPS Analysis by End User, 2025 and 2035
  • Figure 8: Global Market Y-o-Y Growth Comparison by End User, 2025-2035
  • Figure 9: Global Market Attractiveness Analysis by End User
  • Figure 10: Global Market Value Share and BPS Analysis by Distribution Channel, 2025 and 2035
  • Figure 11: Global Market Y-o-Y Growth Comparison by Distribution Channel, 2025-2035
  • Figure 12: Global Market Attractiveness Analysis by Distribution Channel
  • Figure 13: Global Market Value (USD Billion) Share and BPS Analysis by Region, 2025 and 2035
  • Figure 14: Global Market Y-o-Y Growth Comparison by Region, 2025-2035
  • Figure 15: Global Market Attractiveness Analysis by Region
  • Figure 16: North America Market Incremental $ Opportunity, 2025-2035
  • Figure 17: Latin America Market Incremental $ Opportunity, 2025-2035
  • Figure 18: Western Europe Market Incremental $ Opportunity, 2025-2035
  • Figure 19: Eastern Europe Market Incremental $ Opportunity, 2025-2035
  • Figure 20: East Asia Market Incremental $ Opportunity, 2025-2035
  • Figure 21: South Asia & Pacific Market Incremental $ Opportunity, 2025-2035
  • Figure 22: Middle East and Africa Market Incremental $ Opportunity, 2025-2035
  • Figure 23: North America Market Value Share and BPS Analysis by Country, 2025 and 2035
  • Figure 24: North America Market Value Share and BPS Analysis by Product Type, 2025 and 2035
  • Figure 25: North America Market Y-o-Y Growth Comparison by Product Type, 2025-2035
  • Figure 26: North America Market Attractiveness Analysis by Product Type
  • Figure 27: North America Market Value Share and BPS Analysis by End User, 2025 and 2035
  • Figure 28: North America Market Y-o-Y Growth Comparison by End User, 2025-2035
  • Figure 29: North America Market Attractiveness Analysis by End User
  • Figure 30: North America Market Value Share and BPS Analysis by Distribution Channel, 2025 and 2035
  • Figure 31: North America Market Y-o-Y Growth Comparison by Distribution Channel, 2025-2035
  • Figure 32: North America Market Attractiveness Analysis by Distribution Channel
  • Figure 33: Latin America Market Value Share and BPS Analysis by Country, 2025 and 2035
  • Figure 34: Latin America Market Value Share and BPS Analysis by Product Type, 2025 and 2035
  • Figure 35: Latin America Market Y-o-Y Growth Comparison by Product Type, 2025-2035
  • Figure 36: Latin America Market Attractiveness Analysis by Product Type
  • Figure 37: Latin America Market Value Share and BPS Analysis by End User, 2025 and 2035
  • Figure 38: Latin America Market Y-o-Y Growth Comparison by End User, 2025-2035
  • Figure 39: Latin America Market Attractiveness Analysis by End User
  • Figure 40: Latin America Market Value Share and BPS Analysis by Distribution Channel, 2025 and 2035
  • Figure 41: Latin America Market Y-o-Y Growth Comparison by Distribution Channel, 2025-2035
  • Figure 42: Latin America Market Attractiveness Analysis by Distribution Channel
  • Figure 43: Western Europe Market Value Share and BPS Analysis by Country, 2025 and 2035
  • Figure 44: Western Europe Market Value Share and BPS Analysis by Product Type, 2025 and 2035
  • Figure 45: Western Europe Market Y-o-Y Growth Comparison by Product Type, 2025-2035
  • Figure 46: Western Europe Market Attractiveness Analysis by Product Type
  • Figure 47: Western Europe Market Value Share and BPS Analysis by End User, 2025 and 2035
  • Figure 48: Western Europe Market Y-o-Y Growth Comparison by End User, 2025-2035
  • Figure 49: Western Europe Market Attractiveness Analysis by End User
  • Figure 50: Western Europe Market Value Share and BPS Analysis by Distribution Channel, 2025 and 2035
  • Figure 51: Western Europe Market Y-o-Y Growth Comparison by Distribution Channel, 2025-2035
  • Figure 52: Western Europe Market Attractiveness Analysis by Distribution Channel
  • Figure 53: Eastern Europe Market Value Share and BPS Analysis by Country, 2025 and 2035
  • Figure 54: Eastern Europe Market Value Share and BPS Analysis by Product Type, 2025 and 2035
  • Figure 55: Eastern Europe Market Y-o-Y Growth Comparison by Product Type, 2025-2035
  • Figure 56: Eastern Europe Market Attractiveness Analysis by Product Type
  • Figure 57: Eastern Europe Market Value Share and BPS Analysis by End User, 2025 and 2035
  • Figure 58: Eastern Europe Market Y-o-Y Growth Comparison by End User, 2025-2035
  • Figure 59: Eastern Europe Market Attractiveness Analysis by End User
  • Figure 60: Eastern Europe Market Value Share and BPS Analysis by Distribution Channel, 2025 and 2035
  • Figure 61: Eastern Europe Market Y-o-Y Growth Comparison by Distribution Channel, 2025-2035
  • Figure 62: Eastern Europe Market Attractiveness Analysis by Distribution Channel
  • Figure 63: East Asia Market Value Share and BPS Analysis by Country, 2025 and 2035
  • Figure 64: East Asia Market Value Share and BPS Analysis by Product Type, 2025 and 2035
  • Figure 65: East Asia Market Y-o-Y Growth Comparison by Product Type, 2025-2035
  • Figure 66: East Asia Market Attractiveness Analysis by Product Type
  • Figure 67: East Asia Market Value Share and BPS Analysis by End User, 2025 and 2035
  • Figure 68: East Asia Market Y-o-Y Growth Comparison by End User, 2025-2035
  • Figure 69: East Asia Market Attractiveness Analysis by End User
  • Figure 70: East Asia Market Value Share and BPS Analysis by Distribution Channel, 2025 and 2035
  • Figure 71: East Asia Market Y-o-Y Growth Comparison by Distribution Channel, 2025-2035
  • Figure 72: East Asia Market Attractiveness Analysis by Distribution Channel
  • Figure 73: South Asia & Pacific Market Value Share and BPS Analysis by Country, 2025 and 2035
  • Figure 74: South Asia & Pacific Market Value Share and BPS Analysis by Product Type, 2025 and 2035
  • Figure 75: South Asia & Pacific Market Y-o-Y Growth Comparison by Product Type, 2025-2035
  • Figure 76: South Asia & Pacific Market Attractiveness Analysis by Product Type
  • Figure 77: South Asia & Pacific Market Value Share and BPS Analysis by End User, 2025 and 2035
  • Figure 78: South Asia & Pacific Market Y-o-Y Growth Comparison by End User, 2025-2035
  • Figure 79: South Asia & Pacific Market Attractiveness Analysis by End User
  • Figure 80: South Asia & Pacific Market Value Share and BPS Analysis by Distribution Channel, 2025 and 2035
  • Figure 81: South Asia & Pacific Market Y-o-Y Growth Comparison by Distribution Channel, 2025-2035
  • Figure 82: South Asia & Pacific Market Attractiveness Analysis by Distribution Channel
  • Figure 83: Middle East and Africa Market Value Share and BPS Analysis by Country, 2025 and 2035
  • Figure 84: Middle East and Africa Market Value Share and BPS Analysis by Product Type, 2025 and 2035
  • Figure 85: Middle East and Africa Market Y-o-Y Growth Comparison by Product Type, 2025-2035
  • Figure 86: Middle East and Africa Market Attractiveness Analysis by Product Type
  • Figure 87: Middle East and Africa Market Value Share and BPS Analysis by End User, 2025 and 2035
  • Figure 88: Middle East and Africa Market Y-o-Y Growth Comparison by End User, 2025-2035
  • Figure 89: Middle East and Africa Market Attractiveness Analysis by End User
  • Figure 90: Middle East and Africa Market Value Share and BPS Analysis by Distribution Channel, 2025 and 2035
  • Figure 91: Middle East and Africa Market Y-o-Y Growth Comparison by Distribution Channel, 2025-2035
  • Figure 92: Middle East and Africa Market Attractiveness Analysis by Distribution Channel
  • Figure 93: Global Market - Tier Structure Analysis
  • Figure 94: Global Market - Company Share Analysis

Frequently Asked Questions

What is the projected size of the frozen vegetable market in 2025?

The market is valued at USD 57 billion in 2025.

What is the outlook on frozen vegetable demand by 2035?

The market is forecasted to reach USD 102.3 billion by 2035, reflecting a CAGR of 6%.

Which segment leads the frozen vegetable market by end user in 2025?

Retail customers will lead the end user segment, accounting for 65% of the global market share in 2025.

What is the top distribution channel for the frozen vegetable market in 2025?

Indirect channel will dominate the distribution channel segment with a 60% share in 2025.

Which country is projected to have the fastest-growing frozen vegetable market?

Japan is projected to grow at the fastest rate, with a CAGR of 6.1% from 2025 to 2035.

Explore Similar Insights

Future Market Insights

Frozen Vegetable Market