Frozen Ready Meal Market
Market Insights on Frozen Ready Meal covering sales outlook, demand forecast & up-to-date key trends
Frozen Ready Meal Market By Product Type (Vegetarian Meals, Chicken Meals, Beef Meals), End User (Food Chain Services, Modern Trade, Departmental Stores, Online Stores) & Region - Forecast 2022 - 2032
Frozen Ready Meal Market Overview
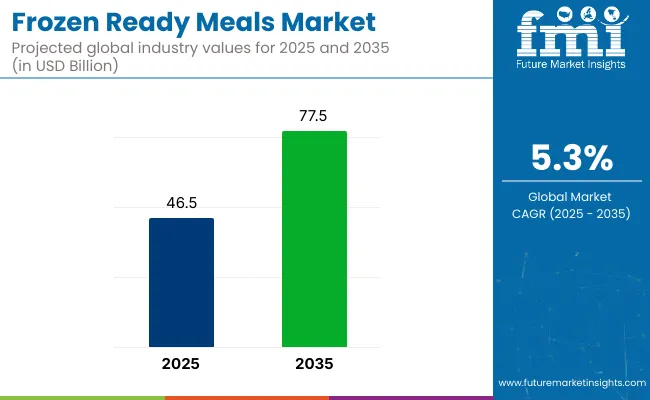
[350 Pages Report] The global frozen ready meals market size is estimated to be USD 40.8 Bn in the year 2022 that is expected to grow at a CAGR of 8.2% to reach USD 89.7 Bn by the year 2032. APEJ market holds great potential for the frozen ready meals market as it is estimated to hold nearly 45% market share by the year 2022.
Attribute |
Details |
Market Size Value in 2021 |
USD 38.1 Bn |
Market Forecast Value in 2032 |
USD 89.7 Bn |
Global Growth Rate |
8.2% |
Forecast Period |
2022-2032 |
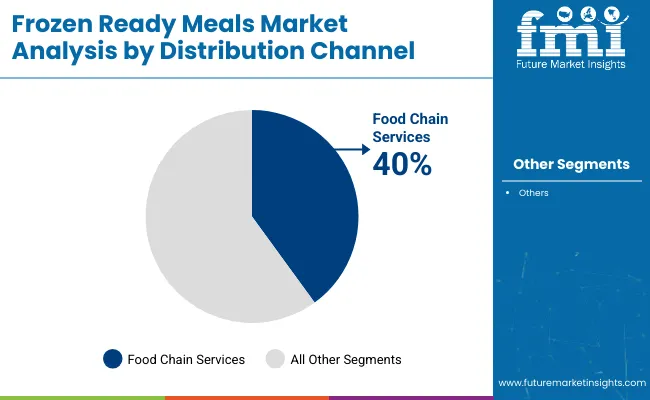
During the period 2017-2021, revenue from the food chain service segment is estimated to hold nearly 36% of the global market. According to the FMI report, demand from departmental stores increased by 5.3% between 2020 and 2021.
According to the study, General Mills, Nestle S.A., Dr Oetker GmbH, McCain Foods Ltd., Conagra Brands, Inc., Atkins Nutritionals, Inc., California Pizza Kitchen, Connies Pizza, H.J. Heinz, Daiya Foods Inc., FRoSTA AG are identified as key frozen ready meal manufacturers.
During the assessment period of 2022-2032, the Asia Pacific excluding Japan frozen ready meal market is expected to grow at a lucrative growth rate of 4.7%. In terms of product type segment of frozen ready meal market, frozen chicken and frozen snacks collectively accounted for more than 60% of the global market in 2022.
Let us know your requirement to get
100% FREE customization
How The Market Progressed Till June 2022?
Particulars |
Details |
H1 2021 |
8.1% |
H1 2022 Projected |
8.2% |
H1 2022 Expected |
9.0% |
BPS Change |
- 90.2 ↓ |
FMI presents a half-yearly comparison analysis and review of the market growth rates and further development prospects in the global market. The market is predominantly influenced by certain demographic and innovation factors under the subjective impact of macro and industry factors.
Some new developments that have taken place in these markets include:
- A rise in convenience patterns, as well as a simultaneous increase in need for customised meal options, has resulted in strong desire for frozen packed meals.
- The frozen food and beverage industry is perceived as a yet another shop for consumers on the go, with everything from frozen desserts to appetisers and meals available.
- Frozen packaged food manufacturers are now incorporating nutrient advantages alongside taste to appeal to a broader clientele seeking health and flavour.
The global market for Frozen Ready Meal has witnessed H1 2021 growth at the magnitude of 8.1%. However, this growth is not evenly spread across all regions, with the developing markets recording higher growth rates of 9.0%. Thus, leaving the gap of -90.2 BPS points between expected and projected growth during H1 2022.
Key reasons for this change in growth rate are attributed to slow/rapid uptake of the market during the first half of the forecast period owing to improving end-user demand in key economies and their booming populations.
In particular, China and India are both seeing an increase in their consumption pattern, resulting in increased demand for the Frozen Ready Meal market. Additionally, many other market segments are expected to perform fairly and attain promising growth prospects in the next half of the projection period.
Despite these positive prospects, there are some likely challenges that stay ahead for the industry including a shift in consumer preferences, stringent trade barriers, and a low degree of security in raw material supply, and other manufacturing inputs.
Moving Beyond the Traditional Cooking Model with Frozen Ready Meals
Ready-to-eat food has become one of the biggest versatile segments in the global ready meals market in recent years. Strong demand for frozen packaged foods has emerged from a rise of convenience trends and a parallel growth in demand for specific meal solutions. The frozen sector of the food and beverage industry is seen as a one-stop destination for customers out and about, offering anything from frozen sweets to appetisers and meals.
Frozen ready meals haven't always been popular, owing to their limited shelf life and greater price over fast food. The market is predicted to develop from leaps and bounds as developments in cold storage facilities infrastructure and increased investments by discount retailers in frozen ready meals shelves popularise the product.
Impact of Covid-19 Outbreak on the Demand of Frozen Ready Meal Market
Frozen ready meals are in demand in developed nations because of their microbiological and fungal-free properties. Companies in the frozen packaged food sector are currently adding nutrient benefits along with flavour to appeal to a wider demographic area seeking wellness and flavour.
During the covid-19 outbreak, a large number of the population became more concerned about their health. Therefore, people are more cautious about what they eat. The danger of increased blood pressure continues since frozen ready meals include a significant concentration of preservatives and salt. The use of additive preservatives to extend the life of grocery items may operate against the frozen ready meal market's usual sales cycle.
Covid-19 pandemic outbreak benefited the frozen ready meal business due to its ease. Since many bachelors were confined towards their houses and residences, bachelors had to rely on quick and prepared meals to sustain life. Diners and other outlets were closed due to covid lockdown and social distancing conventions, which increased the market demand for frozen ready meals.
For the frozen ready meal market, the post-coronavirus scenario is anticipated to bring mixed feelings. Marketers must consider consumer views, which demand high quality and reasonable price along with low health risk factors in frozen ready meals. As a result, businesses are seeing organic and gluten-free foods with storage facilities as practical solutions for reducing the number of additive preservatives in their food items.
Aside from that, the inclusion of other foods and meals in a frozen state, such as appetisers, breakfasts, lunch, supper, refreshments, and more, is gaining traction among consumers with a busy lifestyle. Overall, during the forecast period, the frozen ready meal economy is predicted to rise at a stable pace.
Find your sweet spots for generating winning opportunities in this market.
Talk to AnalystChanging Lifestyles is Laying the Foundations for the Frozen Ready Meal Market to Expand
Frozen convenience foods have come such a long way based on product options and quality. Progressive urbanisation in various countries, improved life span and frozen packaged food, advancements in innovation to preserve frozen or partially prepared food, and significant changes in the retail market all bode well for market participants in the foreseeable future.
According to a recent analysis from Future Market Insights, the frozen ready meal market will be worth over USD 89.7 Billion by 2032.
Even though frozen ready meals are still seen as a distant second to fresh food, producers are unlocking the code to attract customers to the refrigerated section by using clearer labelling. Companies are concentrating on correcting the frozen food stigma with healthier meal alternatives, as well as boosting 'convenient' status, as customers' curiosity regarding food and its sourcing grows.
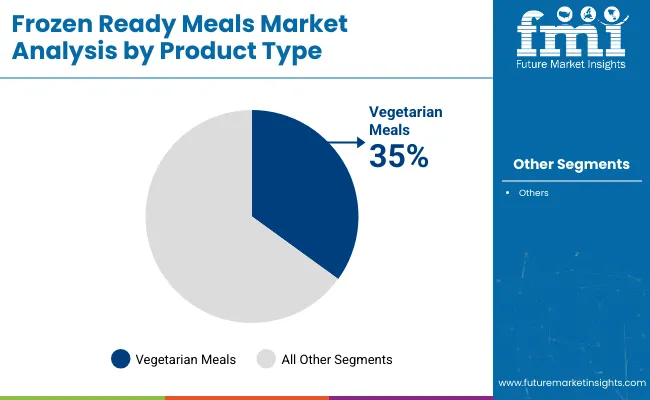
Vegetarian meals are gaining a lot of traction in Frozen Ready Meal Market
Frozen chicken food continues to contribute significantly to producers' profits. Concerns regarding animal protection and the impact on the environment of livestock farming have fuelled the emergence of veganism and the vegetarian movement. As a result, producers are seeking to increase the production of frozen vegetarian dishes to profit from the growing number of consumers who prefer plant-based foods.
Aside from comfort and efficiency, research has shown that frozen ready meals contain the same or more essential minerals than fresh food, which has sparked the interest of consumers who like entirely fresh food.

A unified Market Research Subscription Platform, built for today's disparate research needs.
Services in the Food Chain Frozen Ready Meals to propel the market
Frozen convenience foods sold through food supply chain companies continue to account for a significant portion of revenue. Additional revenue share is projected soon as convenience stores expand their frozen ready meal selection and internet sales tap into untapped market prospects.
Frozen ready meals are becoming increasingly popular in industrialised countries, where levels of consumption are higher than in other countries. The rise in the number of people working in emerging nations like China and India, as well as the tendency for longer and variable working time, has resulted in a progressive movement away from the conventional paradigm of daily cooking.
As a result, frozen ready meals are expected to expand in popularity in these countries.
Preference for Ready-to-Eat Organic Foods to Boost the Market
Customers have learned to appreciate cuisine that provides them with functional value in addition to taste, increasing consumption of healthy, organic, and clean ready meals. Such organic produce alternatives are having a favourable impact on the industry's growth.
To prevent negative health effects, more customers are carefully picking their ready meals as a result of increased health knowledge and worries about food safety. Furthermore, natural ready meals derive a significant portion of their worth from customer trust and the belief that the items are nutritious.
Because of their ease and mobility, convenience foods are becoming increasingly popular in the packaged food sector. Furthermore, natural convenience foods are gaining popularity because they are proven natural items that may be used to replace a full meal, and it is healthier than standard ready meals due to component packing.
Recent Trends and Developments in the Market
Campbell Soup Co: In the year 2018, the company has announced a comprehensive restructuring that will provide a stronger position to the company, benefiting from the quickly changing foodservice market. Campbell's primary business activities including its key soups, precooked meals, including shelf-stable drink portfolios, as well as its significant snacking portfolio, are now organised under this new organisation.
Conagra Brands: In the year 2019, the company came into an acquisition with Pinnacle foods. Conagra Brands might benefit from Pinnacle's acquisition of specialist gluten-free confectionery brands such as Udi's and Glutino. The firm is combining two catalogues with business growth to create a USD 12 billion corporation with iconic brands within frozen, snacks, refrigerated food, and supermarket sectors with this acquisition.
McCain: In the year 2018, the company came into a partnership with Forno de Minas which is a leading cheese brand. In this acquisition, McCain acquired a 49% share of Forno de Minas.
Scope Of Report
Attribute |
Details |
Market Size Value in 2021 |
USD 38.1 Bn |
Market Forecast Value in 2032 |
USD 89.7 Bn |
Global Growth Rate |
8.2% |
Forecast Period |
2022-2032 |
Historical Data Available for |
2017-2021 |
Market Analysis |
MT for Volume and USD Mn for Value |
Key Regions Covered |
Product Type, End-user, Region |
Key Countries Covered |
United States, Canada, Brazil, Mexico, Argentina, EU5, Russia, Poland, China, ASEAN, Australia and New Zealand, Japan, GCC countries, Ethiopia, North Africa, South Africa, others. |
Key Market Segments Covered |
Product Type, End-User and Region |
Key Companies Profiled |
|
Pricing |
Available upon Request |
Segments Covered in Frozen Ready Meal Market Analysis
Product Type:
- Vegetarian Meals
- Chicken Meals
- Beef Meals
- Other Meals
End-User:
- Food Chain Services
- Modern Trade
- Departmental Stores
- Online Stores
- Other Distribution Channel
Region:
- North America
- Latin America
- Europe
- Japan
- APEJ
- MEA
Frequently Asked Questions
Currently Frozen Ready Meal market is worth more than USD 40.8 Bn.
Frozen ready meal market consumption is expected to grow at a CAGR of around 8.2% during the period 2022-2032.
In terms of revenue, the frozen ready meal market grew at a CAGR of around 4.2% during 2017-2021
The global frozen ready meal market is forecasted to surpass USD 89.7 Bn by the end of 2032.
General Mills, Nestle S.A., Dr Oetker GmbH, McCain Foods Ltd., Conagra Brands, Inc., Atkins Nutritionals, Inc., California Pizza Kitchen, Connies Pizza, H.J. Heinz, Daiya Foods Inc., FRoSTA AG are expected to be the top players driving the market growth.
Market players are focusing on new product launches, frozen ready meal distribution channels, and merger & acquisition strategies to remain a prominent player in the global market.
The Asia Pacific, the U.S., and Europe are the major countries driving demand for frozen ready meal markets.
Europe holds around 25.2% of the total frozen ready meal revenue share.
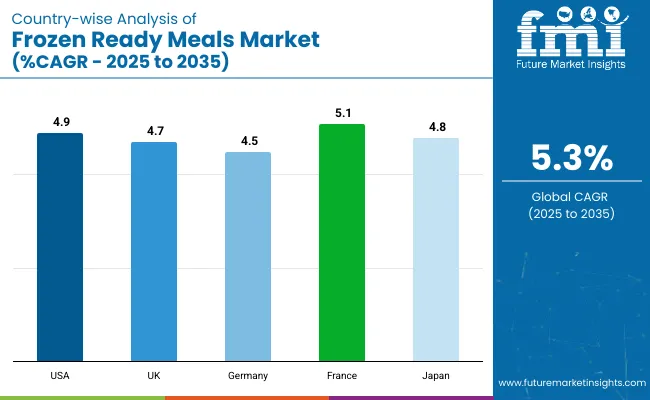
U.S. frozen ready meal market is projected to grow at a CAGR of around 5.4% over the next ten years.
Table of Content
1. Market Overview
1.1. Market Coverage / Taxonomy
1.2. Market Definition / Scope / Limitations
2. The Massive Impact of the Crisis
2.1. Global Market Forecast Scenario Comparison of Annual Growth Rates for short Term (2022-2026) and Long Term (2027-2032)
2.1.1. Optimistic Scenario
2.1.1.1. China
2.1.1.2. US
2.1.1.3. India
2.1.1.4. Euro Zone
2.1.1.5. Asia Pacific
2.1.1.6. Rest of the World
2.1.2. Likely Scenario
2.1.2.1. China
2.1.2.2. US
2.1.2.3. India
2.1.2.4. Euro Zone
2.1.2.5. Asia Pacific
2.1.2.6. Rest of the World
2.1.3. Pessimistic Scenario
2.1.3.1. China
2.1.3.2. US
2.1.3.3. India
2.1.3.4. Euro Zone
2.1.3.5. Asia Pacific
2.1.3.6. Rest of the World
2.2. Key Factors Impacting the Market
2.3. Note: Market Assessment shall be Provided for Likely Scenario
3. Market Dynamics
3.1. Drivers
3.1.1. Supply Side Drivers
3.1.2. Demand Side drivers
3.1.3. Economic Side Drivers
3.2. Restraints
3.3. Opportunity
3.4. Market trends By Region
3.5. Product Launches
3.6. Product Claims & Nutritional Information Scan by Buyers
3.7. Macro-Economic Factors
3.8. Forecast Factors - Relevance & Impact
3.9. Consumers Survey Analysis
4. Key Regulations
4.1. Packaging & Labelling Regulations
4.2. Certifications and Certifying Agency Overview
4.3. Import/Export Policies
5. Global Market Demand Analysis 2017-2021 and Forecast, 2022-2032
5.1. Historical Market Volume (Metric Tons) Analysis, 2017-2021
5.2. Current and Future Market Volume (Metric Tons) Projections, 2022-2032
5.3. Y-o-Y Growth Trend Analysis
6. Global Market - Pricing Analysis
6.1. Regional Pricing Analysis (USD/Metric Tons) By Product Type (2017,2022,2032)
6.1.1. Vegetarian Meals
6.1.2. Chicken Meals
6.1.3. Beef Meals
6.1.4. Other Meals
6.2. Pricing Break-up (2017,2022,2032)
6.2.1. Producer Level Pricing
6.2.2. Distributor Level Pricing
6.2.3. Retailer Level Pricing
6.3. Global Average Pricing Analysis Benchmark
7. Global Market Demand (Size in USD Mn) Analysis 2017-2021 and Forecast, 2022-2032
7.1. Historical Market Value (USD Mn) Analysis, 2017-2021
7.2. Current and Future Market Value (USD Mn) Projections, 2022-2032
7.2.1. Y-o-Y Growth Trend Analysis
7.2.2. Absolute $ Opportunity Analysis
8. Global Market Analysis 2017-2021 and Forecast 2022-2032, By Product Type
8.1. Introduction / Key Findings
8.2. Historical Market Size (USD Mn) and Volume Analysis By Product Type, 2017 - 2021
8.3. Current and Future Market Size (USD Mn) and Volume Analysis and Forecast By Product Type, 2022-2032
8.3.1. Vegeterian Meals
8.3.2. Chicken Meals
8.3.3. Beef Meals
8.3.4. Other Meals
8.4. Market Attractiveness Analysis By Product Type
9. Global Market Analysis 2017-2021 and Forecast 2022-2032, By End User
9.1. Introduction / Key Findings
9.2. Historical Market Size (USD Mn) and Volume Analysis By End User, 2017 - 2021
9.3. Current and Future Market Size (USD Mn) and Volume Analysis and Forecast By End User, 2022-2032
9.3.1. Food Chain Services
9.3.2. Modern Trade
9.3.3. Departmental Stores
9.3.4. Online Stores
9.3.5. Other Distribution Channel
9.4. Market Attractiveness Analysis By End User
10. Global Market Analysis 2017-2021 and Forecast 2022-2032, By Region
10.1. Introduction
10.2. Historical Market Size (USD Mn) and Volume Analysis By Region, 2017 - 2021
10.3. Current Market Size (USD Mn) and Volume Analysis and Forecast By Region, 2022-2032
10.3.1. North America
10.3.2. Latin America
10.3.3. Europe
10.3.4. APEJ
10.3.5. Japan
10.3.6. MEA
10.4. Market Attractiveness Analysis By Region
11. North America Market Analysis 2017-2021 and Forecast 2022-2032
11.1. Introduction
11.2. Pricing Analysis
11.3. Historical Market Size (USD Mn) and Volume Trend Analysis By Market Taxonomy, 2017 - 2021
11.4. Market Size (USD Mn) and Volume Forecast By Market Taxonomy, 2021 - 2031
11.4.1. By Country
11.4.1.1. U.S.
11.4.1.2. Canada
11.4.2. By Product Type
11.4.3. By End user
11.5. Market Attractiveness Analysis
11.5.1. By Product Type
11.5.2. By End user
11.6. Market Trends
11.7. Key Market Participants - Intensity Mapping
11.8. Drivers and Restraints - Impact Analysis
12. Latin America Market Analysis 2017-2021 and Forecast 2022-2032
12.1. Introduction
12.2. Pricing Analysis
12.3. Historical Market Size (USD Mn) and Volume Trend Analysis By Market Taxonomy, 2017 - 2021
12.4. Market Size (USD Mn) and Volume Forecast By Market Taxonomy, 2021 - 2031
12.4.1. By Country
12.4.1.1. Brazil
12.4.1.2. Mexico
12.4.1.3. Argentina
12.4.1.4. Rest of Latin America
12.4.2. By Product Type
12.4.3. By End user
12.5. Market Attractiveness Analysis
12.5.1. By Product Type
12.5.2. By End user
12.6. Market Trends
12.7. Key Market Participants - Intensity Mapping
12.8. Drivers and Restraints - Impact Analysis
13. Western Europe Market Analysis 2017-2021 and Forecast 2022-2032
13.1. Introduction
13.2. Pricing Analysis
13.3. Historical Market Size (USD Mn) and Volume Trend Analysis By Market Taxonomy, 2017 - 2021
13.4. Market Size (USD Mn) and Volume Forecast By Market Taxonomy, 2021 - 2031
13.4.1. By Country
13.4.1.1. Germany
13.4.1.2. U.K
13.4.1.3. France
13.4.1.4. Italy
13.4.1.5. Spain
13.4.1.6. Rest of Europe
13.4.2. By Product Type
13.4.3. By End user
13.5. Market Attractiveness Analysis
13.5.1. By Product Type
13.5.2. By End user
13.6. Market Trends
13.7. Key Market Participants - Intensity Mapping
13.8. Drivers and Restraints - Impact Analysis
14. APEJ Market Analysis 2017-2021 and Forecast 2022-2032
14.1. Introduction
14.2. Pricing Analysis
14.3. Historical Market Size (USD Mn) and Volume Trend Analysis By Market Taxonomy, 2017 - 2021
14.4. Market Size (USD Mn) and Volume Forecast By Market Taxonomy, 2021 - 2031
14.4.1. By Country
14.4.1.1. China
14.4.1.2. India
14.4.1.3. Australia & New Zealand
14.4.1.4. ASEAN
14.4.1.5. Rest of APAC
14.4.2. By Product Type
14.4.3. By End user
14.5. Market Attractiveness Analysis
14.5.1. By Product Type
14.5.2. By End user
14.6. Market Trends
14.7. Key Market Participants - Intensity Mapping
14.8. Drivers and Restraints - Impact Analysis
15. Japan Market Analysis 2017-2021 and Forecast 2022-2032
15.1. Introduction
15.2. Pricing Analysis
15.3. Historical Market Size (USD Mn) and Volume Trend Analysis By Market Taxonomy, 2017 - 2021
15.4. Market Size (USD Mn) and Volume Forecast By Market Taxonomy, 2021 - 2031
15.4.1. By Country
15.4.1.1. Japan
15.4.2. By Product Type
15.4.3. By End user
15.5. Market Attractiveness Analysis
15.5.1. By Product Type
15.5.2. By End user
15.6. Market Trends
15.7. Key Market Participants - Intensity Mapping
15.8. Drivers and Restraints - Impact Analysis
16. Middle East and Africa Market Analysis 2017-2021 and Forecast 2022-2032
16.1. Introduction
16.2. Pricing Analysis
16.3. Historical Market Size (USD Mn) and Volume Trend Analysis By Market Taxonomy, 2017 - 2021
16.4. Market Size (USD Mn) and Volume Forecast By Market Taxonomy, 2021 - 2031
16.4.1. By Country
16.4.1.1. GCC Countries,
16.4.1.2. North Africa
16.4.1.3. South Africa
16.4.1.4. Turkey
16.4.1.5. Israel
16.4.1.6. Rest of MEA
16.4.2. By Product Type
16.4.3. By End user
16.5. Market Attractiveness Analysis
16.5.1. By Product Type
16.5.2. By End user
16.6. Market Trends
16.7. Key Market Participants - Intensity Mapping
16.8. Drivers and Restraints - Impact Analysis
17. Key Countries Market Analysis 2017–2021 and Forecast 2022–2032
17.1. U.S.
17.1.1. Pricing Analysis (2017, 2022, 2032)
17.1.2. Market Value and Volume Analysis 2017–2021 and Forecast 2022–2032
17.1.2.1. By Product Type
17.1.2.2. By End User
17.2. Canada
17.2.1. Pricing Analysis (2017, 2022, 2032)
17.2.2. Market Value and Volume Analysis 2017–2021 and Forecast 2022–2032
17.2.2.1. By Product Type
17.2.2.2. By End User
17.3. Brazil
17.3.1. Pricing Analysis (2017, 2022, 2032)
17.3.2. Market Value and Volume Analysis 2017–2021 and Forecast 2022–2032
17.3.2.1. By Product Type
17.3.2.2. By End User
17.4. Argentina
17.4.1. Pricing Analysis (2017, 2022, 2032)
17.4.2. Market Value and Volume Analysis 2017–2021 and Forecast 2022–2032
17.4.2.1. By Product Type
17.4.2.2. By End User
17.4.2.3.
17.5. Mexico
17.5.1. Pricing Analysis (2017, 2022, 2032)
17.5.2. Market Value and Volume Analysis 2017–2021 and Forecast 2022–2032
17.5.2.1. By Product Type
17.5.2.2. By End User
17.6. Germany
17.6.1. Pricing Analysis (2017, 2022, 2032)
17.6.2. Market Value and Volume Analysis 2017–2021 and Forecast 2022–2032
17.6.2.1. By Product Type
17.6.2.2. By End User
17.7. U.K
17.7.1. Pricing Analysis (2017, 2022, 2032)
17.7.2. Market Value and Volume Analysis 2017–2021 and Forecast 2022–2032
17.7.2.1. By Product Type
17.7.2.2. By End User
17.8. France
17.8.1. Pricing Analysis (2017, 2022, 2032)
17.8.2. Market Value and Volume Analysis 2017–2021 and Forecast 2022–2032
17.8.2.1. By Product Type
17.8.2.2. By End User
17.9. Italy
17.9.1. Pricing Analysis (2017, 2022, 2032)
17.9.2. Market Value and Volume Analysis 2017–2021 and Forecast 2022–2032
17.9.2.1. By Product Type
17.9.2.2. By End User
17.10. Spain
17.10.1. Pricing Analysis (2017, 2022, 2032)
17.10.2. Market Value and Volume Analysis 2017–2021 and Forecast 2022–2032
17.10.2.1. By Product Type
17.10.2.2. By End User
17.11. China
17.11.1. Pricing Analysis (2017, 2022, 2032)
17.11.2. Market Value and Volume Analysis 2017–2021 and Forecast 2022–2032
17.11.2.1. By Product Type
17.11.2.2. By End User
17.12. India
17.12.1. Pricing Analysis (2017, 2022, 2032)
17.12.2. Market Value and Volume Analysis 2017–2021 and Forecast 2022–2032
17.12.2.1. By Product Type
17.12.2.2. By End User
17.13. AN&Z
17.13.1. Pricing Analysis (2017, 2022, 2032)
17.13.2. Market Value and Volume Analysis 2017–2021 and Forecast 2022–2032
17.13.2.1. By Product Type
17.13.2.2. By End User
17.14. ASEAN
17.14.1. Pricing Analysis (2017, 2022, 2032)
17.14.2. Market Value and Volume Analysis 2017–2021 and Forecast 2022–2032
17.14.2.1. By Product Type
17.14.2.2. By End User
17.15. Japan
17.15.1. Pricing Analysis (2017, 2022, 2032)
17.15.2. Market Value and Volume Analysis 2017–2021 and Forecast 2022–2032
17.15.2.1. By Product Type
17.15.2.2. By End User
17.16. GCC Countries
17.16.1. Pricing Analysis (2017, 2022, 2032)
17.16.2. Market Value and Volume Analysis 2017–2021 and Forecast 2022–2032
17.16.2.1. By Product Type
17.16.2.2. By End User
17.17. North Africa
17.17.1. Pricing Analysis (2017, 2022, 2032)
17.17.2. Market Value and Volume Analysis 2017–2021 and Forecast 2022–2032
17.17.2.1. By Product Type
17.17.2.2. By End User
17.18. South Africa
17.18.1. Pricing Analysis (2017, 2022, 2032)
17.18.2. Market Value and Volume Analysis 2017–2021 and Forecast 2022–2032
17.18.2.1. By Product Type
17.18.2.2. By End User
17.19. Turkey
17.19.1. Pricing Analysis (2017, 2022, 2032)
17.19.2. Market Value and Volume Analysis 2017–2021 and Forecast 2022–2032
17.19.2.1. By Product Type
17.19.2.2. By End User
17.20. Israel
17.20.1. Pricing Analysis (2017, 2022, 2032)
17.20.2. Market Value and Volume Analysis 2017–2021 and Forecast 2022–2032
17.20.2.1. By Product Type
17.20.2.2. By End User
18. Market Structure Analysis
18.1. Market Analysis by Tier of Companies
18.2. Company Share Analysis of Top Players
18.2.1. By Product Type
18.3. Market Presence Analysis
18.3.1. By Regional Footprint of Players
18.3.2. Product Footprint by Players
18.3.3. Channel Footprint by Players
19. Competition Analysis
19.1. Competition Dashboard
19.2. Competition Deep Dive (Tentative List)
19.2.1. H.J. Heinz
19.2.1.1. Overview
19.2.1.2. Product Portfolio
19.2.1.3. Profitability by Market Segments (Product/Channel/Region)
19.2.1.4. Sales Footprint
19.2.1.5. Strategy Overview
19.2.1.5.1. Marketing Strategy
19.2.1.5.2. Product Strategy
19.2.2. General Mills
19.2.2.1. Overview
19.2.2.2. Product Portfolio
19.2.2.3. Profitability by Market Segments (Product/Channel/Region)
19.2.2.4. Sales Footprint
19.2.2.5. Strategy Overview
19.2.2.5.1. Marketing Strategy
19.2.2.5.2. Product Strategy
19.2.3. Nestle S.A.
19.2.3.1. Overview
19.2.3.2. Product Portfolio
19.2.3.3. Profitability by Market Segments (Product/Channel/Region)
19.2.3.4. Sales Footprint
19.2.3.5. Strategy Overview
19.2.3.5.1. Marketing Strategy
19.2.3.5.2. Product Strategy
19.2.4. McCain Foods Ltd.
19.2.4.1. Overview
19.2.4.2. Product Portfolio
19.2.4.3. Profitability by Market Segments (Product/Channel/Region)
19.2.4.4. Sales Footprint
19.2.4.5. Strategy Overview
19.2.4.5.1. Marketing Strategy
19.2.4.5.2. Product Strategy
19.2.5. Dr. Oetker GmbH
19.2.5.1. Overview
19.2.5.2. Product Portfolio
19.2.5.3. Profitability by Market Segments (Product/Channel/Region)
19.2.5.4. Sales Footprint
19.2.5.5. Strategy Overview
19.2.5.5.1. Marketing Strategy
19.2.5.5.2. Product Strategy
19.2.6. Daiya Foods Inc.
19.2.6.1. Overview
19.2.6.2. Product Portfolio
19.2.6.3. Profitability by Market Segments (Product/Channel/Region)
19.2.6.4. Sales Footprint
19.2.6.5. Strategy Overview
19.2.6.5.1. Marketing Strategy
19.2.6.5.2. Product Strategy
19.2.7. Connies Pizza
19.2.7.1. Overview
19.2.7.2. Product Portfolio
19.2.7.3. Profitability by Market Segments (Product/Channel/Region)
19.2.7.4. Sales Footprint
19.2.7.5. Strategy Overview
19.2.7.5.1. Marketing Strategy
19.2.7.5.2. Product Strategy
19.2.8. Conagra Brands, Inc.
19.2.8.1. Overview
19.2.8.2. Product Portfolio
19.2.8.3. Profitability by Market Segments (Product/Channel/Region)
19.2.8.4. Sales Footprint
19.2.8.5. Strategy Overview
19.2.8.5.1. Marketing Strategy
19.2.8.5.2. Product Strategy
19.2.9. Atkins Nutritionals, Inc.
19.2.9.1. Overview
19.2.9.2. Product Portfolio
19.2.9.3. Profitability by Market Segments (Product/Channel/Region)
19.2.9.4. Sales Footprint
19.2.9.5. Strategy Overview
19.2.9.5.1. Marketing Strategy
19.2.9.5.2. Product Strategy
19.2.10. California Pizza Kitchen
19.2.10.1. Overview
19.2.10.2. Product Portfolio
19.2.10.3. Profitability by Market Segments (Product/Channel/Region)
19.2.10.4. Sales Footprint
19.2.10.5. Strategy Overview
19.2.10.5.1. Marketing Strategy
19.2.10.5.2. Product Strategy
19.2.11. Other Players (On Additional Requests)
19.2.11.1. Overview
19.2.11.2. Product Portfolio
19.2.11.3. Profitability by Market Segments (Product/Channel/Region)
19.2.11.4. Sales Footprint
19.2.11.5. Strategy Overview
19.2.11.5.1. Marketing Strategy
19.2.11.5.2. Product Strategy
20. Value Chain Analysis
20.1. Operating margins at each node of supply chain
20.2. List of Active Market Participants
20.2.1. Product Manufacturers
20.2.2. Key Brands
21. Assumptions and Acronyms Used
22. Research Methodology
Let us know your requirement to get
100% FREE customization
List of Tables
Table 1: Global Market Value (USD Mn), 2017-2021
Table 2: Global Market Value (USD Mn), 2022-2032
Table 3: Global Market Value (USD Mn) and Y-o-Y, 2017-2032
Table 4: Global Market Value Share (USD Mn), By Product Type 2022-2032
Table 5: Global Market Attractiveness (USD Mn), By Product Type 2022-2032
Table 6: Global Market Value Share (USD Mn), By End User 2022-2032
Table 7: Global Market Attractiveness (USD Mn), By End User, 2022-2032
Table 8: Global Market Value Share (USD Mn), By Region, 2022-2032
Table 9: Global Market Attractiveness (USD Mn), By Region, 2022-2032
Table 10: Global Market Value (USD Mn) and Y-o-Y,By Region, 2017-2032
Table 11: North America Market Value (USD Mn), By Country 2017-2021
Table 12: North America Market Value (USD Mn), By Country 2022-2032
Table 13: North America Market Value (USD Mn), By Product Type 2017-2021
Table 14: North America Market Value (USD Mn), By Product Type 2017-2021
Table 15: North America Market Value (USD Mn), By Product Type 2022-2032
Table 16: North America Market Value (USD Mn), By End User 2017-2021
Table 17: North America Market Value (USD Mn), By End User 2022-2032
Table 18: Latin America Market Value (USD Mn), By Country 2017-2021
Table 19: Latin America Market Value (USD Mn), By Country 2022-2032
Table 20: Latin America Market Value (USD Mn), By Product Type 2017-2021
Table 21: Latin America Market Value (USD Mn), By Product Type 2022-2032
Table 22: Latin America Market Value (USD Mn), By End User 2017-2021
Table 23: Latin America Market Value (USD Mn), By End User 2022-2032
Table 24: Europe Market Value (USD Mn), By Country 2017-2021
Table 25: Europe Market Value (USD Mn), By Country 2022-2032
Table 26: Europe Market Value (USD Mn), By Product Type 2017-2021
Table 27: Europe Market Value (USD Mn), By Product Type 2022-2032
Table 28: Europe Market Value (USD Mn), By End User 2017-2021
Table 29: Europe Market Value (USD Mn), By End User 2022-2032
Table 30: Japan Market Value (USD Mn), By Product Type 2017-2021
Table 31: Japan Market Value (USD Mn), By Product Type 2022-2032
Table 32: Japan Market Value (USD Mn), By End User 2017-2021
Table 33: Japan Market Value (USD Mn), By End User 2022-2032
Table 34: APEJ Market Value (USD Mn), By Country 2017-2021
Table 35: APEJ Market Value (USD Mn), By Country 2022-2032
Table 36: APEJ Market Value (USD Mn), By Product Type 2017-2021
Table 37: APEJ Market Value (USD Mn), By Product Type 2022-2032
Table 38: APEJ Market Value (USD Mn), By End User 2017-2021
Table 39: APEJ Market Value (USD Mn), By End User 2022-2032
Table 40: MEA Market Value (USD Mn), By Country 2017-2021
Table 41: MEA Market Value (USD Mn), By Country 2022-2032
Table 42: MEA Market Value (USD Mn), By Product Type 2017-2021
Table 43: MEA Market Value (USD Mn), By Product Type 2022-2032
Table 44: MEA Market Value (USD Mn), By End User 2017-2021
Table 45: MEA Market Value (USD Mn), By End User 2022-2032
Find your sweet spots for generating winning opportunities in this market.
Talk to AnalystList of Charts
Figure 1: Global Market Value (USD Mn), 2017-2021
Figure 2: Global Market Value (USD Mn) Forecast, 2021-2032
Figure 3: Global Market Value (USD Mn) and Y-o-Y, 2017-2032
Figure 4: Global Vegetarian Meals Segment Market Value (USD Mn) By Region, 2017-2021
Figure 5: Global Vegetarian Meals Segment Market Value (USD Mn) By Region, 2021-2032
Figure 6: Global Vegetarian Meals Segment Y-o-Y Growth Rate, By Region, 2017-2032
Figure 7: Global Chicken Meals Segment Market Value (USD Mn) By Region, 2017-2021
Figure 8: Global Chicken Meals Segment Market Value (USD Mn) By Region, 2021-2032
Figure 9: Global Chicken Meals Segment Y-o-Y Growth Rate, By Region, 2017-2032
Figure 10: Global Beef Meals Segment Market Value (USD Mn) By Region, 2017-2021
Figure 11: Global Beef Meals Segment Market Value (USD Mn) By Region, 2021-2032
Figure 12: Global Beef Meals Segment Y-o-Y Growth Rate, By Region, 2017-2032
Figure 13: Global Other Meals Segment Market Value (USD Mn) By Region, 2017-2021
Figure 14: Global Other Meals Segment Market Value (USD Mn) By Region, 2021-2032
Figure 15: Global Other Meals Segment Y-o-Y Growth Rate, By Region, 2017-2032
Figure 16: Global Food Chain Services Segment Market Value (USD Mn) By Region, 2017-2021
Figure 17: Global Food Chain Services Segment Market Value (USD Mn) By Region, 2021-2032
Figure 18: Global Food Chain Services Segment Y-o-Y Growth Rate, By Region, 2017-2032
Figure 19: Global Modern Trade Segment Market Value (USD Mn) By Region, 2017-2021
Figure 20: Global Modern Trade Segment Market Value (USD Mn) By Region, 2021-2032
Figure 21: Global Modern Trade Segment Y-o-Y Growth Rate, By Region, 2017-2032
Figure 22: Global Departmental Stores Segment Market Value (USD Mn) By Region, 2017-2021
Figure 23: Global Departmental Stores Segment Market Value (USD Mn) By Region, 2021-2032
Figure 24: Global Departmental Stores Segment Y-o-Y Growth Rate, By Region, 2017-2032
Figure 25: Global Online Stores Segment Market Value (USD Mn) By Region, 2017-2021
Figure 26: Global Online Stores Segment Market Value (USD Mn) By Region, 2021-2032
Figure 27: Global Online Stores Segment Y-o-Y Growth Rate, By Region, 2017-2032
Figure 28: Global Other Distribution Channel Segment Market Value (USD Mn) By Region, 2017-2021
Figure 29: Global Other Distribution Channel Segment Market Value (USD Mn) By Region, 2021-2032
Figure 30: Global Other Distribution Channel Segment Y-o-Y Growth Rate, By Region, 2017-2032
Figure 31: North America Market Value (USD Mn), By Country 2017-2021
Figure 32: North America Market Value (USD Mn), By Country 2021-2032
Figure 33: North America Market Value (USD Mn), By Product Type 2017-2021
Figure 34: North America Market Value (USD Mn), By Product Type 2021-2032
Figure 35: North America Market Value (USD Mn), By End User 2017-2021
Figure 36: North America Market Value (USD Mn), By End User 2021-2032
Figure 37: Latin America Market Value (USD Mn), By Country 2017-2021
Figure 38: Latin America Market Value (USD Mn), By Country 2021-2032
Figure 39: Latin America Market Value (USD Mn), By Product Type 2017-2021
Figure 40: Latin America Market Value (USD Mn), By Product Type 2021-2032
Figure 41: Latin America Market Value (USD Mn), By End User 2017-2021
Figure 42: Latin America Market Value (USD Mn), By End User 2021-2032
Figure 43: Europe Market Value (USD Mn), By Country 2017-2021
Figure 44: Europe Market Value (USD Mn), By Country 2021-2032
Figure 45: Europe Market Value (USD Mn), By Product Type 2017-2021
Figure 46: Europe Market Value (USD Mn), By Product Type 2021-2032
Figure 47: Europe Market Value (USD Mn), By End User 2017-2021
Figure 48: Europe Market Value (USD Mn), By End User 2021-2032
Figure 49: Japan Market Value (USD Mn), By Country 2017-2021
Figure 50: Japan Market Value (USD Mn), By Country 2021-2032
Figure 51: Japan Market Value (USD Mn), By Product Type 2017-2021
Figure 52: Japan Market Value (USD Mn), By Product Type 2021-2032
Figure 53: Japan Market Value (USD Mn), By 2017-2021
Figure 54: Japan Market Value (USD Mn), By End User 2021-2032
Figure 55: APEJ Market Value (USD Mn), By Country 2017-2021
Figure 56: APEJ Market Value (USD Mn), By Country 2021-2032
Figure 57: APEJ Market Value (USD Mn), By Product Type 2017-2021
Figure 58: APEJ Market Value (USD Mn), By Product Type 2021-2032
Figure 59: APEJ Market Value (USD Mn), By End User 2017-2021
Figure 60: APEJ Market Value (USD Mn), By End User 2021-2032
Figure 61: MEA Market Value (USD Mn), By Country 2017-2021
Figure 62: MEA Market Value (USD Mn), By Country 2021-2032
Figure 63: MEA Market Value (USD Mn), By Product Type 2017-2021
Figure 64: MEA Market Value (USD Mn), By Product Type 2021-2032
Figure 65: MEA Market Value (USD Mn), By End User 2017-2021
Figure 66: MEA Market Value (USD Mn), By End User 2021-2032
Need specific information?
Request CustomizationExplore Food and Beverage Insights
View Reports