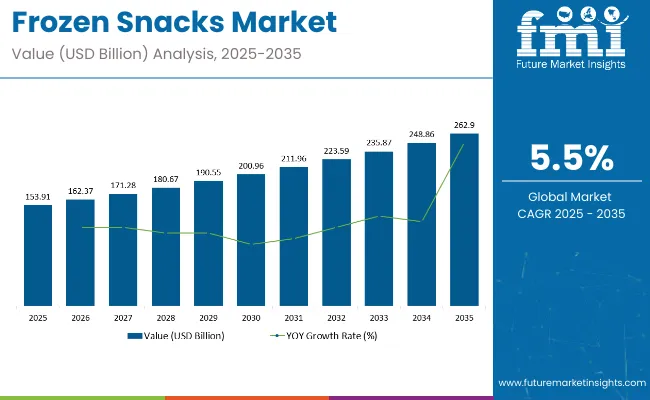
The global frozen snacks market is projected to grow from USD 153.91 billion in 2025 to approximately USD 262.90 billion by 2035, reflecting a CAGR of 5.5%. This growth is driven by an increasing demand for convenient, ready-to-eat snack options, particularly among consumers with busy lifestyles.
Frozen snacks like mini pizzas, fries, and appetizers are gaining popularity due to their ease of preparation, long shelf life, and ability to cater to consumer preferences for quick and indulgent meals. Additionally, the trend of "snackification," where consumers prefer smaller, bite-sized meals throughout the day, is further fueling the market expansion.
Nestlé has capitalized on this shift in consumer preferences, reporting a significant increase in its market share within the frozen foods sector, supported by strong sales in portioned coffee and ambient culinary products. In its 2025 food trend report, Nestlé identified key trends such as global and spicy flavors, "newstalgia," and the rise of "little treat culture," which reflects the growing desire for indulgent, nostalgic, and shareable snack options. These trends align with the increasing popularity of frozen snacks, as consumers seek convenient options that are both comforting and satisfying.
Conagra Brands has introduced more than 50 new frozen food products, including Southern-inspired meals in collaboration with Dolly Parton, such as Shrimp & Grits and Chicken & Dumplings. The company is also focusing on "snackification," offering mini and bite-sized foods like empanadas and tacos, catering to the rising demand for snacking between meals.
Ajinomoto Co., Inc. is expanding its frozen food offerings in Japan and Singapore, focusing on popular products like Gyoza and Karaage, capitalizing on the growing interest in Japanese cuisine. Additionally, McCain Foods launched an innovative hybrid potato product with flavors like Salt & Vinegar and Firecracker Chilli. McCain is also committed to sustainability, partnering with the Sustainable Markets Initiative to promote regenerative farming practices globally, ensuring a more sustainable supply chain.
The global frozen snacks market is marked by a dynamic trade flow, with certain countries leading in both the export and import of frozen snacks. Exporting nations typically have strong food processing industries and well-developed supply chains, while importing countries often have high consumer demand for convenience foods or limited domestic production capacity.
Per capita consumer spending on frozen snacks has shown significant growth, particularly in developed economies, as consumers continue to prioritize convenience and ready-to-eat food options. The shift towards healthier frozen snack choices has further boosted this market, with spending rising steadily in both retail and foodservice sectors.
The frozen snacks market is projected to experience significant growth, driven by key segments such as frozen ready meals and ready-to-eat categories. Frozen ready meals are expected to dominate the product type segment, while ready-to-eat options will continue to lead the category segment. These segments are expected to play a crucial role in the market’s expansion, as demand for convenient, quick meals continues to rise.
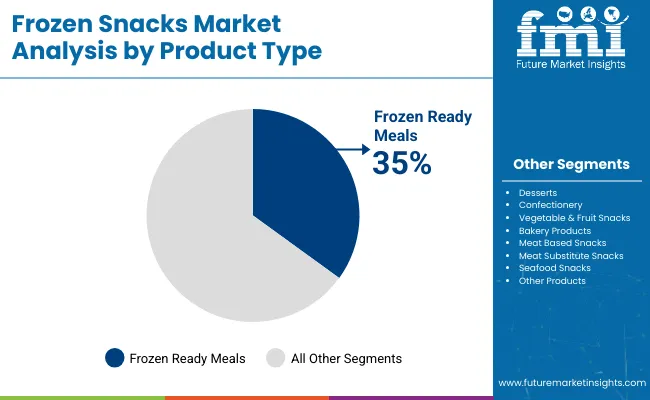
Frozen ready meals are expected to capture 35% of the market share in 2025. These meals are becoming increasingly popular due to their convenience, affordability, and ability to provide a wide variety of cuisines. Consumers are looking for easy meal solutions that require little preparation and can be quickly heated, making frozen ready meals an essential part of modern lifestyles.
Leading companies like Nestlé, Conagra Brands, and Tyson Foods have been offering a broad range of frozen ready meals, catering to diverse consumer preferences. These meals include everything from traditional comfort foods to healthier options, catering to the rising demand for nutritious, easy-to-prepare meals.
As the pace of life accelerates and more consumers turn to time-saving meal options, the demand for frozen ready meals is expected to continue growing. The frozen ready meal segment is set to remain dominant in the frozen snacks market as it meets the increasing consumer demand for convenience without compromising on quality or taste.
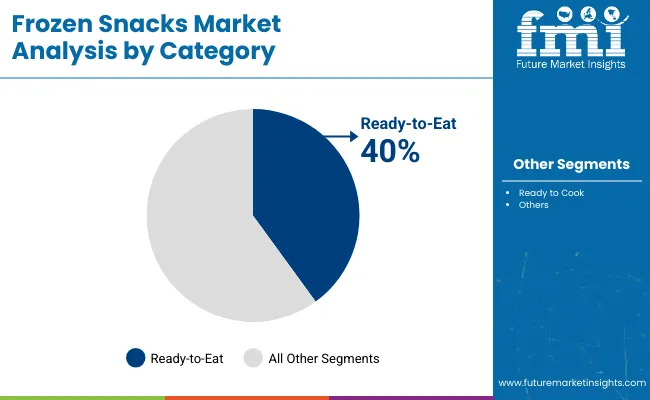
The ready-to-eat category is projected to capture 40% of the market share by 2025. Ready-to-eat frozen snacks, including items like frozen pizzas, sandwiches, and snack-sized portions of meals, are increasingly being sought by consumers who prioritize convenience without sacrificing quality. These products require little to no preparation, making them ideal for busy individuals or families looking for quick meal solutions.
Companies such as McCain Foods, Amy’s Kitchen, and Pinnacle Foods are key players in the ready-to-eat frozen snacks market, offering a range of products that cater to different dietary needs and preferences. The increasing demand for portable, easy-to-consume meals, coupled with the growing trend of snacking throughout the day, is driving the growth of the ready-to-eat category.
Additionally, the introduction of innovative products with improved taste, texture, and nutritional value has further fueled the expansion of this segment. As consumer preferences continue to shift toward quick, accessible food options, ready-to-eat frozen snacks will maintain their dominant share in the market.
There are certain challenges in the frozen snack market that are mainly the results of supply chain disruption, impacting cold storage, transportation, and ingredients sourcing. Overall profitability will also be affected by raw material availability fluctuations and rising energy costs for the freezing and storage process. Health concerns are another major challenge where consumers are increasingly aware of artificial preservatives, the high sodium and Tran’s fat content in processed frozen snacks, leading to the demand for clean-label, organic, and low-calorie alternatives.
On top of that, sustainability concerns around packaging waste, carbon-heavy freezing techniques, and food waste management are pushing businesses toward sustainable packages, environmentally friendly freezing solutions and supply chain transparency initiatives.
Even though this frozen snack market faces many challenges, we can expect a lot of growth as the demand for plant-based snacks, innovations in premium frozen food, and artificial intelligence-based smart packaging solutions increases. Rising demand for vegan, gluten-free and high-protein frozen snacks is creating new opportunities in the market.
Moreover, the upsurge in premium frozen snacks with gourmet flavor profiles, ethnic cuisine variants, and organic ingredients is adding to the acceptance of frozen snacks among health-conscious and convenience-led consumers. Advancements in these technologies, combined with the integration of smart packaging technologies (like QR codes for tracking freshness or AI-driven expiration monitoring) are also contributing to consumer trust and product safety.
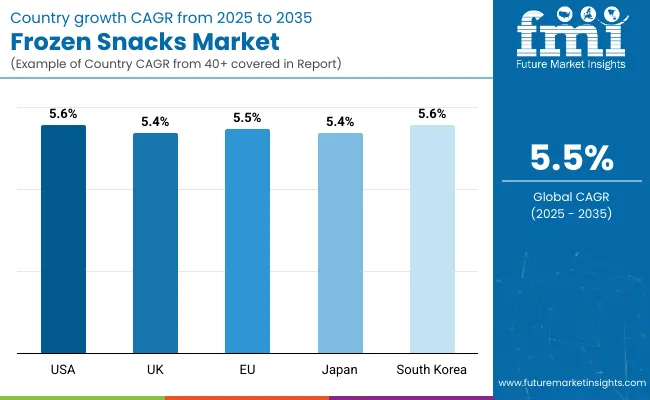
The USA frozen snack market is on a threshold of growth with the rising demand for convenience foods, ready-to-eat (RTE) nutrition bars and plant-based frozen products among consumers. Healthier snacking, clean-label frozen products, and a wider range of premium frozen snacks are driving growth. Moreover, the rise of e-commerce and direct-to-consumer (DTC) frozen food delivery services is restructuring the landscape of purchasing.
| Country | CAGR (2025 to 2035) |
|---|---|
| USA | 5.6% |
The frozen snack market in the United Kingdom is growing with increasing demand for frozen bakery products, vegetarian & vegan snacks, and high-end frozen finger foods. The micro market of frozen foods is also enriching with the increase in plant-based/found-free frozen snacks system along with creativity in the microwave oven microwave oven & PSH wriggle. Supermarket private labels and sustainable packaging initiatives are also helping to shape industry trends.
| Country | CAGR (2025 to 2035) |
|---|---|
| UK | 5.4% |
The frozen snack market in the European Union has been thriving as consumers gravitate towards healthier frozen foods, high protein snacks, and organic frozen finger foods across the region. Increasing usage of low-fat, gluten-free and high-fiber frozen snacks is driving demand. Moreover, EU regulations accelerating sustainable and recyclable frozen food packaging are boosting up the market growth.
| Region | CAGR (2025 to 2035) |
|---|---|
| European Union (EU) | 5.5% |
Japan frozen snack market is expected to grow at a moderate pace. Because of that, the demand for sushi, rice snacks, and authentic Japanese frozen snack market around the world is on the raise. Moreover, new techniques in quick freezing are enhancing the flavor and feel of frozen goods, increasing their attractiveness to customers.
| Country | CAGR (2025 to 2035) |
|---|---|
| Japan | 5.4% |
Rising consumption of frozen dumplings, Korean-style frozen street foods as well as fusion snacks is gifting a growth to the frozen snack market in South Korea. Market growth is further driven by the increasing preference for Korean snacks-by consumers in various countries and healthy online grocery sales and food delivery platforms. The growing demand for premium, organic and low-fat frozen snacks is also augmenting market growth.
| Country | CAGR (2025 to 2035) |
|---|---|
| South Korea | 5.6% |
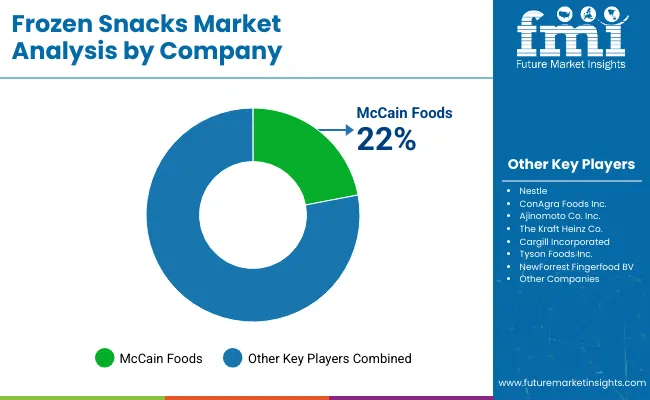
The frozen snacks market is rapidly growing with the increasing consumer demand for easy to cook, ready-to-eat and longer shelf-life food products. Urbanization, changing food consumption patterns, and technological advancements in frozen food are factors that positively influence the market. Manufacturers are investing in food formulation powered by AI, sustainable packaging and the development of frozen snacks with high nutrition value while enhancing taste, texture and preservation
| Report Attributes | Details |
|---|---|
| Market Size in 2025 | USD 153.91 billion |
| Market Size in 2035 | USD 262.90 billion |
| CAGR (2025 to 2035) | 5.5% |
| Base Year for Estimation | 2024 |
| Historical Period | 2020 to 2024 |
| Projections Period | 2025 to 2035 |
| Quantitative Units | USD billion for value |
| Product Types Analyzed | Desserts, Confectionery, Vegetable & Fruit Snacks, Bakery Products, Meat-Based Snacks, Meat Substitute Snacks, Seafood Snacks, Other Products |
| Categories Analyzed | Ready to Eat, Ready to Cook, Others |
| Sales Channels Analyzed | Offline Sales Channel, Online Sales Channel |
| Regions Covered | North America, Latin America, Western Europe, Eastern Europe, East Asia, South Asia Pacific, Middle East and Africa |
| Countries Covered | United States, Canada, Mexico, Brazil, Argentina, Germany, France, United Kingdom, Italy, Spain, Netherlands, China, India, Japan, South Korea, GCC Countries, South Africa |
| Key Players influencing the Market | Nestle, ConAgra Foods Inc., Ajinomoto Co. Inc., McCain Foods, The Kraft Heinz Co., Cargill Incorporated, Tyson Foods Inc., NewForrest Fingerfood BV, Rich Products Corp., Nomad Foods Ltd. |
| Additional Attributes | Dollar sales by product type (desserts, meat-based snacks, etc.), Dollar sales by sales channel (offline vs online), Growth trends in ready-to-eat vs ready-to-cook frozen snacks, Regional demand dynamics across North America, Europe, and Asia-Pacific |
The overall market size for the frozen snacks market was USD 153.91 billion in 2025.
The frozen snacks market is expected to reach USD 262.90 billion in 2035.
Growth is driven by the rising demand for convenient and ready-to-eat food options, increasing consumer preference for frozen bakery and savory snacks, advancements in freezing technology for extended shelf life, and expanding retail distribution networks.
The top 5 countries driving the development of the frozen snacks market are the USA, China, Germany, India, and the UK.
Meat-Based Snacks and Ready-to-Eat Products are expected to command a significant share over the assessment period.
Table 1: Global Market Value (US$ Million) Forecast by Region, 2018 to 2033
Table 2: Global Market Volume (Units) Forecast by Region, 2018 to 2033
Table 3: Global Market Value (US$ Million) Forecast by Product Type, 2018 to 2033
Table 4: Global Market Volume (Units) Forecast by Product Type, 2018 to 2033
Table 5: Global Market Value (US$ Million) Forecast by Category, 2018 to 2033
Table 6: Global Market Volume (Units) Forecast by Category, 2018 to 2033
Table 7: Global Market Value (US$ Million) Forecast by Sales Channel, 2018 to 2033
Table 8: Global Market Volume (Units) Forecast by Sales Channel, 2018 to 2033
Table 9: North America Market Value (US$ Million) Forecast by Country, 2018 to 2033
Table 10: North America Market Volume (Units) Forecast by Country, 2018 to 2033
Table 11: North America Market Value (US$ Million) Forecast by Product Type, 2018 to 2033
Table 12: North America Market Volume (Units) Forecast by Product Type, 2018 to 2033
Table 13: North America Market Value (US$ Million) Forecast by Category, 2018 to 2033
Table 14: North America Market Volume (Units) Forecast by Category, 2018 to 2033
Table 15: North America Market Value (US$ Million) Forecast by Sales Channel, 2018 to 2033
Table 16: North America Market Volume (Units) Forecast by Sales Channel, 2018 to 2033
Table 17: Latin America Market Value (US$ Million) Forecast by Country, 2018 to 2033
Table 18: Latin America Market Volume (Units) Forecast by Country, 2018 to 2033
Table 19: Latin America Market Value (US$ Million) Forecast by Product Type, 2018 to 2033
Table 20: Latin America Market Volume (Units) Forecast by Product Type, 2018 to 2033
Table 21: Latin America Market Value (US$ Million) Forecast by Category, 2018 to 2033
Table 22: Latin America Market Volume (Units) Forecast by Category, 2018 to 2033
Table 23: Latin America Market Value (US$ Million) Forecast by Sales Channel, 2018 to 2033
Table 24: Latin America Market Volume (Units) Forecast by Sales Channel, 2018 to 2033
Table 25: Europe Market Value (US$ Million) Forecast by Country, 2018 to 2033
Table 26: Europe Market Volume (Units) Forecast by Country, 2018 to 2033
Table 27: Europe Market Value (US$ Million) Forecast by Product Type, 2018 to 2033
Table 28: Europe Market Volume (Units) Forecast by Product Type, 2018 to 2033
Table 29: Europe Market Value (US$ Million) Forecast by Category, 2018 to 2033
Table 30: Europe Market Volume (Units) Forecast by Category, 2018 to 2033
Table 31: Europe Market Value (US$ Million) Forecast by Sales Channel, 2018 to 2033
Table 32: Europe Market Volume (Units) Forecast by Sales Channel, 2018 to 2033
Table 33: Asia Pacific Market Value (US$ Million) Forecast by Country, 2018 to 2033
Table 34: Asia Pacific Market Volume (Units) Forecast by Country, 2018 to 2033
Table 35: Asia Pacific Market Value (US$ Million) Forecast by Product Type, 2018 to 2033
Table 36: Asia Pacific Market Volume (Units) Forecast by Product Type, 2018 to 2033
Table 37: Asia Pacific Market Value (US$ Million) Forecast by Category, 2018 to 2033
Table 38: Asia Pacific Market Volume (Units) Forecast by Category, 2018 to 2033
Table 39: Asia Pacific Market Value (US$ Million) Forecast by Sales Channel, 2018 to 2033
Table 40: Asia Pacific Market Volume (Units) Forecast by Sales Channel, 2018 to 2033
Table 41: MEA Market Value (US$ Million) Forecast by Country, 2018 to 2033
Table 42: MEA Market Volume (Units) Forecast by Country, 2018 to 2033
Table 43: MEA Market Value (US$ Million) Forecast by Product Type, 2018 to 2033
Table 44: MEA Market Volume (Units) Forecast by Product Type, 2018 to 2033
Table 45: MEA Market Value (US$ Million) Forecast by Category, 2018 to 2033
Table 46: MEA Market Volume (Units) Forecast by Category, 2018 to 2033
Table 47: MEA Market Value (US$ Million) Forecast by Sales Channel, 2018 to 2033
Table 48: MEA Market Volume (Units) Forecast by Sales Channel, 2018 to 2033
Figure 1: Global Market Value (US$ Million) by Product Type, 2023 to 2033
Figure 2: Global Market Value (US$ Million) by Category, 2023 to 2033
Figure 3: Global Market Value (US$ Million) by Sales Channel, 2023 to 2033
Figure 4: Global Market Value (US$ Million) by Region, 2023 to 2033
Figure 5: Global Market Value (US$ Million) Analysis by Region, 2018 to 2033
Figure 6: Global Market Volume (Units) Analysis by Region, 2018 to 2033
Figure 7: Global Market Value Share (%) and BPS Analysis by Region, 2023 to 2033
Figure 8: Global Market Y-o-Y Growth (%) Projections by Region, 2023 to 2033
Figure 9: Global Market Value (US$ Million) Analysis by Product Type, 2018 to 2033
Figure 10: Global Market Volume (Units) Analysis by Product Type, 2018 to 2033
Figure 11: Global Market Value Share (%) and BPS Analysis by Product Type, 2023 to 2033
Figure 12: Global Market Y-o-Y Growth (%) Projections by Product Type, 2023 to 2033
Figure 13: Global Market Value (US$ Million) Analysis by Category, 2018 to 2033
Figure 14: Global Market Volume (Units) Analysis by Category, 2018 to 2033
Figure 15: Global Market Value Share (%) and BPS Analysis by Category, 2023 to 2033
Figure 16: Global Market Y-o-Y Growth (%) Projections by Category, 2023 to 2033
Figure 17: Global Market Value (US$ Million) Analysis by Sales Channel, 2018 to 2033
Figure 18: Global Market Volume (Units) Analysis by Sales Channel, 2018 to 2033
Figure 19: Global Market Value Share (%) and BPS Analysis by Sales Channel, 2023 to 2033
Figure 20: Global Market Y-o-Y Growth (%) Projections by Sales Channel, 2023 to 2033
Figure 21: Global Market Attractiveness by Product Type, 2023 to 2033
Figure 22: Global Market Attractiveness by Category, 2023 to 2033
Figure 23: Global Market Attractiveness by Sales Channel, 2023 to 2033
Figure 24: Global Market Attractiveness by Region, 2023 to 2033
Figure 25: North America Market Value (US$ Million) by Product Type, 2023 to 2033
Figure 26: North America Market Value (US$ Million) by Category, 2023 to 2033
Figure 27: North America Market Value (US$ Million) by Sales Channel, 2023 to 2033
Figure 28: North America Market Value (US$ Million) by Country, 2023 to 2033
Figure 29: North America Market Value (US$ Million) Analysis by Country, 2018 to 2033
Figure 30: North America Market Volume (Units) Analysis by Country, 2018 to 2033
Figure 31: North America Market Value Share (%) and BPS Analysis by Country, 2023 to 2033
Figure 32: North America Market Y-o-Y Growth (%) Projections by Country, 2023 to 2033
Figure 33: North America Market Value (US$ Million) Analysis by Product Type, 2018 to 2033
Figure 34: North America Market Volume (Units) Analysis by Product Type, 2018 to 2033
Figure 35: North America Market Value Share (%) and BPS Analysis by Product Type, 2023 to 2033
Figure 36: North America Market Y-o-Y Growth (%) Projections by Product Type, 2023 to 2033
Figure 37: North America Market Value (US$ Million) Analysis by Category, 2018 to 2033
Figure 38: North America Market Volume (Units) Analysis by Category, 2018 to 2033
Figure 39: North America Market Value Share (%) and BPS Analysis by Category, 2023 to 2033
Figure 40: North America Market Y-o-Y Growth (%) Projections by Category, 2023 to 2033
Figure 41: North America Market Value (US$ Million) Analysis by Sales Channel, 2018 to 2033
Figure 42: North America Market Volume (Units) Analysis by Sales Channel, 2018 to 2033
Figure 43: North America Market Value Share (%) and BPS Analysis by Sales Channel, 2023 to 2033
Figure 44: North America Market Y-o-Y Growth (%) Projections by Sales Channel, 2023 to 2033
Figure 45: North America Market Attractiveness by Product Type, 2023 to 2033
Figure 46: North America Market Attractiveness by Category, 2023 to 2033
Figure 47: North America Market Attractiveness by Sales Channel, 2023 to 2033
Figure 48: North America Market Attractiveness by Country, 2023 to 2033
Figure 49: Latin America Market Value (US$ Million) by Product Type, 2023 to 2033
Figure 50: Latin America Market Value (US$ Million) by Category, 2023 to 2033
Figure 51: Latin America Market Value (US$ Million) by Sales Channel, 2023 to 2033
Figure 52: Latin America Market Value (US$ Million) by Country, 2023 to 2033
Figure 53: Latin America Market Value (US$ Million) Analysis by Country, 2018 to 2033
Figure 54: Latin America Market Volume (Units) Analysis by Country, 2018 to 2033
Figure 55: Latin America Market Value Share (%) and BPS Analysis by Country, 2023 to 2033
Figure 56: Latin America Market Y-o-Y Growth (%) Projections by Country, 2023 to 2033
Figure 57: Latin America Market Value (US$ Million) Analysis by Product Type, 2018 to 2033
Figure 58: Latin America Market Volume (Units) Analysis by Product Type, 2018 to 2033
Figure 59: Latin America Market Value Share (%) and BPS Analysis by Product Type, 2023 to 2033
Figure 60: Latin America Market Y-o-Y Growth (%) Projections by Product Type, 2023 to 2033
Figure 61: Latin America Market Value (US$ Million) Analysis by Category, 2018 to 2033
Figure 62: Latin America Market Volume (Units) Analysis by Category, 2018 to 2033
Figure 63: Latin America Market Value Share (%) and BPS Analysis by Category, 2023 to 2033
Figure 64: Latin America Market Y-o-Y Growth (%) Projections by Category, 2023 to 2033
Figure 65: Latin America Market Value (US$ Million) Analysis by Sales Channel, 2018 to 2033
Figure 66: Latin America Market Volume (Units) Analysis by Sales Channel, 2018 to 2033
Figure 67: Latin America Market Value Share (%) and BPS Analysis by Sales Channel, 2023 to 2033
Figure 68: Latin America Market Y-o-Y Growth (%) Projections by Sales Channel, 2023 to 2033
Figure 69: Latin America Market Attractiveness by Product Type, 2023 to 2033
Figure 70: Latin America Market Attractiveness by Category, 2023 to 2033
Figure 71: Latin America Market Attractiveness by Sales Channel, 2023 to 2033
Figure 72: Latin America Market Attractiveness by Country, 2023 to 2033
Figure 73: Europe Market Value (US$ Million) by Product Type, 2023 to 2033
Figure 74: Europe Market Value (US$ Million) by Category, 2023 to 2033
Figure 75: Europe Market Value (US$ Million) by Sales Channel, 2023 to 2033
Figure 76: Europe Market Value (US$ Million) by Country, 2023 to 2033
Figure 77: Europe Market Value (US$ Million) Analysis by Country, 2018 to 2033
Figure 78: Europe Market Volume (Units) Analysis by Country, 2018 to 2033
Figure 79: Europe Market Value Share (%) and BPS Analysis by Country, 2023 to 2033
Figure 80: Europe Market Y-o-Y Growth (%) Projections by Country, 2023 to 2033
Figure 81: Europe Market Value (US$ Million) Analysis by Product Type, 2018 to 2033
Figure 82: Europe Market Volume (Units) Analysis by Product Type, 2018 to 2033
Figure 83: Europe Market Value Share (%) and BPS Analysis by Product Type, 2023 to 2033
Figure 84: Europe Market Y-o-Y Growth (%) Projections by Product Type, 2023 to 2033
Figure 85: Europe Market Value (US$ Million) Analysis by Category, 2018 to 2033
Figure 86: Europe Market Volume (Units) Analysis by Category, 2018 to 2033
Figure 87: Europe Market Value Share (%) and BPS Analysis by Category, 2023 to 2033
Figure 88: Europe Market Y-o-Y Growth (%) Projections by Category, 2023 to 2033
Figure 89: Europe Market Value (US$ Million) Analysis by Sales Channel, 2018 to 2033
Figure 90: Europe Market Volume (Units) Analysis by Sales Channel, 2018 to 2033
Figure 91: Europe Market Value Share (%) and BPS Analysis by Sales Channel, 2023 to 2033
Figure 92: Europe Market Y-o-Y Growth (%) Projections by Sales Channel, 2023 to 2033
Figure 93: Europe Market Attractiveness by Product Type, 2023 to 2033
Figure 94: Europe Market Attractiveness by Category, 2023 to 2033
Figure 95: Europe Market Attractiveness by Sales Channel, 2023 to 2033
Figure 96: Europe Market Attractiveness by Country, 2023 to 2033
Figure 97: Asia Pacific Market Value (US$ Million) by Product Type, 2023 to 2033
Figure 98: Asia Pacific Market Value (US$ Million) by Category, 2023 to 2033
Figure 99: Asia Pacific Market Value (US$ Million) by Sales Channel, 2023 to 2033
Figure 100: Asia Pacific Market Value (US$ Million) by Country, 2023 to 2033
Figure 101: Asia Pacific Market Value (US$ Million) Analysis by Country, 2018 to 2033
Figure 102: Asia Pacific Market Volume (Units) Analysis by Country, 2018 to 2033
Figure 103: Asia Pacific Market Value Share (%) and BPS Analysis by Country, 2023 to 2033
Figure 104: Asia Pacific Market Y-o-Y Growth (%) Projections by Country, 2023 to 2033
Figure 105: Asia Pacific Market Value (US$ Million) Analysis by Product Type, 2018 to 2033
Figure 106: Asia Pacific Market Volume (Units) Analysis by Product Type, 2018 to 2033
Figure 107: Asia Pacific Market Value Share (%) and BPS Analysis by Product Type, 2023 to 2033
Figure 108: Asia Pacific Market Y-o-Y Growth (%) Projections by Product Type, 2023 to 2033
Figure 109: Asia Pacific Market Value (US$ Million) Analysis by Category, 2018 to 2033
Figure 110: Asia Pacific Market Volume (Units) Analysis by Category, 2018 to 2033
Figure 111: Asia Pacific Market Value Share (%) and BPS Analysis by Category, 2023 to 2033
Figure 112: Asia Pacific Market Y-o-Y Growth (%) Projections by Category, 2023 to 2033
Figure 113: Asia Pacific Market Value (US$ Million) Analysis by Sales Channel, 2018 to 2033
Figure 114: Asia Pacific Market Volume (Units) Analysis by Sales Channel, 2018 to 2033
Figure 115: Asia Pacific Market Value Share (%) and BPS Analysis by Sales Channel, 2023 to 2033
Figure 116: Asia Pacific Market Y-o-Y Growth (%) Projections by Sales Channel, 2023 to 2033
Figure 117: Asia Pacific Market Attractiveness by Product Type, 2023 to 2033
Figure 118: Asia Pacific Market Attractiveness by Category, 2023 to 2033
Figure 119: Asia Pacific Market Attractiveness by Sales Channel, 2023 to 2033
Figure 120: Asia Pacific Market Attractiveness by Country, 2023 to 2033
Figure 121: MEA Market Value (US$ Million) by Product Type, 2023 to 2033
Figure 122: MEA Market Value (US$ Million) by Category, 2023 to 2033
Figure 123: MEA Market Value (US$ Million) by Sales Channel, 2023 to 2033
Figure 124: MEA Market Value (US$ Million) by Country, 2023 to 2033
Figure 125: MEA Market Value (US$ Million) Analysis by Country, 2018 to 2033
Figure 126: MEA Market Volume (Units) Analysis by Country, 2018 to 2033
Figure 127: MEA Market Value Share (%) and BPS Analysis by Country, 2023 to 2033
Figure 128: MEA Market Y-o-Y Growth (%) Projections by Country, 2023 to 2033
Figure 129: MEA Market Value (US$ Million) Analysis by Product Type, 2018 to 2033
Figure 130: MEA Market Volume (Units) Analysis by Product Type, 2018 to 2033
Figure 131: MEA Market Value Share (%) and BPS Analysis by Product Type, 2023 to 2033
Figure 132: MEA Market Y-o-Y Growth (%) Projections by Product Type, 2023 to 2033
Figure 133: MEA Market Value (US$ Million) Analysis by Category, 2018 to 2033
Figure 134: MEA Market Volume (Units) Analysis by Category, 2018 to 2033
Figure 135: MEA Market Value Share (%) and BPS Analysis by Category, 2023 to 2033
Figure 136: MEA Market Y-o-Y Growth (%) Projections by Category, 2023 to 2033
Figure 137: MEA Market Value (US$ Million) Analysis by Sales Channel, 2018 to 2033
Figure 138: MEA Market Volume (Units) Analysis by Sales Channel, 2018 to 2033
Figure 139: MEA Market Value Share (%) and BPS Analysis by Sales Channel, 2023 to 2033
Figure 140: MEA Market Y-o-Y Growth (%) Projections by Sales Channel, 2023 to 2033
Figure 141: MEA Market Attractiveness by Product Type, 2023 to 2033
Figure 142: MEA Market Attractiveness by Category, 2023 to 2033
Figure 143: MEA Market Attractiveness by Sales Channel, 2023 to 2033
Figure 144: MEA Market Attractiveness by Country, 2023 to 2033


Full Research Suite comprises of:
Market outlook & trends analysis
Interviews & case studies
Strategic recommendations
Vendor profiles & capabilities analysis
5-year forecasts
8 regions and 60+ country-level data splits
Market segment data splits
12 months of continuous data updates
DELIVERED AS:
PDF EXCEL ONLINE
Frozen Egg Market Size and Share Forecast Outlook 2025 to 2035
Frozen Food Packaging Market Size and Share Forecast Outlook 2025 to 2035
Frozen Tissues Samples Market Size and Share Forecast Outlook 2025 to 2035
Frozen Food Packaging Machines Market Size and Share Forecast Outlook 2025 to 2035
Frozen Food Market Analysis - Size, Share, and Forecast Outlook 2025 to 2035
Frozen Pastries Market Size and Share Forecast Outlook 2025 to 2035
Frozen Baked Goods Market Size and Share Forecast Outlook 2025 to 2035
Frozen Potatoes Market Size and Share Forecast Outlook 2025 to 2035
Frozen Beverage Dispenser Market Size and Share Forecast Outlook 2025 to 2035
Frozen Meat Grinder Market Size and Share Forecast Outlook 2025 to 2035
Frozen Fruits and Vegetables Market Size and Share Forecast Outlook 2025 to 2035
Frozen Vegetable Market Analysis - Size, Share, and Forecast Outlook 2025 to 2035
Frozen Cheese Market Size and Share Forecast Outlook 2025 to 2035
Frozen Fruit Bars Market Analysis - Size and Share Forecast Outlook 2025 to 2035
Frozen Desserts Market Growth Share Trends 2025 to 2035
Frozen Ready Meals Market Analysis - Size, Share, and Forecast Outlook 2025 to 2035
Frozen Tortilla Market Size, Growth, and Forecast for 2025 to 2035
Market Share Insights in the Frozen Food Industry
Frozen Sardine Market Analysis Freezing Process, Form, Packaging Type and Distribution channel Through 2035
Frozen Dough Market Analysis by type, distribution channel and region through 2035

Thank you!
You will receive an email from our Business Development Manager. Please be sure to check your SPAM/JUNK folder too.
Chat With
MaRIA