Reports

- Global Locations -

Headquarters

Future Market Insights, Inc.

Christiana Corporate, 200
Continental Drive, Suite 401,
Newark, Delaware - 19713,
United States

T: +1-845-579-5705

Americas

Future Market Insights, Inc.

616 Corporate Way, Suite 2-9018,
Valley Cottage, NY 10989, United States

T: +1-347-918-3531

MEA

Future Market Insights

1602-6 Jumeirah Bay X2 Tower, Plot No: JLT-PH2-X2A,
Jumeirah Lakes Towers, Dubai,
United Arab Emirates

Europe

Future Market Insights

3rd Floor, 207 Regent Street,
W1B 3HH London
United Kingdom

T: + 44 (0) 20 8123 9659
D: +44 (0) 20 3287 4268

Asia Pacific

Future Market Insights

IndiaLand Global Tech Park, Unit UG-1, Behind Grand HighStreet, Phase 1, Hinjawadi, MH, Pune – 411057, India

Frozen Food Market Outlook from 2024 to 2034

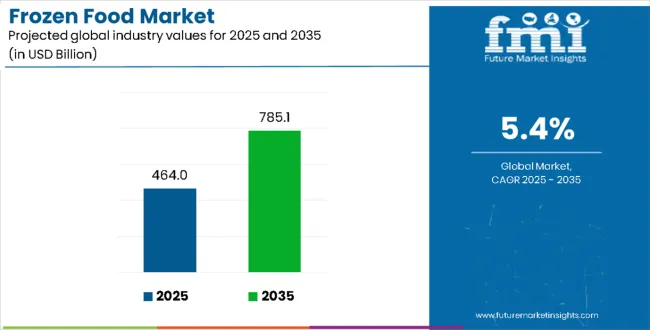
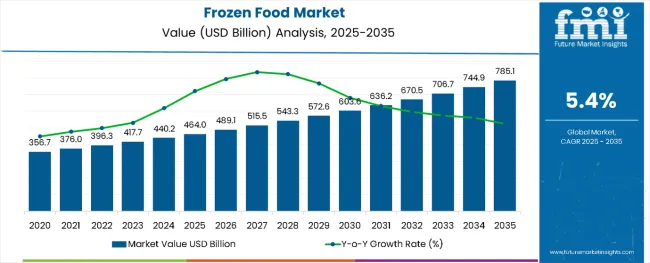
The global frozen food market is projected to increase from US$ 365.2 billion in 2024 to US$ 638.6 billion in 2034. The market is projected to surge at a CAGR of 5.7% by 2034.

Attributes Key Insights
Estimated Global Frozen Food Size (2024E) US$ 365.2 billion
Projected Frozen Food Value (2034F) US$ 638.6 billion
Value-based CAGR (2024 to 2034) 5.7%

Don't pay for what you don't need

Customize your report by selecting specific countries or regions and save 30%!

Frozen Food Market Overview

  • The growing popularity of healthy eating among consumers is expected to benefit the frozen food market’s growth.
  • Consumers are opting for healthy snacking due to rising concerns over the increasing rates of obesity and high consumption of unhealthy food. They opt for food products that provide nutrients, such as healthy dried food substitutes.
  • As the number of working women increases, it is harder for them to prepare meals; hence, they end up adopting frozen prepared food. Together, these factors are expected to propel the market expansion.
  • Due to their long shelf life, ready-to-eat (RTE) food products are becoming popular among consumers due to the stay-at-home trend.
  • Companies are investing in research & development to create unique and innovative high-quality products. They are also focusing on adopting the latest technologies to maintain high-quality standards.
  • Corporations are offering eco-friendly and sustainable packaging in tandem with the clean-label movement. This is mainly in response to customers' growing environmental concerns and increasing product penetration in the market.

2019 to 2023 Global Frozen Food Market Growth Outlook Vs. 2024 to 2034

Global frozen food sales increased at a CAGR of 5.4% from 2019 to 2023.

  • Clarence Birdseye was widely recognized for inventing contemporary food processing methods and introducing frozen fruits, vegetables, and fish to the public.
  • The frozen food industry began offering a wide variety of goods, including frozen dinners, appetizers, desserts, and basic fruits & vegetables.
  • Manufacturers devised innovative packaging that was convenient and attracted busy consumers.
  • The need for quick & simple meal options was fueled by busy lives and an increasing number of dual-income homes, which resulted in the spread of frozen convenience meals in grocery shops and supermarkets.
  • Manufacturers introduced gourmet frozen meals, artisanal desserts, and expensive appetizers to cater to discerning consumers wanting restaurant-quality eating experiences at home. This led to a trend toward premiumization in the frozen food market.
  • The quality, flavor, and nutritional content of frozen meals have continuously increased due to developments in freezing technology, packaging materials, and processing methods.
  • Vacuum sealing, microwaveable packaging, and flash freezing have improved convenience while maintaining frozen food freshness.

The global market for frozen food is expected to rise at a compound annual growth rate (CAGR) of 5.7% by 2034.

  • Premiumization trends are bridging the gap between the luxury and mass market to give all consumers access to unique and innovative products.
  • Consumers are willing to pay more for value-added products with real benefits.
  • Manufacturers are focusing on the premiumization of consumer-end products in terms of product quality.
  • Manufacturers are promoting healthy diets through social media platforms like Pinterest, Instagram, Twitter, and Facebook, which are considered among the most critical influential factors.
Nandini Roy Choudhury

Principal Consultant

Talk to Analyst

Find your sweet spots for generating winning opportunities in this market.

Key Frozen Food Market Trends

  • As plant-based diets are gaining traction, there is a greater need for frozen plant-based meals, including dairy-free frozen desserts, veggie burgers, and animal substitutes. This trend reflects customers' rising interest in ethical issues, health consciousness, and sustainability.
  • The desire for convenience and busy lives are the key drivers of the frozen food market. Consumers are searching for quick and simple dinner alternatives without sacrificing flavor or quality.
  • The rise of online shopping and direct-to-consumer channels is changing how frozen food is sold and delivered. Several customers buy frozen foods online from producers or grocery delivery services.
  • When it comes to frozen food products, consumers are willing to pay more for those that provide better taste, ingredients, and cooking experiences. Due to this trend, upmarket frozen appetizers, artisanal desserts, and gourmet frozen dinners are becoming popular among discriminating customers who value luxury and quality.

Restraining Factors in the Frozen Food Market

  • The frozen food industry faces fierce competition from the availability of fresh, ready-to-eat meal options in supermarkets, delis, and fast-casual restaurants.
  • Customers are expected to prefer fresh foods over frozen ones, especially if they believe that fresh food is more convenient or healthier.
  • Supply chain problems are set to arise from disruptions that affect the availability and quality of frozen meals, such as labor shortages, natural catastrophes, or problems with transportation.
  • Convenience plays a key role in the use of frozen food, although customers' price sensitivity is still a barrier.

Get the data you need at a Fraction of the cost

Personalize your report by choosing insights you need
and save 40%!

Comparative View of Adjacent Markets

A comprehensive analysis of growth and challenges has been tabulated below. The frozen food market is compared with two industries that have the potential to compete rigorously: the frozen bakery market and the frozen seafood market.

The growth rates and key market trends are mentioned in the table below. Among the mentioned markets, the frozen seafood market is poised to rise more rapidly during the forecast period.

Frozen Food Market:

Attributes Frozen Food Market
CAGR (2024 to 2034) 5.7%
Opportunity The frozen food market is seeing an increasing demand for environmentally friendly packaging due to rising concerns about plastic pollution and environmental sustainability. Manufacturers are looking into reusable containers, recyclable packaging, and compostable materials as alternatives to conventional plastic packaging.
Trends in the Frozen Food Industry There is a growing trend among consumers to experiment with different international cuisines. In response, frozen food producers are expanding their menus to include a wide variety of foreign cuisines, such as Mexican, Asian, Middle Eastern, and Mediterranean foods. This trend satisfies customers' need for real dining experiences at home as well as their adventurous palates.

Frozen Bakery Market:

Attributes Frozen Bakery Market
CAGR (2024 to 2034) 6.5%
Opportunity Manufacturers are introducing new frozen bakery products with innovative flavors, textures, and formats to meet changing millennial preferences.
Key Trends Frozen bakery products can be stored for long periods of time, which allows consumers to have them readily available at home without having to make frequent trips to the store.

Frozen Seafood Market:

Attributes Frozen Seafood Market
CAGR (2024 to 2034) 6.8%
Opportunity Manufacturers are offering more value-added frozen seafood products such as pre-cooked shrimp, seafood mixes, and meal kits to provide ease of preparation and high convenience.
Key Trends Consuming frozen seafood offers several benefits to consumers. It includes vitamins, minerals, and omega-3 fatty acids, all of which are necessary for maintaining both physical and mental wellness.

Country-wise Insights

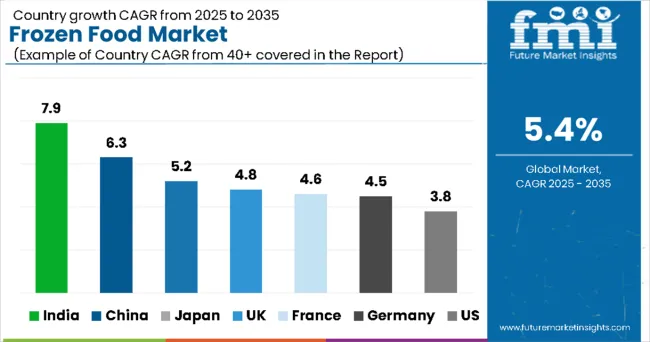
The below table shows the estimated growth rates of the top six countries. India, Japan, and the United Kingdom are set to record high CAGRs of 5.9%, 5.6%, and 5.2%, respectively, through 2034.

Countries CAGR (2024 to 2034)
United States 4.9%
United Kingdom 5.2%
Germany 5.0%
China 4.2%
India 5.9%
Japan 5.6%

Increasing Urban Population Makes the United States one of the Lucrative Markets

The frozen food market in the United States is expected to surge at a CAGR of 4.9% through 2034. Key factors supporting the market growth are:

  • Demand for frozen food products in the United States is rising due to the convenience of consumption while on the go.
  • The frozen food market in the United States provides consumers with an extensive range of products- from frozen fruits and vegetables to frozen dinners, snacks, and desserts. This variety meets the dietary requirements and tastes of a broad spectrum of customers.
  • An increasing demand for vegetarian and plant-based frozen foods reflects the changing dietary choices of consumers in the United States.

Availability of Products at Competitive Prices Fueling Sales in China

China’s frozen food market is anticipated to rise at a steady CAGR of 4.2% during the forecast period. This is attributable to a combination of factors, including:

  • China is investing heavily in modern processing facilities and advanced technologies, allowing for the efficient production of high-quality frozen food products.
  • Large-scale processing capacity is enabling China to become a key exporter of frozen food, not only meeting domestic demand but also catering to international markets.
  • Innovative techniques such as flash freezing, vacuum sealing, and microwaveable packaging are improving convenience and maintaining the freshness of frozen goods in China.

Busy Lifestyle of Consumers and High Convenience Driving Demand in Japan

The demand for frozen food in Japan is rising, with a projected CAGR of 5.6% through 2034. Emerging patterns in the market are as follows:

  • Consumers value time-saving meal solutions with little preparation, a key demand driver in Japan’s frozen food market.
  • Health and wellness trends are impacting consumer tastes, raising the demand for healthier frozen food options, such as organic, low-sodium, and natural goods.
  • In Japan, frozen foods are found in several retail establishments, such as supermarkets, grocery stores, club stores, convenience stores, and internet merchants.

Category-wise Insights

The below section shows the frozen fish and seafood segment dominating by product type. It is predicted to surge at 4.0% CAGR through 2034. Based on sales channels, the hypermarket/supermarket segment is anticipated to generate a dominant share through 2024. It is expected to rise at a CAGR of 4.1% through 2034.

Segment CAGR (2024 to 2034)
Frozen Fish and Seafood (Product Type) 4.0%
Hypermarket/Supermarket (Sales Channel) 4.1%

Frozen Fish and Seafood Segment Dominates the Market by Product Type

  • The frozen fish and seafood segment is gaining traction as consumers are becoming more aware of seafood’s several health advantages.
  • The market for frozen fish and seafood is gaining momentum due to consumers' increasing need for more convenient and healthful eating alternatives.
  • The segment’s domination in the market is greatly aided by the growth of supermarkets and retail chains, where these items are often displayed.

Hypermarket/Supermarket Giants Drive Frozen Food Market Growth

  • To draw consumers and increase sales, supermarkets and hypermarkets usually run deals, discounts, and special offers on frozen food items.
  • Supermarkets and hypermarkets frequently give frozen food items prominent shelf space, increasing their exposure to customers.
  • Brands are expected to spend more on attention-grabbing packaging, branding, and marketing techniques to stand out in congested freezer aisles and draw customers in.

Competitive Landscape

Frozen food manufacturers are forming strategic partnerships and alliances with other producers to increase efficiency and satisfy the needs of an expanding consumer base. High capital investment and a challenging production procedure are what characterize this business.

Leading manufacturers in this industry, with their sizable customer bases, well-known brands, and extensive distribution networks, present fierce competition for the market's participants. To remain competitive, companies are putting a variety of growth tactics into practice, including alliances and introducing new products.

For instance

  • In March 2021, Nomad Foods acquired Fortenova's frozen food business.
  • In January 2021, Imperial Tobacco Company of India Limited (ITC) added ten new items and tripled the size of its frozen snack business.
  • In June 2020, The Goel Group established GOELD, a frozen food company. The company sells fifteen items in four categories: vegan delights, Indian breads, snacks, and desserts.
  • In March 2022, Halo Top launched a streak of fruity frozen desserts with novel sorbet pints.
  • In March 2022, GoodPop frozen pops introduced 100% fruit juice-based, sugar-free, USDA-certified organic pops.
  • In October 2021, Amul expanded its RTE and frozen food offerings, including frozen paneer, cheese parathas, potatoes, and patties.

Key Companies Profiled

  • Aryzta A.G.
  • Ajinomoto Co. Inc.
  • Cargill Incorporated
  • General Mills Inc.
  • JBS S.A.
  • Kellogg Company
  • The Kraft Heinz Company
  • Nestle S.A.
  • ConAgra Brands, Inc.
  • Associated British Foods Plc.
  • Amy's Kitchen
  • Birds Eye
  • Maple Leaf Foods
  • Pinnacle Foods
  • Unilever
  • Tyson Foods

Key Coverage in Frozen Food Market Report

  • Thorough Analysis of Frozen Food Price Index
  • Insights into Frozen Food Marketing Strategy
  • Details Explaining Why the Frozen Food Market in India is Expanding
  • Analysis of Middle East and North Africa Frozen Food Market
  • Evaluation of Key Factors Driving Frozen Food Consumption
  • Detailed Analysis of Top Companies in Frozen Food Market
  • Descriptions of the Health Benefits of Frozen Dairy Products
  • Scrutinization of the Target Market for Frozen Food Items

Frozen Food Market Segmentation by Category

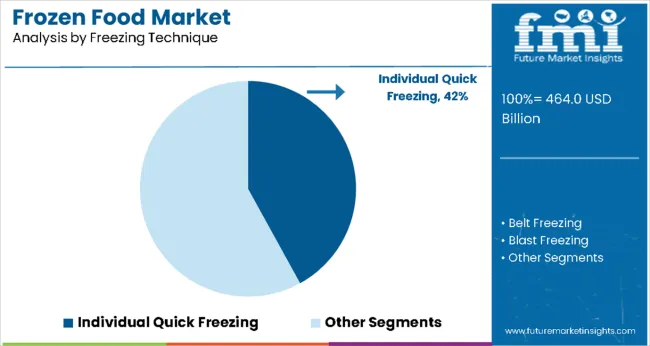
By Freezing Technique:

  • Blast Freezing
  • Belt Freezing
  • Individual Quick Freezing

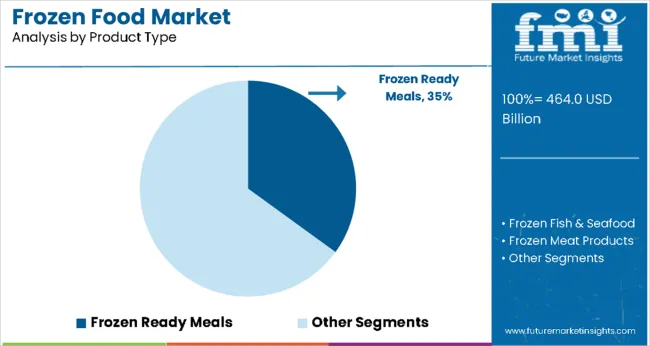
By Product Type:

  • Frozen Ready Meals
  • Frozen Fish and Seafood
  • Frozen Meat Products
    • Poultry
    • Pork
    • Beef
  • Frozen Dairy Products
  • Frozen Fruits and Vegetables
  • Frozen Bakery Products
  • Frozen Soups and Sauces

By Sales Channel:

  • Food Service Industry
  • Retail/Household
    • Hypermarket/Supermarket
    • Convenience Store
    • Departmental Stores
    • Wholesale Stores
    • Mass Grocery Stores
    • Independent Retailers
    • Specialty Stores

By Region:

  • North America
  • Latin America
  • Europe
  • East Asia
  • South Asia
  • Oceania
  • Middle East and Africa

Frequently Asked Questions

How big is the frozen food market?

The market is set to reach US$ 365.2 billion in 2024.

What is the forecast for the frozen food market?

Demand for frozen food is slated to expand at a 5.7% CAGR by 2034.

What is the outlook for the frozen food market?

The market is set to reach US$ 638.6 billion in 2034.

Who are the key players in the frozen food market?

Aryzta A.G., Ajinomoto Co. Inc., and Cargill Incorporated are the key players.

Which product type would lead the frozen food market?

The frozen fish and seafood segment is estimated to hold a significant market share in 2024.

Table of Content

1. Executive Summary

    1.1. Global Market Outlook

    1.2. Demand Side Trends

    1.3. Supply Side Trends

    1.4. Technology Roadmap

    1.5. Analysis and Recommendations

2. Market Overview

    2.1. Market Coverage / Taxonomy

    2.2. Market Definition / Scope / Limitations

3. Market Dynamics

    3.1. Drivers

        3.1.1. Supply Side Drivers

        3.1.2. Demand Side drivers

        3.1.3. Economic Side Drivers

    3.2. Restraints

    3.3. Opportunity

    3.4. Market trends By Region

    3.5. Product Launches

    3.6. Product Claims & Nutritional Information Scan by Buyers

    3.7. Macro-Economic Factors

    3.8. Forecast Factors - Relevance & Impact

    3.9. Policy and Regulatory Landscape

4. Global Market - Pricing Analysis

    4.1. Price Point Assessment by Region

        4.1.1. Manufacturer Level Pricing

        4.1.2. Distributor Level Pricing

        4.1.3. Retail Level Pricing

    4.2. Price Forecast till 2034

5. Value Chain Analysis

    5.1. Profitability and Gross Margin Analysis By Competition

    5.2. List of Active Participants

    5.3. Raw Material Suppliers

    5.4. Key Manufacturers

    5.5. Key Distributor/Retailers

6. Global Market Demand in Value (US$ billion) and Volume (MT) Analysis 2019 to 2023 and Forecast, 2024 to 2034

    6.1. Historical Market Value (US$ billion) and Volume (MT) Analysis, 2019 to 2023

    6.2. Current and Future Market Value (US$ billion) and Volume (MT) Projections, 2024 to 2034

        6.2.1. Y-o-Y Growth Trend Analysis

        6.2.2. Absolute $ Opportunity Analysis

7. Global Market Analysis 2019 to 2023 and Forecast 2024 to 2034, by Freezing Technique

    7.1. Introduction / Key Findings

    7.2. Historical Market Size (US$ billion) and Volume (MT) Analysis By Freezing Technique, 2019 to 2023

    7.3. Current and Future Market Size (US$ billion) and Volume (MT) Analysis and Forecast By Freezing Technique, 2024 to 2034

        7.3.1. Blast Freezing

        7.3.2. Belt Freezing

        7.3.3. Individual Quick Freezing

    7.4. Market Attractiveness Analysis By Freezing Technique

8. Global Market Analysis 2019 to 2023 and Forecast 2024 to 2034, By Product Type

    8.1. Introduction / Key Findings

    8.2. Historical Market Size (US$ billion) and Volume (MT) Analysis By Product Type, 2019 to 2023

    8.3. Current and Future Market Size (US$ billion) and Volume (MT) Analysis and Forecast By Product Type, 2024 to 2034

        8.3.1. Frozen Ready Meals

        8.3.2. Frozen Fish & Seafood

        8.3.3. Frozen Meat Products

            8.3.3.1. Poultry

            8.3.3.2. Pork

            8.3.3.3. Beef

        8.3.4. Frozen Dairy Products

        8.3.5. Frozen Fruits & Vegetables

        8.3.6. Frozen Bakery products

        8.3.7. Frozen Soups & Sauces

    8.4. Market Attractiveness Analysis By Product Type

9. Global Market Analysis 2019 to 2023 and Forecast 2024 to 2034, By Sales Channel

    9.1. Introduction / Key Findings

    9.2. Historical Market Size (US$ billion) and Volume (MT) Analysis By Sales Channel, 2019 to 2023

    9.3. Current and Future Market Size (US$ billion) and Volume (MT) Analysis and Forecast By Sales Channel, 2024 to 2034

        9.3.1. Food Service Industry

        9.3.2. Retail/Household

            9.3.2.1. Hypermarket/Supermarket

            9.3.2.2. Convenience Store

            9.3.2.3. Departmental Stores

            9.3.2.4. Wholesale Stores

            9.3.2.5. Mass Grocery Stores

            9.3.2.6. Independent Retailers

            9.3.2.7. Specialty Stores

    9.4. Market Attractiveness Analysis By Sales Channel

10. Global Market Analysis 2019 to 2023 and Forecast 2024 to 2034, by Region

    10.1. Introduction

    10.2. Historical Market Size (US$ billion) and Volume (MT) Analysis By Region, 2019 to 2023

    10.3. Current Market Size (US$ billion) and Volume (MT) Analysis and Forecast By Region, 2024 to 2034

        10.3.1. North America

        10.3.2. Latin America

        10.3.3. Europe

        10.3.4. East Asia

        10.3.5. South Asia

        10.3.6. Oceania

        10.3.7. Middle East and Africa

    10.4. Market Attractiveness Analysis By Region

11. North America Market Analysis 2019 to 2023 and Forecast 2024 to 2034

    11.1. Introduction

    11.2. Pricing Analysis

    11.3. Historical Market Size (US$ billion) and Volume Trend Analysis By Market Taxonomy, 2019 to 2023

    11.4. Market Size (US$ billion) and Volume Forecast By Market Taxonomy, 2024 to 2034

        11.4.1. By Country

            11.4.1.1. United States

            11.4.1.2. Canada

        11.4.2. By Freezing Technique

        11.4.3. By Product Type

        11.4.4. By Sales Channel

    11.5. Market Attractiveness Analysis

        11.5.1. By Country

        11.5.2. By Freezing Technique

        11.5.3. By Product Type

        11.5.4. By Sales Channel

    11.6. Market Trends

    11.7. Key Market Participants - Intensity Mapping

    11.8. Drivers and Restraints - Impact Analysis

12. Latin America Market Analysis 2019 to 2023 and Forecast 2024 to 2034

    12.1. Introduction

    12.2. Pricing Analysis

    12.3. Historical Market Size (US$ billion) and Volume Trend Analysis By Market Taxonomy, 2019 to 2023

    12.4. Market Size (US$ billion) and Volume Forecast By Market Taxonomy, 2024 to 2034

        12.4.1. By Country

            12.4.1.1. Brazil

            12.4.1.2. Mexico

            12.4.1.3. Argentina

            12.4.1.4. Rest of Latin America

        12.4.2. By Freezing Technique

        12.4.3. By Product Type

        12.4.4. By Sales Channel

    12.5. Market Attractiveness Analysis

        12.5.1. By Country

        12.5.2. By Freezing Technique

        12.5.3. By Product Type

        12.5.4. By Sales Channel

    12.6. Market Trends

    12.7. Key Market Participants - Intensity Mapping

    12.8. Drivers and Restraints - Impact Analysis

13. Europe Market Analysis 2019 to 2023 and Forecast 2024 to 2034

    13.1. Introduction

    13.2. Pricing Analysis

    13.3. Historical Market Size (US$ billion) and Volume Trend Analysis By Market Taxonomy, 2019 to 2023

    13.4. Market Size (US$ billion) and Volume Forecast By Market Taxonomy, 2024 to 2034

        13.4.1. By Country

            13.4.1.1. Germany

            13.4.1.2. United Kingdom

            13.4.1.3. France

            13.4.1.4. Italy

            13.4.1.5. Spain

            13.4.1.6. BENELUX

            13.4.1.7. Nordic

            13.4.1.8. Russia

            13.4.1.9. Poland

            13.4.1.10. Rest of Europe

        13.4.2. By Freezing Technique

        13.4.3. By Product Type

        13.4.4. By Sales Channel

    13.5. Market Attractiveness Analysis

        13.5.1. By Country

        13.5.2. By Freezing Technique

        13.5.3. By Product Type

        13.5.4. By Sales Channel

    13.6. Market Trends

    13.7. Key Market Participants - Intensity Mapping

    13.8. Drivers and Restraints - Impact Analysis

14. East Asia Market Analysis 2019 to 2023 and Forecast 2024 to 2034

    14.1. Introduction

    14.2. Pricing Analysis

    14.3. Historical Market Size (US$ billion) and Volume Trend Analysis By Market Taxonomy, 2019 to 2023

    14.4. Market Size (US$ billion) and Volume Forecast By Market Taxonomy, 2024 to 2034

        14.4.1. By Country

            14.4.1.1. China

            14.4.1.2. Japan

            14.4.1.3. South Korea

        14.4.2. By Freezing Technique

        14.4.3. By Product Type

        14.4.4. By Sales Channel

    14.5. Market Attractiveness Analysis

        14.5.1. By Country

        14.5.2. By Freezing Technique

        14.5.3. By Product Type

        14.5.4. By Sales Channel

    14.6. Market Trends

    14.7. Key Market Participants - Intensity Mapping

    14.8. Drivers and Restraints - Impact Analysis

15. South Asia Market Analysis 2019 to 2023 and Forecast 2024 to 2034

    15.1. Introduction

    15.2. Pricing Analysis

    15.3. Historical Market Size (US$ billion) and Volume Trend Analysis By Market Taxonomy, 2019 to 2023

    15.4. Market Size (US$ billion) and Volume Forecast By Market Taxonomy, 2024 to 2034

        15.4.1. By Country

            15.4.1.1. India

            15.4.1.2. Thailand

            15.4.1.3. Malaysia

            15.4.1.4. Indonesia

            15.4.1.5. Vietnam

            15.4.1.6. Philippines

            15.4.1.7. Singapore

            15.4.1.8. Rest of South Asia

        15.4.2. By Freezing Technique

        15.4.3. By Product Type

        15.4.4. By Sales Channel

    15.5. Market Attractiveness Analysis

        15.5.1. By Country

        15.5.2. By Freezing Technique

        15.5.3. By Product Type

        15.5.4. By Sales Channel

    15.6. Market Trends

    15.7. Key Market Participants - Intensity Mapping

    15.8. Drivers and Restraints - Impact Analysis

16. Oceania Market Analysis 2019 to 2023 and Forecast 2024 to 2034

    16.1. Introduction

    16.2. Pricing Analysis

    16.3. Historical Market Size (US$ billion) and Volume Trend Analysis By Market Taxonomy, 2019 to 2023

    16.4. Market Size (US$ billion) and Volume Forecast By Market Taxonomy, 2024 to 2034

        16.4.1. By Country

            16.4.1.1. Australia

            16.4.1.2. New Zealand

        16.4.2. By Freezing Technique

        16.4.3. By Product Type

        16.4.4. By Sales Channel

    16.5. Market Attractiveness Analysis

        16.5.1. By Country

        16.5.2. By Freezing Technique

        16.5.3. By Product Type

        16.5.4. By Sales Channel

    16.6. Market Trends

    16.7. Key Market Participants - Intensity Mapping

    16.8. Drivers and Restraints - Impact Analysis

17. Middle East and Africa Market Analysis 2019 to 2023 and Forecast 2024 to 2034

    17.1. Introduction

    17.2. Pricing Analysis

    17.3. Historical Market Size (US$ billion) and Volume Trend Analysis By Market Taxonomy, 2019 to 2023

    17.4. Market Size (US$ billion) and Volume Forecast By Market Taxonomy, 2024 to 2034

        17.4.1. By Country

            17.4.1.1. GCC Countries

            17.4.1.2. Turkiye

            17.4.1.3. Egypt

            17.4.1.4. South Africa

            17.4.1.5. Rest of Middle East and Africa

        17.4.2. By Freezing Technique

        17.4.3. By Product Type

        17.4.4. By Sales Channel

    17.5. Market Attractiveness Analysis

        17.5.1. By Country

        17.5.2. By Freezing Technique

        17.5.3. By Product Type

        17.5.4. By Sales Channel

    17.6. Market Trends

    17.7. Key Market Participants - Intensity Mapping

    17.8. Drivers and Restraints - Impact Analysis

18. Country-level Market Analysis

    18.1. Introduction

        18.1.1. Market Value Proportion Analysis, By Key Countries

        18.1.2. Global Vs. Country Growth Comparison

    18.2. United States Market Analysis

        18.2.1. By Freezing Technique

        18.2.2. By Product Type

        18.2.3. By Sales Channel

    18.3. Canada Market Analysis

        18.3.1. By Freezing Technique

        18.3.2. By Product Type

        18.3.3. By Sales Channel

    18.4. Brazil Market Analysis

        18.4.1. By Freezing Technique

        18.4.2. By Product Type

        18.4.3. By Sales Channel

    18.5. Mexico Market Analysis

        18.5.1. By Freezing Technique

        18.5.2. By Product Type

        18.5.3. By Sales Channel

    18.6. Argentina Market Analysis

        18.6.1. By Freezing Technique

        18.6.2. By Product Type

        18.6.3. By Sales Channel

    18.7. Germany Market Analysis

        18.7.1. By Freezing Technique

        18.7.2. By Product Type

        18.7.3. By Sales Channel

    18.8. United Kingdom Market Analysis

        18.8.1. By Freezing Technique

        18.8.2. By Product Type

        18.8.3. By Sales Channel

    18.9. France Market Analysis

        18.9.1. By Freezing Technique

        18.9.2. By Product Type

        18.9.3. By Sales Channel

    18.10. Italy Market Analysis

        18.10.1. By Freezing Technique

        18.10.2. By Product Type

        18.10.3. By Sales Channel

    18.11. Spain Market Analysis

        18.11.1. By Freezing Technique

        18.11.2. By Product Type

        18.11.3. By Sales Channel

    18.12. BENELUX Europe Market Analysis

        18.12.1. By Freezing Technique

        18.12.2. By Product Type

        18.12.3. By Sales Channel

    18.13. Nordic Market Analysis

        18.13.1. By Freezing Technique

        18.13.2. By Product Type

        18.13.3. By Sales Channel

    18.14. Russia Region Market Analysis

        18.14.1. By Freezing Technique

        18.14.2. By Product Type

        18.14.3. By Sales Channel

    18.15. Poland Market Analysis

        18.15.1. By Freezing Technique

        18.15.2. By Product Type

        18.15.3. By Sales Channel

    18.16. China Market Analysis

        18.16.1. By Freezing Technique

        18.16.2. By Product Type

        18.16.3. By Sales Channel

    18.17. Japan Market Analysis

        18.17.1. By Freezing Technique

        18.17.2. By Product Type

        18.17.3. By Sales Channel

    18.18. India Market Analysis

        18.18.1. By Freezing Technique

        18.18.2. By Product Type

        18.18.3. By Sales Channel

    18.19. Thailand Market Analysis

        18.19.1. By Freezing Technique

        18.19.2. By Product Type

        18.19.3. By Sales Channel

    18.20. Malaysia Market Analysis

        18.20.1. By Freezing Technique

        18.20.2. By Product Type

        18.20.3. By Sales Channel

    18.21. Indonesia Market Analysis

        18.21.1. By Freezing Technique

        18.21.2. By Product Type

        18.21.3. By Sales Channel

    18.22. Vietnam Market Analysis

        18.22.1. By Freezing Technique

        18.22.2. By Product Type

        18.22.3. By Sales Channel

    18.23. Philippines Market Analysis

        18.23.1. By Freezing Technique

        18.23.2. By Product Type

        18.23.3. By Sales Channel

    18.24. Singapore Market Analysis

        18.24.1. By Freezing Technique

        18.24.2. By Product Type

        18.24.3. By Sales Channel

    18.25. Australia Market Analysis

        18.25.1. By Freezing Technique

        18.25.2. By Product Type

        18.25.3. By Sales Channel

    18.26. New Zealand Market Analysis

        18.26.1. By Freezing Technique

        18.26.2. By Product Type

        18.26.3. By Sales Channel

    18.27. Turkiye Market Analysis

        18.27.1. By Freezing Technique

        18.27.2. By Product Type

        18.27.3. By Sales Channel

    18.28. GCC Countries Market Analysis

        18.28.1. By Freezing Technique

        18.28.2. By Product Type

        18.28.3. By Sales Channel

    18.29. Egypt Market Analysis

        18.29.1. By Freezing Technique

        18.29.2. By Product Type

        18.29.3. By Sales Channel

    18.30. South Africa Market Analysis

        18.30.1. By Freezing Technique

        18.30.2. By Product Type

        18.30.3. By Sales Channel

19. Market Structure Analysis

    19.1. Global Market Competition - a Dashboard View

    19.2. Global Market Structure Analysis

    19.3. Global Market Company Share Analysis

        19.3.1. For Tier 1 Market Players, 2024

        19.3.2. Company Market Share Analysis of Top 5 Players, By Region

    19.4. Key Participants Market Presence (Intensity Mapping) by Region

20. Competition Analysis

    20.1. Competition Benchmarking

    20.2. Competition Deep Dive

        20.2.1. Bellisio Foods Inc.

            20.2.1.1. Product Portfolio

            20.2.1.2. Revenue by Market Segments (Product/Channel/Region)

            20.2.1.3. Sales Footprint

            20.2.1.4. Strategy Overview

        20.2.2. General Mills Inc.

        20.2.3. Kellogg Company

        20.2.4. Grimway Farms

        20.2.5. Hanover Foods Corp

        20.2.6. ConAgra Foods, Inc.

        20.2.7. Seapoint Farms LLC

        20.2.8. Smith Frozen Foods Inc.

        20.2.9. Inventure Foods, Inc.

        20.2.10. Stahlbush Island Farms

        20.2.11. Seabrook Brothers & Sons Inc.

        20.2.12. Pinnacle Foods Inc.

        20.2.13. Goya Foods Inc.

        20.2.14. The Pictsweet Co.

        20.2.15. Other Players (On Additional Requests)

21. Assumptions and Acronyms Used

22. Research Methodology

List of Tables

Table 1: Global Market Value (US$ billion) Forecast by Region, 2019 to 2034

Table 2: Global Market Volume (MT) Forecast by Region, 2019 to 2034

Table 3: Global Market Value (US$ billion) Forecast by Sales Channel, 2019 to 2034

Table 4: Global Market Volume (MT) Forecast by Sales Channel, 2019 to 2034

Table 5: Global Market Value (US$ billion) Forecast by Product Type, 2019 to 2034

Table 6: Global Market Volume (MT) Forecast by Product Type, 2019 to 2034

Table 7: Global Market Value (US$ billion) Forecast by Freezing Technique, 2019 to 2034

Table 8: Global Market Volume (MT) Forecast by Freezing Technique, 2019 to 2034

Table 9: North America Market Value (US$ billion) Forecast by Country, 2019 to 2034

Table 10: North America Market Volume (MT) Forecast by Country, 2019 to 2034

Table 11: North America Market Value (US$ billion) Forecast by Sales Channel, 2019 to 2034

Table 12: North America Market Volume (MT) Forecast by Sales Channel, 2019 to 2034

Table 13: North America Market Value (US$ billion) Forecast by Product Type, 2019 to 2034

Table 14: North America Market Volume (MT) Forecast by Product Type, 2019 to 2034

Table 15: North America Market Value (US$ billion) Forecast by Freezing Technique, 2019 to 2034

Table 16: North America Market Volume (MT) Forecast by Freezing Technique, 2019 to 2034

Table 17: Latin America Market Value (US$ billion) Forecast by Country, 2019 to 2034

Table 18: Latin America Market Volume (MT) Forecast by Country, 2019 to 2034

Table 19: Latin America Market Value (US$ billion) Forecast by Sales Channel, 2019 to 2034

Table 20: Latin America Market Volume (MT) Forecast by Sales Channel, 2019 to 2034

Table 21: Latin America Market Value (US$ billion) Forecast by Product Type, 2019 to 2034

Table 22: Latin America Market Volume (MT) Forecast by Product Type, 2019 to 2034

Table 23: Latin America Market Value (US$ billion) Forecast by Freezing Technique, 2019 to 2034

Table 24: Latin America Market Volume (MT) Forecast by Freezing Technique, 2019 to 2034

Table 25: Europe Market Value (US$ billion) Forecast by Country, 2019 to 2034

Table 26: Europe Market Volume (MT) Forecast by Country, 2019 to 2034

Table 27: Europe Market Value (US$ billion) Forecast by Sales Channel, 2019 to 2034

Table 28: Europe Market Volume (MT) Forecast by Sales Channel, 2019 to 2034

Table 29: Europe Market Value (US$ billion) Forecast by Product Type, 2019 to 2034

Table 30: Europe Market Volume (MT) Forecast by Product Type, 2019 to 2034

Table 31: Europe Market Value (US$ billion) Forecast by Freezing Technique, 2019 to 2034

Table 32: Europe Market Volume (MT) Forecast by Freezing Technique, 2019 to 2034

Table 33: East Asia Market Value (US$ billion) Forecast by Country, 2019 to 2034

Table 34: East Asia Market Volume (MT) Forecast by Country, 2019 to 2034

Table 35: East Asia Market Value (US$ billion) Forecast by Sales Channel, 2019 to 2034

Table 36: East Asia Market Volume (MT) Forecast by Sales Channel, 2019 to 2034

Table 37: East Asia Market Value (US$ billion) Forecast by Product Type, 2019 to 2034

Table 38: East Asia Market Volume (MT) Forecast by Product Type, 2019 to 2034

Table 39: East Asia Market Value (US$ billion) Forecast by Freezing Technique, 2019 to 2034

Table 40: East Asia Market Volume (MT) Forecast by Freezing Technique, 2019 to 2034

Table 41: South Asia Market Value (US$ billion) Forecast by Country, 2019 to 2034

Table 42: South Asia Market Volume (MT) Forecast by Country, 2019 to 2034

Table 43: South Asia Market Value (US$ billion) Forecast by Sales Channel, 2019 to 2034

Table 44: South Asia Market Volume (MT) Forecast by Sales Channel, 2019 to 2034

Table 45: South Asia Market Value (US$ billion) Forecast by Product Type, 2019 to 2034

Table 46: South Asia Market Volume (MT) Forecast by Product Type, 2019 to 2034

Table 47: South Asia Market Value (US$ billion) Forecast by Freezing Technique, 2019 to 2034

Table 48: South Asia Market Volume (MT) Forecast by Freezing Technique, 2019 to 2034

Table 49: Oceania Market Value (US$ billion) Forecast by Country, 2019 to 2034

Table 50: Oceania Market Volume (MT) Forecast by Country, 2019 to 2034

Table 51: Oceania Market Value (US$ billion) Forecast by Sales Channel, 2019 to 2034

Table 52: Oceania Market Volume (MT) Forecast by Sales Channel, 2019 to 2034

Table 53: Oceania Market Value (US$ billion) Forecast by Product Type, 2019 to 2034

Table 54: Oceania Market Volume (MT) Forecast by Product Type, 2019 to 2034

Table 55: Oceania Market Value (US$ billion) Forecast by Freezing Technique, 2019 to 2034

Table 56: Oceania Market Volume (MT) Forecast by Freezing Technique, 2019 to 2034

Table 57: Middle East and Africa Market Value (US$ billion) Forecast by Country, 2019 to 2034

Table 58: Middle East and Africa Market Volume (MT) Forecast by Country, 2019 to 2034

Table 59: Middle East and Africa Market Value (US$ billion) Forecast by Sales Channel, 2019 to 2034

Table 60: Middle East and Africa Market Volume (MT) Forecast by Sales Channel, 2019 to 2034

Table 61: Middle East and Africa Market Value (US$ billion) Forecast by Product Type, 2019 to 2034

Table 62: Middle East and Africa Market Volume (MT) Forecast by Product Type, 2019 to 2034

Table 63: Middle East and Africa Market Value (US$ billion) Forecast by Freezing Technique, 2019 to 2034

Table 64: Middle East and Africa Market Volume (MT) Forecast by Freezing Technique, 2019 to 2034

List of Charts

Figure 1: Global Value (US$ billion) by Product Type, 2024 to 2034

Figure 2: Global Value (US$ billion) by Freezing Technique, 2024 to 2034

Figure 3: Global Value (US$ billion) by Sales Channel, 2024 to 2034

Figure 4: Global Value (US$ billion) by Region, 2024 to 2034

Figure 5: Global Value (US$ billion) Analysis by Region, 2019 to 2034

Figure 6: Global Volume (MT) Analysis by Region, 2019 to 2034

Figure 7: Global Value Share (%) and BPS Analysis by Region, 2024 to 2034

Figure 8: Global Y-o-Y Growth (%) Projections by Region, 2024 to 2034

Figure 9: Global Value (US$ billion) Analysis by Product Type, 2019 to 2034

Figure 10: Global Volume (MT) Analysis by Product Type, 2019 to 2034

Figure 11: Global Value Share (%) and BPS Analysis by Product Type, 2024 to 2034

Figure 12: Global Y-o-Y Growth (%) Projections by Product Type, 2024 to 2034

Figure 13: Global Value (US$ billion) Analysis by Freezing Technique, 2019 to 2034

Figure 14: Global Volume (MT) Analysis by Freezing Technique, 2019 to 2034

Figure 15: Global Value Share (%) and BPS Analysis by Freezing Technique, 2024 to 2034

Figure 16: Global Y-o-Y Growth (%) Projections by Freezing Technique, 2024 to 2034

Figure 17: Global Value (US$ billion) Analysis by Sales Channel, 2019 to 2034

Figure 18: Global Volume (MT) Analysis by Sales Channel, 2019 to 2034

Figure 19: Global Value Share (%) and BPS Analysis by Sales Channel, 2024 to 2034

Figure 20: Global Y-o-Y Growth (%) Projections by Sales Channel, 2024 to 2034

Figure 21: Global Attractiveness by Product Type, 2024 to 2034

Figure 22: Global Attractiveness by Freezing Technique, 2024 to 2034

Figure 23: Global Attractiveness by Sales Channel, 2024 to 2034

Figure 24: Global Attractiveness by Region, 2024 to 2034

Figure 25: North America Value (US$ billion) by Product Type, 2024 to 2034

Figure 26: North America Value (US$ billion) by Freezing Technique, 2024 to 2034

Figure 27: North America Value (US$ billion) by Sales Channel, 2024 to 2034

Figure 28: North America Value (US$ billion) by Country, 2024 to 2034

Figure 29: North America Value (US$ billion) Analysis by Country, 2019 to 2034

Figure 30: North America Volume (MT) Analysis by Country, 2019 to 2034

Figure 31: North America Value Share (%) and BPS Analysis by Country, 2024 to 2034

Figure 32: North America Y-o-Y Growth (%) Projections by Country, 2024 to 2034

Figure 33: North America Value (US$ billion) Analysis by Product Type, 2019 to 2034

Figure 34: North America Volume (MT) Analysis by Product Type, 2019 to 2034

Figure 35: North America Value Share (%) and BPS Analysis by Product Type, 2024 to 2034

Figure 36: North America Y-o-Y Growth (%) Projections by Product Type, 2024 to 2034

Figure 37: North America Value (US$ billion) Analysis by Freezing Technique, 2019 to 2034

Figure 38: North America Volume (MT) Analysis by Freezing Technique, 2019 to 2034

Figure 39: North America Value Share (%) and BPS Analysis by Freezing Technique, 2024 to 2034

Figure 40: North America Y-o-Y Growth (%) Projections by Freezing Technique, 2024 to 2034

Figure 41: North America Value (US$ billion) Analysis by Sales Channel, 2019 to 2034

Figure 42: North America Volume (MT) Analysis by Sales Channel, 2019 to 2034

Figure 43: North America Value Share (%) and BPS Analysis by Sales Channel, 2024 to 2034

Figure 44: North America Y-o-Y Growth (%) Projections by Sales Channel, 2024 to 2034

Figure 45: North America Attractiveness by Product Type, 2024 to 2034

Figure 46: North America Attractiveness by Freezing Technique, 2024 to 2034

Figure 47: North America Attractiveness by Sales Channel, 2024 to 2034

Figure 48: North America Attractiveness by Country, 2024 to 2034

Figure 49: Latin America Value (US$ billion) by Product Type, 2024 to 2034

Figure 50: Latin America Value (US$ billion) by Freezing Technique, 2024 to 2034

Figure 51: Latin America Value (US$ billion) by Sales Channel, 2024 to 2034

Figure 52: Latin America Value (US$ billion) by Country, 2024 to 2034

Figure 53: Latin America Value (US$ billion) Analysis by Country, 2019 to 2034

Figure 54: Latin America Volume (MT) Analysis by Country, 2019 to 2034

Figure 55: Latin America Value Share (%) and BPS Analysis by Country, 2024 to 2034

Figure 56: Latin America Y-o-Y Growth (%) Projections by Country, 2024 to 2034

Figure 57: Latin America Value (US$ billion) Analysis by Product Type, 2019 to 2034

Figure 58: Latin America Volume (MT) Analysis by Product Type, 2019 to 2034

Figure 59: Latin America Value Share (%) and BPS Analysis by Product Type, 2024 to 2034

Figure 60: Latin America Y-o-Y Growth (%) Projections by Product Type, 2024 to 2034

Figure 61: Latin America Value (US$ billion) Analysis by Freezing Technique, 2019 to 2034

Figure 62: Latin America Volume (MT) Analysis by Freezing Technique, 2019 to 2034

Figure 63: Latin America Value Share (%) and BPS Analysis by Freezing Technique, 2024 to 2034

Figure 64: Latin America Y-o-Y Growth (%) Projections by Freezing Technique, 2024 to 2034

Figure 65: Latin America Value (US$ billion) Analysis by Sales Channel, 2019 to 2034

Figure 66: Latin America Volume (MT) Analysis by Sales Channel, 2019 to 2034

Figure 67: Latin America Value Share (%) and BPS Analysis by Sales Channel, 2024 to 2034

Figure 68: Latin America Y-o-Y Growth (%) Projections by Sales Channel, 2024 to 2034

Figure 69: Latin America Attractiveness by Product Type, 2024 to 2034

Figure 70: Latin America Attractiveness by Freezing Technique, 2024 to 2034

Figure 71: Latin America Attractiveness by Sales Channel, 2024 to 2034

Figure 72: Latin America Attractiveness by Country, 2024 to 2034

Figure 73: Europe Value (US$ billion) by Product Type, 2024 to 2034

Figure 74: Europe Value (US$ billion) by Freezing Technique, 2024 to 2034

Figure 75: Europe Value (US$ billion) by Sales Channel, 2024 to 2034

Figure 76: Europe Value (US$ billion) by Country, 2024 to 2034

Figure 77: Europe Value (US$ billion) Analysis by Country, 2019 to 2034

Figure 78: Europe Volume (MT) Analysis by Country, 2019 to 2034

Figure 79: Europe Value Share (%) and BPS Analysis by Country, 2024 to 2034

Figure 80: Europe Y-o-Y Growth (%) Projections by Country, 2024 to 2034

Figure 81: Europe Value (US$ billion) Analysis by Product Type, 2019 to 2034

Figure 82: Europe Volume (MT) Analysis by Product Type, 2019 to 2034

Figure 83: Europe Value Share (%) and BPS Analysis by Product Type, 2024 to 2034

Figure 84: Europe Y-o-Y Growth (%) Projections by Product Type, 2024 to 2034

Figure 85: Europe Value (US$ billion) Analysis by Freezing Technique, 2019 to 2034

Figure 86: Europe Volume (MT) Analysis by Freezing Technique, 2019 to 2034

Figure 87: Europe Value Share (%) and BPS Analysis by Freezing Technique, 2024 to 2034

Figure 88: Europe Y-o-Y Growth (%) Projections by Freezing Technique, 2024 to 2034

Figure 89: Europe Value (US$ billion) Analysis by Sales Channel, 2019 to 2034

Figure 90: Europe Volume (MT) Analysis by Sales Channel, 2019 to 2034

Figure 91: Europe Value Share (%) and BPS Analysis by Sales Channel, 2024 to 2034

Figure 92: Europe Y-o-Y Growth (%) Projections by Sales Channel, 2024 to 2034

Figure 93: Europe Attractiveness by Product Type, 2024 to 2034

Figure 94: Europe Attractiveness by Freezing Technique, 2024 to 2034

Figure 95: Europe Attractiveness by Sales Channel, 2024 to 2034

Figure 96: Europe Attractiveness by Country, 2024 to 2034

Figure 97: East Asia Value (US$ billion) by Product Type, 2024 to 2034

Figure 98: East Asia Value (US$ billion) by Freezing Technique, 2024 to 2034

Figure 99: East Asia Value (US$ billion) by Sales Channel, 2024 to 2034

Figure 100: East Asia Value (US$ billion) by Country, 2024 to 2034

Figure 101: East Asia Value (US$ billion) Analysis by Country, 2019 to 2034

Figure 102: East Asia Volume (MT) Analysis by Country, 2019 to 2034

Figure 103: East Asia Value Share (%) and BPS Analysis by Country, 2024 to 2034

Figure 104: East Asia Y-o-Y Growth (%) Projections by Country, 2024 to 2034

Figure 105: East Asia Value (US$ billion) Analysis by Product Type, 2019 to 2034

Figure 106: East Asia Volume (MT) Analysis by Product Type, 2019 to 2034

Figure 107: East Asia Value Share (%) and BPS Analysis by Product Type, 2024 to 2034

Figure 108: East Asia Y-o-Y Growth (%) Projections by Product Type, 2024 to 2034

Figure 109: East Asia Value (US$ billion) Analysis by Freezing Technique, 2019 to 2034

Figure 110: East Asia Volume (MT) Analysis by Freezing Technique, 2019 to 2034

Figure 111: East Asia Value Share (%) and BPS Analysis by Freezing Technique, 2024 to 2034

Figure 112: East Asia Y-o-Y Growth (%) Projections by Freezing Technique, 2024 to 2034

Figure 113: East Asia Value (US$ billion) Analysis by Sales Channel, 2019 to 2034

Figure 114: East Asia Volume (MT) Analysis by Sales Channel, 2019 to 2034

Figure 115: East Asia Value Share (%) and BPS Analysis by Sales Channel, 2024 to 2034

Figure 116: East Asia Y-o-Y Growth (%) Projections by Sales Channel, 2024 to 2034

Figure 117: East Asia Attractiveness by Product Type, 2024 to 2034

Figure 118: East Asia Attractiveness by Freezing Technique, 2024 to 2034

Figure 119: East Asia Attractiveness by Sales Channel, 2024 to 2034

Figure 120: East Asia Attractiveness by Country, 2024 to 2034

Figure 121: South Asia Value (US$ billion) by Product Type, 2024 to 2034

Figure 122: South Asia Value (US$ billion) by Freezing Technique, 2024 to 2034

Figure 123: South Asia Value (US$ billion) by Sales Channel, 2024 to 2034

Figure 124: South Asia Value (US$ billion) by Country, 2024 to 2034

Figure 125: South Asia Value (US$ billion) Analysis by Country, 2019 to 2034

Figure 126: South Asia Volume (MT) Analysis by Country, 2019 to 2034

Figure 127: South Asia Value Share (%) and BPS Analysis by Country, 2024 to 2034

Figure 128: South Asia Y-o-Y Growth (%) Projections by Country, 2024 to 2034

Figure 129: South Asia Value (US$ billion) Analysis by Product Type, 2019 to 2034

Figure 130: South Asia Volume (MT) Analysis by Product Type, 2019 to 2034

Figure 131: South Asia Value Share (%) and BPS Analysis by Product Type, 2024 to 2034

Figure 132: South Asia Y-o-Y Growth (%) Projections by Product Type, 2024 to 2034

Figure 133: South Asia Value (US$ billion) Analysis by Freezing Technique, 2019 to 2034

Figure 134: South Asia Volume (MT) Analysis by Freezing Technique, 2019 to 2034

Figure 135: South Asia Value Share (%) and BPS Analysis by Freezing Technique, 2024 to 2034

Figure 136: South Asia Y-o-Y Growth (%) Projections by Freezing Technique, 2024 to 2034

Figure 137: South Asia Value (US$ billion) Analysis by Sales Channel, 2019 to 2034

Figure 138: South Asia Volume (MT) Analysis by Sales Channel, 2019 to 2034

Figure 139: South Asia Value Share (%) and BPS Analysis by Sales Channel, 2024 to 2034

Figure 140: South Asia Y-o-Y Growth (%) Projections by Sales Channel, 2024 to 2034

Figure 141: South Asia Attractiveness by Product Type, 2024 to 2034

Figure 142: South Asia Attractiveness by Freezing Technique, 2024 to 2034

Figure 143: South Asia Attractiveness by Sales Channel, 2024 to 2034

Figure 144: South Asia Attractiveness by Country, 2024 to 2034

Figure 145: Oceania Market Value (US$ billion) by Product Type, 2024 to 2034

Figure 146: Oceania Market Value (US$ billion) by Freezing Technique, 2024 to 2034

Figure 147: Oceania Market Value (US$ billion) by Sales Channel, 2024 to 2034

Figure 148: Oceania Market Value (US$ billion) by Country, 2024 to 2034

Figure 149: Oceania Market Value (US$ billion) Analysis by Country, 2019 to 2034

Figure 150: Oceania Market Volume (MT) Analysis by Country, 2019 to 2034

Figure 151: Oceania Market Value Share (%) and BPS Analysis by Country, 2024 to 2034

Figure 152: Oceania Market Y-o-Y Growth (%) Projections by Country, 2024 to 2034

Figure 153: Oceania Market Value (US$ billion) Analysis by Product Type, 2019 to 2034

Figure 154: Oceania Market Volume (MT) Analysis by Product Type, 2019 to 2034

Figure 155: Oceania Market Value Share (%) and BPS Analysis by Product Type, 2024 to 2034

Figure 156: Oceania Market Y-o-Y Growth (%) Projections by Product Type, 2024 to 2034

Figure 157: Oceania Market Value (US$ billion) Analysis by Freezing Technique, 2019 to 2034

Figure 158: Oceania Market Volume (MT) Analysis by Freezing Technique, 2019 to 2034

Figure 159: Oceania Market Value Share (%) and BPS Analysis by Freezing Technique, 2024 to 2034

Figure 160: Oceania Market Y-o-Y Growth (%) Projections by Freezing Technique, 2024 to 2034

Figure 161: Oceania Market Value (US$ billion) Analysis by Sales Channel, 2019 to 2034

Figure 162: Oceania Market Volume (MT) Analysis by Sales Channel, 2019 to 2034

Figure 163: Oceania Market Value Share (%) and BPS Analysis by Sales Channel, 2024 to 2034

Figure 164: Oceania Market Y-o-Y Growth (%) Projections by Sales Channel, 2024 to 2034

Figure 165: Oceania Market Attractiveness by Product Type, 2024 to 2034

Figure 166: Oceania Market Attractiveness by Freezing Technique, 2024 to 2034

Figure 167: Oceania Market Attractiveness by Sales Channel, 2024 to 2034

Figure 168: Oceania Market Attractiveness by Country, 2024 to 2034

Figure 169: Middle East and Africa Value (US$ billion) by Product Type, 2024 to 2034

Figure 170: Middle East and Africa Value (US$ billion) by Freezing Technique, 2024 to 2034

Figure 171: Middle East and Africa Value (US$ billion) by Sales Channel, 2024 to 2034

Figure 172: Middle East and Africa Value (US$ billion) by Country, 2024 to 2034

Figure 173: Middle East and Africa Value (US$ billion) Analysis by Country, 2019 to 2034

Figure 174: Middle East and Africa Volume (MT) Analysis by Country, 2019 to 2034

Figure 175: Middle East and Africa Value Share (%) and BPS Analysis by Country, 2024 to 2034

Figure 176: Middle East and Africa Y-o-Y Growth (%) Projections by Country, 2024 to 2034

Figure 177: Middle East and Africa Value (US$ billion) Analysis by Product Type, 2019 to 2034

Figure 178: Middle East and Africa Volume (MT) Analysis by Product Type, 2019 to 2034

Figure 179: Middle East and Africa Value Share (%) and BPS Analysis by Product Type, 2024 to 2034

Figure 180: Middle East and Africa Y-o-Y Growth (%) Projections by Product Type, 2024 to 2034

Figure 181: Middle East and Africa Value (US$ billion) Analysis by Freezing Technique, 2019 to 2034

Figure 182: Middle East and Africa Volume (MT) Analysis by Freezing Technique, 2019 to 2034

Figure 183: Middle East and Africa Value Share (%) and BPS Analysis by Freezing Technique, 2024 to 2034

Figure 184: Middle East and Africa Y-o-Y Growth (%) Projections by Freezing Technique, 2024 to 2034

Figure 185: Middle East and Africa Value (US$ billion) Analysis by Sales Channel, 2019 to 2034

Figure 186: Middle East and Africa Volume (MT) Analysis by Sales Channel, 2019 to 2034

Figure 187: Middle East and Africa Value Share (%) and BPS Analysis by Sales Channel, 2024 to 2034

Figure 188: Middle East and Africa Y-o-Y Growth (%) Projections by Sales Channel, 2024 to 2034

Figure 189: Middle East and Africa Attractiveness by Product Type, 2024 to 2034

Figure 190: Middle East and Africa Attractiveness by Freezing Technique, 2024 to 2034

Figure 191: Middle East and Africa Attractiveness by Sales Channel, 2024 to 2034

Figure 192: Middle East and Africa Attractiveness by Country, 2024 to 2034

Recommendations

Food and Beverage

Food and Beverage Additive Market

Published : April 2024

Food and Beverage

Frozen Yogurt Market

Published : March 2024

Food and Beverage

Frozen Seafood Market

Published : January 2024

Food and Beverage

Frozen Bakery Market

Published : April 2023

Explore Food and Beverage Insights

View Reports