Frozen Food Market
Are Frozen Foods the Only Answer to Convenience/Lazy Cooking? Know How Companies are Capitalizing on this with FMI!
Frozen Food Market by Type, Category, Distribution Channel, Freezing Technique & Region - Forecast 2022 - 2032
Frozen Food Market Snapshot (2022-2032)
[289 Pages Report] The global frozen food market is anticipated to be valued at US$ 314,285 Million in 2022, forecast to grow at a CAGR of 6.7% to be valued at US$ 602,257 Million from 2022 to 2032. Growth is attributed to increasing consumer preferences for ready-to-prepare food. From 2016-2021 a CAGR of 6.0% was registered for the frozen food market.
Food preservation has been an ancient practice that humans use to prevent the spoilage of food items or products. The practice is motivated by the surplus food items within the clement season and the shortage of food during winter.
Data Points |
Key Statistics |
Growth Rate (2016-2021) |
6.0% CAGR |
Projected Growth Rate (2022-2032) |
6.7% CAGR |
Expected Market Value (2022) |
US$ 314,285 Million |
Anticipated Forecast Value (2032) |
US$ 602,257 Million |
Preservation via drying, salting, and smoking has been an old practice. However, the innovation of technology has replaced such practices since it can’t be used for preserving some food items like vegetables, fruits, and uncooked meat or seafood.
The use of refrigerators or freezers has enhanced food preservation in the industrial age as both cooked and uncooked food items can be stored in them. Frozen foods are food items such as seafood, meat & poultry, vegetable & fruits convenience foods, and more that are preserved under low temperatures for future usage.
Let us know your requirement to get
100% FREE customization
Which are Some Prominent Drivers Spearheading Frozen Food Market Growth?
Frozen Food Sales spiking on account of rising demand for Convenience Foods
The change in consumer lifestyle has prompted the need for the provision of convenience food globally. And this has fostered the rise in demand for frozen foods in the global market. Also, the rise in the number of working women, coupled with the growing number of single-person households has been a significant factor that will drive the tremendous growth of the frozen foods market over the forecast period. It’s now a global norm to consume frozen foods daily due to the change in lifestyle.
The frozen food market is capitalizing on this consumer sentiment to increase the production of health-befitting products. The dairy industry in this sector is manufacturing products with low sugar content and minimal processing. Diary based frozen foods like yogurt, ice cream are a rich source of vitamin D, phosphorus, and calcium. This will boost the growth of the market.
Consumers around the world are inclined towards ready-to-eat food products due to the busy lifestyle and lack of time to prepare food of their choice. These factors led to increased consumption of convenience foods, in turn, increasing the demand for frozen food.
What are the Challenges Faced by the Frozen Food Industry?
Increase in Awareness Regarding the Health Benefits of Frozen Foods
Although the frozen food market has numerous end-uses, there are numerous obstacles that likely pose a challenge to market growth. The growing popularity of fresh food may hinder the growth of the frozen food market. Also, health issues related to more use of frozen food like diabetes, and heart disease may also impede the growth of the frozen food market.
Today’s on the go consumers are on the watch of their health and are ready to spend on health-enhancing products. With the increase in the awareness of the health benefits associated with frozen foods consumption, the market is expected to experience an inclination globally over the forecast period.
Find your sweet spots for generating winning opportunities in this market.
Talk to AnalystWhy is North America Emerging as an Opportunistic Frozen Food Market?
Growing Popularity of Instant Food in The Region Provide Opportunity for The Growth of the Frozen Food Market in The Region
According to FMI, North America dominates the frozen food market. The market accounts for 33.4% of the total global frozen food market in 2032. The frozen food market is expected to rise in the region due to technological advancements in cost-effective food production.
Growing consumer demand and capital investment driven by a massive population base and the resultant demand for instant food is exponentially helping the market of frozen food to grow in the region. The growing popularity of frozen food items like frozen pizza, frozen french-fries in the youngster to boost the growth of the market
The rising demand for healthy and instant fast food is driving the demand for frozen food and is also expected to bolster growth in the region as leading manufacturers seek to implement geographic expansion strategies. For instance, Angie's BOOMCHICKAPOP, a brand of Conagra Brands, Inc. introduced two new snacks: Sea Salt Air-Popped Popcorn and White Cheddar Puffs. The Sea Salt Air-Popped popcorn joins the lineup of the brand's existing ready-to-eat popcorn varieties.
How is Europe Contributing to the Growth of the Frozen Food Market?
Growing Trend of Ready-To-Eat Food in The Region to Boost the Growth of the Market
According to Future Market Insights, Europe is expected to provide immense growth opportunities for the frozen food market, due to the growing food and beverage industry in the region. Europe’s frozen food market accounts for 40.9% share of the total global market.
Europe has the largest market in the global frozen food market with the transformation in consumers’ attitudes towards frozen food within the region. Consumption of frozen food within the European Union countries has increased tremendously due to the improvement in the standard of living and shift towards a convenient lifestyle.
Rising urbanization increased disposable income, and changing food habits of consumers all contribute to the market's expected growth. Furthermore, the increased desire for quick food, as well as the freshness and nutritional content of these items, is helping the frozen food market to rise in Europe.

A unified Market Research Subscription Platform, built for today's disparate research needs.
Will the Asia Pacific emerge as an Attractive Frozen Food Market?
The Asia Pacific is anticipated to exhibit a significant growth rate in the frozen food market over the forecast period. The growth of the market in the region is attributed to the growing trend of ready-to-eat food in the working population.
The rise in disposable income of countries like China, India, and Japan is another force driving the growth of the global frozen food market within the Asia Pacific region.
The presence of leading market player in the region drive the growth of the market in Asia Pacific. For Instance, in September 2022 Cargill inaugurates its corn wet mill in Pandaan, Pasuruan, Surabaya, in an effort to meet the growing demand in starches, sweeteners and feeds markets in Asia and Indonesia. This is also expected to benefit local economy by creating up to 4,000 new jobs and employment opportunities, and help with the development of Indonesia’s food and beverage industry.
Start-up Scenario
The new entrants in the global essential oils and oleoresins are continually indulging in several collaborations and highly investing in research and development activities to provide more convenient solutions to industry verticals. Some of the major start-ups that are leading the development of the market are EFCPL, Sushil Frozen Agro Processing Pvt. Ltd., Forstar, Nutririte Food Private Limited, and Taj Frozen Foods India Ltd.
- EFCPL – is an India based Manufacturer and Exporter of Ready to Cook and Ready to Eat frozen food. With over 200 plus menu items including breakfast, lunch, dinner, snack items of Authentic Pan Indian Cuisine. All the recipes have been specially curated by home chefs to retain he authenticity in taste.
- Iscon Balaji is a prominent packaged and frozen food brand that was launched in 2012. The brand has Balaji Wafers as its parent company and has its headquarters in Ahmedabad, Gujarat. It mainly retails potato-based products such as french fries, potato chips, frozen patties, cheese balls, etc.
Market Competition
Some of the key participants present in the global frozen food market include
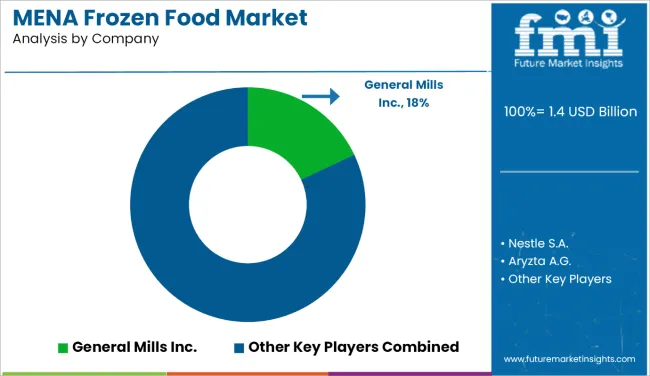
Aryzta A.G., Ajinomoto Co. Inc., Cargill Incorporated, General Mills Inc., JBS S.A., Kellogg Company, the Kraft Heinz Company, Nestle S.A., ConAgra Brands, Inc., Associated British Foods Plc among others.
Attributed to the presence of such a high number of participants, the market is highly competitive. While global players such as Aryzta A.G., Ajinomoto Co. Inc., Cargill Incorporated, General Mills Inc., JBS S.A. account for considerable market size, several regional level players are also operating across key growth regions, particularly in the Asia Pacific.
- In September 2022 – Cargill partnered with the Singapore Economic Development Board (EDB) to launch its first digital business studio in Asia. The studio is designed to support local founders with investments that bring Cargill solutions to the market and accelerate innovation for the food and agriculture industry in Asia-Pacific.
- In June 2022 - Conagra Brands Inc. announced the opening of its new vegetable processing plant in Waseca, Minn. The new 245,000 square foot facility, which processes fresh vegetables to support Conagra's frozen meals business and Birds Eye brand, was built from the ground up with a focus on maximizing automation to create greater efficiencies and enhancing food safety throughout.
Report Scope
Report Attribute |
Details |
Growth Rate |
CAGR of 6.7% from 2022 to 2032 |
Expected Market Value (2022) |
US$ 314,285 Million |
Anticipated Forecast Value (2032) |
US$ 602,257 Million |
Base Year for Estimation |
2021 |
Historical Data |
2016-2021 |
Forecast Period |
2022-2032 |
Quantitative Units |
Revenue in US$ Million, and CAGR from 2022-2032 |
Report Coverage |
Revenue Forecast, Company Ranking, Competitive Landscape, Growth Factors, Trends and Pricing Analysis |
Segments Covered |
|
Regions Covered |
|
Key Countries Profiled |
|
Key Companies Profiled |
|
Report Customization & Pricing |
Available Upon Request |
Key Segments Profiled in the Frozen Food Industry
Frozen Food Market by Type:
- Frozen Fruits and Vegetables
- Frozen Meat and Fish
- Frozen Desert
- Frozen Snacks
- Frozen Cooked Ready Meals
- Other Frozen Food Types
Frozen Food Market by Category:
- Ready to eat Frozen Food
- Ready to cook Frozen Food
- Ready to drink Frozen Food
- Others Frozen Food Categories
Frozen Food Market by Distribution Channel:
- Frozen Food in Supermarkets & Hypermarkets
- Frozen Food in Convenience Stores
- Frozen Food in Online Channels
- Frozen Food in Others
Frozen Food Market by Freezing Technique:
- Blast Freezing of Foods
- Belt Freezing of Foods
- Individual Quick Freezing (IQF) of Foods
- Others Freezing Techniques
Frozen Food Market by Region:
- North America Frozen Food Market
- Latin America Frozen Food Market
- Europe Frozen Food Market
- Asia Pacific Frozen Food Market
- Middle East and Africa Frozen Food Market
Frequently Asked Questions
What is the anticipated growth of the frozen food market until 2032?
FMI projects the global frozen food market to expand at a 6.7% value CAGR by 2032
Which region is forecast to be the most lucrative for frozen food market growth?
North America is expected to be the most opportunistic with a 33.4% share of the total frozen food market
Which are some prominent frozen food market manufacturers?
Aryzta A.G., Ajinomoto Co. Inc., Cargill Incorporated, General Mills Inc., JBS S.A. are some prominent frozen food manufacturers.
Table of Content
1. Executive Summary 1.1. Global Market Outlook 1.2. Demand-side Trends 1.3. Supply-side Trends 1.4. Technology Roadmap Analysis 1.5. Analysis and Recommendations 2. Market Overview 2.1. Market Coverage / Taxonomy 2.2. Market Definition / Scope / Limitations 3. Market Background 3.1. Market Dynamics 3.1.1. Drivers 3.1.2. Restraints 3.1.3. Opportunity 3.1.4. Trends 3.2. Scenario Forecast 3.2.1. Demand in Optimistic Scenario 3.2.2. Demand in Likely Scenario 3.2.3. Demand in Conservative Scenario 3.3. Opportunity Map Analysis 3.4. Product Life Cycle Analysis 3.5. Supply Chain Analysis 3.5.1. Supply Side Participants and their Roles 3.5.1.1. Producers 3.5.1.2. Mid-Level Participants (Traders/ Agents/ Brokers) 3.5.1.3. Wholesalers and Distributors 3.5.2. Value Added and Value Created at Node in the Supply Chain 3.5.3. List of Raw Material Suppliers 3.5.4. List of Existing and Potential Buyer’s 3.6. Investment Feasibility Matrix 3.7. Value Chain Analysis 3.7.1. Profit Margin Analysis 3.7.2. Wholesalers and Distributors 3.7.3. Retailers 3.8. PESTLE and Porter’s Analysis 3.9. Regulatory Landscape 3.9.1. By Key Regions 3.9.2. By Key Countries 3.10. Regional Parent Market Outlook 3.11. Production and Consumption Statistics 3.12. Import and Export Statistics 4. Global Market Analysis 2016-2021 and Forecast, 2022-2032 4.1. Historical Market Size Value (US$ Mn) & Volume (Kg) Analysis, 2016-2021 4.2. Current and Future Market Size Value (US$ Mn) & Volume (Kg) Projections, 2022-2032 4.2.1. Y-o-Y Growth Trend Analysis 4.2.2. Absolute $ Opportunity Analysis 5. Global Market Analysis 2016-2021 and Forecast 2022-2032, By Type 5.1. Introduction / Key Findings 5.2. Historical Market Size Value (US$ Mn) & Volume (Kg) Analysis By Type, 2016-2021 5.3. Current and Future Market Size Value (US$ Mn) & Volume (Kg) Analysis and Forecast By Type, 2022-2032 5.3.1. Frozen Fruits and Vegetables 5.3.2. Frozen Meat and Fish 5.3.3. Frozen Desert 5.3.4. Frozen Snacks 5.3.5. Frozen Cooked Ready Meals 5.3.6. Other 5.4. Y-o-Y Growth Trend Analysis By Type, 2016-2021 5.5. Absolute $ Opportunity Analysis By Type, 2022-2032 6. Global Market Analysis 2016-2021 and Forecast 2022-2032, By Category 6.1. Introduction / Key Findings 6.2. Historical Market Size Value (US$ Mn) & Volume (Kg) Analysis By Category, 2016-2021 6.3. Current and Future Market Size Value (US$ Mn) & Volume (Kg) Analysis and Forecast By Category, 2022-2032 6.3.1. Ready to Eat 6.3.2. Ready to Cook 6.3.3. Ready to Drink 6.3.4. Others 6.4. Y-o-Y Growth Trend Analysis By Category, 2016-2021 6.5. Absolute $ Opportunity Analysis By Category, 2022-2032 7. Global Market Analysis 2016-2021 and Forecast 2022-2032, By Distribution Channel 7.1. Introduction / Key Findings 7.2. Historical Market Size Value (US$ Mn) & Volume (Kg) Analysis By Distribution Channel, 2016-2021 7.3. Current and Future Market Size Value (US$ Mn) & Volume (Kg) Analysis and Forecast By Distribution Channel, 2022-2032 7.3.1. Supermarkets & Hypermarkets 7.3.2. Convenience Stores 7.3.3. Online Channels 7.3.4. Others 7.4. Y-o-Y Growth Trend Analysis By Distribution Channel, 2016-2021 7.5. Absolute $ Opportunity Analysis By Distribution Channel, 2022-2032 8. Global Market Analysis 2016-2021 and Forecast 2022-2032, By Freezing Technique 8.1. Introduction / Key Findings 8.2. Historical Market Size Value (US$ Mn) & Volume (Kg) Analysis By Freezing Technique, 2016-2021 8.3. Current and Future Market Size Value (US$ Mn) & Volume (Kg) Analysis and Forecast By Freezing Technique, 2022-2032 8.3.1. Blast freezing 8.3.2. Belt Freezing 8.3.3. Individual Quick Freezing 8.3.4. Others 8.4. Y-o-Y Growth Trend Analysis By Freezing Technique, 2016-2021 8.5. Absolute $ Opportunity Analysis By Freezing Technique, 2022-2032 9. Global Market Analysis 2016-2021 and Forecast 2022-2032, By Region 9.1. Introduction 9.2. Historical Market Size Value (US$ Mn) & Volume (Kg) Analysis By Region, 2016-2021 9.3. Current Market Size Value (US$ Mn) & Volume (Kg) Analysis and Forecast By Region, 2022-2032 9.3.1. North America 9.3.2. Latin America 9.3.3. Europe 9.3.4. Asia Pacific 9.3.5. MEA 9.4. Market Attractiveness Analysis By Region 10. North America Market Analysis 2016-2021 and Forecast 2022-2032, By Country 10.1. Historical Market Size Value (US$ Mn) & Volume (Kg) Trend Analysis By Market Taxonomy, 2016-2021 10.2. Market Size Value (US$ Mn) & Volume (Kg) Forecast By Market Taxonomy, 2022-2032 10.2.1. By Country 10.2.1.1. U.S. 10.2.1.2. Canada 10.2.2. By Type 10.2.3. By Category 10.2.4. By Distribution Channel 10.2.5. By Freezing Technique 10.3. Market Attractiveness Analysis 10.3.1. By Country 10.3.2. By Type 10.3.3. By Category 10.3.4. By Distribution Channel 10.3.5. By Freezing Technique 10.4. Key Takeaways 11. Latin America Market Analysis 2016-2021 and Forecast 2022-2032, By Country 11.1. Historical Market Size Value (US$ Mn) & Volume (Kg) Trend Analysis By Market Taxonomy, 2016-2021 11.2. Market Size Value (US$ Mn) & Volume (Kg) Forecast By Market Taxonomy, 2022-2032 11.2.1. By Country 11.2.1.1. Brazil 11.2.1.2. Mexico 11.2.1.3. Rest of Latin America 11.2.2. By Type 11.2.3. By Category 11.2.4. By Distribution Channel 11.2.5. By Freezing Technique 11.3. Market Attractiveness Analysis 11.3.1. By Country 11.3.2. By Type 11.3.3. By Category 11.3.4. By Distribution Channel 11.3.5. By Freezing Technique 11.4. Key Takeaways 12. Europe Market Analysis 2016-2021 and Forecast 2022-2032, By Country 12.1. Historical Market Size Value (US$ Mn) & Volume (Kg) Trend Analysis By Market Taxonomy, 2016-2021 12.2. Market Size Value (US$ Mn) & Volume (Kg) Forecast By Market Taxonomy, 2022-2032 12.2.1. By Country 12.2.1.1. Germany 12.2.1.2. U.K. 12.2.1.3. France 12.2.1.4. Spain 12.2.1.5. Italy 12.2.1.6. Rest of Europe 12.2.2. By Type 12.2.3. By Category 12.2.4. By Distribution Channel 12.2.5. By Freezing Technique 12.3. Market Attractiveness Analysis 12.3.1. By Country 12.3.2. By Type 12.3.3. By Category 12.3.4. By Distribution Channel 12.3.5. By Freezing Technique 12.4. Key Takeaways 13. Asia Pacific Market Analysis 2016-2021 and Forecast 2022-2032, By Country 13.1. Historical Market Size Value (US$ Mn) & Volume (Kg) Trend Analysis By Market Taxonomy, 2016-2021 13.2. Market Size Value (US$ Mn) & Volume (Kg) Forecast By Market Taxonomy, 2022-2032 13.2.1. By Country 13.2.1.1. China 13.2.1.2. Japan 13.2.1.3. South Korea 13.2.1.4. Malaysia 13.2.1.5. Singapore 13.2.1.6. Australia 13.2.1.7. New Zealand 13.2.1.8. Rest of APAC 13.2.2. By Type 13.2.3. By Category 13.2.4. By Distribution Channel 13.2.5. By Freezing Technique 13.3. Market Attractiveness Analysis 13.3.1. By Country 13.3.2. By Type 13.3.3. By Category 13.3.4. By Distribution Channel 13.3.5. By Freezing Technique 13.4. Key Takeaways 14. MEA Market Analysis 2016-2021 and Forecast 2022-2032, By Country 14.1. Historical Market Size Value (US$ Mn) & Volume (Kg) Trend Analysis By Market Taxonomy, 2016-2021 14.2. Market Size Value (US$ Mn) & Volume (Kg) Forecast By Market Taxonomy, 2022-2032 14.2.1. By Country 14.2.1.1. GCC Countries 14.2.1.2. South Africa 14.2.1.3. Israel 14.2.1.4. Rest of MEA 14.2.2. By Type 14.2.3. By Category 14.2.4. By Distribution Channel 14.2.5. By Freezing Technique 14.3. Market Attractiveness Analysis 14.3.1. By Country 14.3.2. By Type 14.3.3. By Category 14.3.4. By Distribution Channel 14.3.5. By Freezing Technique 14.4. Key Takeaways 15. Key Countries Market Analysis 15.1. U.S. 15.1.1. Pricing Analysis 15.1.2. Market Share Analysis, 2021 15.1.2.1. By Type 15.1.2.2. By Category 15.1.2.3. By Distribution Channel 15.1.2.4. By Freezing Technique 15.2. Canada 15.2.1. Pricing Analysis 15.2.2. Market Share Analysis, 2021 15.2.2.1. By Type 15.2.2.2. By Category 15.2.2.3. By Distribution Channel 15.2.2.4. By Freezing Technique 15.3. Brazil 15.3.1. Pricing Analysis 15.3.2. Market Share Analysis, 2021 15.3.2.1. By Type 15.3.2.2. By Category 15.3.2.3. By Distribution Channel 15.3.2.4. By Freezing Technique 15.4. Mexico 15.4.1. Pricing Analysis 15.4.2. Market Share Analysis, 2021 15.4.2.1. By Type 15.4.2.2. By Category 15.4.2.3. By Distribution Channel 15.4.2.4. By Freezing Technique 15.5. Germany 15.5.1. Pricing Analysis 15.5.2. Market Share Analysis, 2021 15.5.2.1. By Type 15.5.2.2. By Category 15.5.2.3. By Distribution Channel 15.5.2.4. By Freezing Technique 15.6. U.K. 15.6.1. Pricing Analysis 15.6.2. Market Share Analysis, 2021 15.6.2.1. By Type 15.6.2.2. By Category 15.6.2.3. By Distribution Channel 15.6.2.4. By Freezing Technique 15.7. France 15.7.1. Pricing Analysis 15.7.2. Market Share Analysis, 2021 15.7.2.1. By Type 15.7.2.2. By Category 15.7.2.3. By Distribution Channel 15.7.2.4. By Freezing Technique 15.8. Spain 15.8.1. Pricing Analysis 15.8.2. Market Share Analysis, 2021 15.8.2.1. By Type 15.8.2.2. By Category 15.8.2.3. By Distribution Channel 15.8.2.4. By Freezing Technique 15.9. Italy 15.9.1. Pricing Analysis 15.9.2. Market Share Analysis, 2021 15.9.2.1. By Type 15.9.2.2. By Category 15.9.2.3. By Distribution Channel 15.9.2.4. By Freezing Technique 15.10. China 15.10.1. Pricing Analysis 15.10.2. Market Share Analysis, 2021 15.10.2.1. By Type 15.10.2.2. By Category 15.10.2.3. By Distribution Channel 15.10.2.4. By Freezing Technique 15.11. Japan 15.11.1. Pricing Analysis 15.11.2. Market Share Analysis, 2021 15.11.2.1. By Type 15.11.2.2. By Category 15.11.2.3. By Distribution Channel 15.11.2.4. By Freezing Technique 15.12. South Korea 15.12.1. Pricing Analysis 15.12.2. Market Share Analysis, 2021 15.12.2.1. By Type 15.12.2.2. By Category 15.12.2.3. By Distribution Channel 15.12.2.4. By Freezing Technique 15.13. Malaysia 15.13.1. Pricing Analysis 15.13.2. Market Share Analysis, 2021 15.13.2.1. By Type 15.13.2.2. By Category 15.13.2.3. By Distribution Channel 15.13.2.4. By Freezing Technique 15.14. Singapore 15.14.1. Pricing Analysis 15.14.2. Market Share Analysis, 2021 15.14.2.1. By Type 15.14.2.2. By Category 15.14.2.3. By Distribution Channel 15.14.2.4. By Freezing Technique 15.15. Australia 15.15.1. Pricing Analysis 15.15.2. Market Share Analysis, 2021 15.15.2.1. By Type 15.15.2.2. By Category 15.15.2.3. By Distribution Channel 15.15.2.4. By Freezing Technique 15.16. New Zealand 15.16.1. Pricing Analysis 15.16.2. Market Share Analysis, 2021 15.16.2.1. By Type 15.16.2.2. By Category 15.16.2.3. By Distribution Channel 15.16.2.4. By Freezing Technique 15.17. GCC Countries 15.17.1. Pricing Analysis 15.17.2. Market Share Analysis, 2021 15.17.2.1. By Type 15.17.2.2. By Category 15.17.2.3. By Distribution Channel 15.17.2.4. By Freezing Technique 15.18. South Africa 15.18.1. Pricing Analysis 15.18.2. Market Share Analysis, 2021 15.18.2.1. By Type 15.18.2.2. By Category 15.18.2.3. By Distribution Channel 15.18.2.4. By Freezing Technique 15.19. Israel 15.19.1. Pricing Analysis 15.19.2. Market Share Analysis, 2021 15.19.2.1. By Type 15.19.2.2. By Category 15.19.2.3. By Distribution Channel 15.19.2.4. By Freezing Technique 16. Market Structure Analysis 16.1. Competition Dashboard 16.2. Competition Benchmarking 16.3. Market Share Analysis of Top Players 16.3.1. By Regional 16.3.2. By Type 16.3.3. By Category 16.3.4. By Distribution Channel 16.3.5. By Freezing Technique 17. Competition Analysis 17.1. Competition Deep Dive 17.1.1. Aryzta A.G. 17.1.1.1. Overview 17.1.1.2. Product Portfolio 17.1.1.3. Profitability by Market Segments 17.1.1.4. Sales Footprint 17.1.1.5. Strategy Overview 17.1.1.5.1. Marketing Strategy 17.1.1.5.2. Product Strategy 17.1.1.5.3. Channel Strategy 17.1.2. Ajinomoto Co. Inc. 17.1.2.1. Overview 17.1.2.2. Product Portfolio 17.1.2.3. Profitability by Market Segments 17.1.2.4. Sales Footprint 17.1.2.5. Strategy Overview 17.1.2.5.1. Marketing Strategy 17.1.2.5.2. Product Strategy 17.1.2.5.3. Channel Strategy 17.1.3. Cargill Incorporated 17.1.3.1. Overview 17.1.3.2. Product Portfolio 17.1.3.3. Profitability by Market Segments 17.1.3.4. Sales Footprint 17.1.3.5. Strategy Overview 17.1.3.5.1. Marketing Strategy 17.1.3.5.2. Product Strategy 17.1.3.5.3. Channel Strategy 17.1.4. General Mills Inc. 17.1.4.1. Overview 17.1.4.2. Product Portfolio 17.1.4.3. Profitability by Market Segments 17.1.4.4. Sales Footprint 17.1.4.5. Strategy Overview 17.1.4.5.1. Marketing Strategy 17.1.4.5.2. Product Strategy 17.1.4.5.3. Channel Strategy 17.1.5. General Mills Inc. 17.1.5.1. Overview 17.1.5.2. Product Portfolio 17.1.5.3. Profitability by Market Segments 17.1.5.4. Sales Footprint 17.1.5.5. Strategy Overview 17.1.5.5.1. Marketing Strategy 17.1.5.5.2. Product Strategy 17.1.5.5.3. Channel Strategy 17.1.6. JBS S.A. 17.1.6.1. Overview 17.1.6.2. Product Portfolio 17.1.6.3. Profitability by Market Segments 17.1.6.4. Sales Footprint 17.1.6.5. Strategy Overview 17.1.6.5.1. Marketing Strategy 17.1.6.5.2. Product Strategy 17.1.6.5.3. Channel Strategy 17.1.7. Kellogg Company 17.1.7.1. Overview 17.1.7.2. Product Portfolio 17.1.7.3. Profitability by Market Segments 17.1.7.4. Sales Footprint 17.1.7.5. Strategy Overview 17.1.7.5.1. Marketing Strategy 17.1.7.5.2. Product Strategy 17.1.7.5.3. Channel Strategy 17.1.8. The Kraft Heinz Company 17.1.8.1. Overview 17.1.8.2. Product Portfolio 17.1.8.3. Profitability by Market Segments 17.1.8.4. Sales Footprint 17.1.8.5. Strategy Overview 17.1.8.5.1. Marketing Strategy 17.1.8.5.2. Product Strategy 17.1.8.5.3. Channel Strategy 17.1.9. Nestle S.A. 17.1.9.1. Overview 17.1.9.2. Product Portfolio 17.1.9.3. Profitability by Market Segments 17.1.9.4. Sales Footprint 17.1.9.5. Strategy Overview 17.1.9.5.1. Marketing Strategy 17.1.9.5.2. Product Strategy 17.1.9.5.3. Channel Strategy 17.1.10. ConAgra Brands, Inc. 17.1.10.1. Overview 17.1.10.2. Product Portfolio 17.1.10.3. Profitability by Market Segments 17.1.10.4. Sales Footprint 17.1.10.5. Strategy Overview 17.1.10.5.1. Marketing Strategy 17.1.10.5.2. Product Strategy 17.1.10.5.3. Channel Strategy 17.1.11. Associated British Foods Plc. 17.1.11.1. Overview 17.1.11.2. Product Portfolio 17.1.11.3. Profitability by Market Segments 17.1.11.4. Sales Footprint 17.1.11.5. Strategy Overview 17.1.11.5.1. Marketing Strategy 17.1.11.5.2. Product Strategy 17.1.11.5.3. Channel Strategy 18. Assumptions & Acronyms Used 19. Research Methodology
Let us know your requirement to get
100% FREE customization
List of Tables
Table 1: Global Market Value (US$ Mn) Forecast by Region, 2016-2032 Table 2: Global Market Volume (Kg) Forecast by Region, 2016-2032 Table 3: Global Market Value (US$ Mn) Forecast by Type, 2016-2032 Table 4: Global Market Volume (Kg) Forecast by Type, 2016-2032 Table 5: Global Market Value (US$ Mn) Forecast by Category, 2016-2032 Table 6: Global Market Volume (Kg) Forecast by Category, 2016-2032 Table 7: Global Market Value (US$ Mn) Forecast by Distribution Channel, 2016-2032 Table 8: Global Market Volume (Kg) Forecast by Distribution Channel, 2016-2032 Table 9: Global Market Value (US$ Mn) Forecast by Freezing Technique, 2016-2032 Table 10: Global Market Volume (Kg) Forecast by Freezing Technique, 2016-2032 Table 11: North America Market Value (US$ Mn) Forecast by Country, 2016-2032 Table 12: North America Market Volume (Kg) Forecast by Country, 2016-2032 Table 13: North America Market Value (US$ Mn) Forecast by Type, 2016-2032 Table 14: North America Market Volume (Kg) Forecast by Type, 2016-2032 Table 15: North America Market Value (US$ Mn) Forecast by Category, 2016-2032 Table 16: North America Market Volume (Kg) Forecast by Category, 2016-2032 Table 17: North America Market Value (US$ Mn) Forecast by Distribution Channel, 2016-2032 Table 18: North America Market Volume (Kg) Forecast by Distribution Channel, 2016-2032 Table 19: North America Market Value (US$ Mn) Forecast by Freezing Technique, 2016-2032 Table 20: North America Market Volume (Kg) Forecast by Freezing Technique, 2016-2032 Table 21: Latin America Market Value (US$ Mn) Forecast by Country, 2016-2032 Table 22: Latin America Market Volume (Kg) Forecast by Country, 2016-2032 Table 23: Latin America Market Value (US$ Mn) Forecast by Type, 2016-2032 Table 24: Latin America Market Volume (Kg) Forecast by Type, 2016-2032 Table 25: Latin America Market Value (US$ Mn) Forecast by Category, 2016-2032 Table 26: Latin America Market Volume (Kg) Forecast by Category, 2016-2032 Table 27: Latin America Market Value (US$ Mn) Forecast by Distribution Channel, 2016-2032 Table 28: Latin America Market Volume (Kg) Forecast by Distribution Channel, 2016-2032 Table 29: Latin America Market Value (US$ Mn) Forecast by Freezing Technique, 2016-2032 Table 30: Latin America Market Volume (Kg) Forecast by Freezing Technique, 2016-2032 Table 31: Europe Market Value (US$ Mn) Forecast by Country, 2016-2032 Table 32: Europe Market Volume (Kg) Forecast by Country, 2016-2032 Table 33: Europe Market Value (US$ Mn) Forecast by Type, 2016-2032 Table 34: Europe Market Volume (Kg) Forecast by Type, 2016-2032 Table 35: Europe Market Value (US$ Mn) Forecast by Category, 2016-2032 Table 36: Europe Market Volume (Kg) Forecast by Category, 2016-2032 Table 37: Europe Market Value (US$ Mn) Forecast by Distribution Channel, 2016-2032 Table 38: Europe Market Volume (Kg) Forecast by Distribution Channel, 2016-2032 Table 39: Europe Market Value (US$ Mn) Forecast by Freezing Technique, 2016-2032 Table 40: Europe Market Volume (Kg) Forecast by Freezing Technique, 2016-2032 Table 41: Asia Pacific Market Value (US$ Mn) Forecast by Country, 2016-2032 Table 42: Asia Pacific Market Volume (Kg) Forecast by Country, 2016-2032 Table 43: Asia Pacific Market Value (US$ Mn) Forecast by Type, 2016-2032 Table 44: Asia Pacific Market Volume (Kg) Forecast by Type, 2016-2032 Table 45: Asia Pacific Market Value (US$ Mn) Forecast by Category, 2016-2032 Table 46: Asia Pacific Market Volume (Kg) Forecast by Category, 2016-2032 Table 47: Asia Pacific Market Value (US$ Mn) Forecast by Distribution Channel, 2016-2032 Table 48: Asia Pacific Market Volume (Kg) Forecast by Distribution Channel, 2016-2032 Table 49: Asia Pacific Market Value (US$ Mn) Forecast by Freezing Technique, 2016-2032 Table 50: Asia Pacific Market Volume (Kg) Forecast by Freezing Technique, 2016-2032 Table 51: MEA Market Value (US$ Mn) Forecast by Country, 2016-2032 Table 52: MEA Market Volume (Kg) Forecast by Country, 2016-2032 Table 53: MEA Market Value (US$ Mn) Forecast by Type, 2016-2032 Table 54: MEA Market Volume (Kg) Forecast by Type, 2016-2032 Table 55: MEA Market Value (US$ Mn) Forecast by Category, 2016-2032 Table 56: MEA Market Volume (Kg) Forecast by Category, 2016-2032 Table 57: MEA Market Value (US$ Mn) Forecast by Distribution Channel, 2016-2032 Table 58: MEA Market Volume (Kg) Forecast by Distribution Channel, 2016-2032 Table 59: MEA Market Value (US$ Mn) Forecast by Freezing Technique, 2016-2032 Table 60: MEA Market Volume (Kg) Forecast by Freezing Technique, 2016-2032
Find your sweet spots for generating winning opportunities in this market.
Talk to AnalystList of Charts
Figure 1: Global Market Value (US$ Mn) by Type, 2022-2032 Figure 2: Global Market Value (US$ Mn) by Category, 2022-2032 Figure 3: Global Market Value (US$ Mn) by Distribution Channel, 2022-2032 Figure 4: Global Market Value (US$ Mn) by Freezing Technique, 2022-2032 Figure 5: Global Market Value (US$ Mn) by Region, 2022-2032 Figure 6: Global Market Value (US$ Mn) Analysis by Region, 2016-2032 Figure 7: Global Market Volume (Kg) Analysis by Region, 2016-2032 Figure 8: Global Market Value Share (%) and BPS Analysis by Region, 2022-2032 Figure 9: Global Market Y-o-Y Growth (%) Projections by Region, 2022-2032 Figure 10: Global Market Value (US$ Mn) Analysis by Type, 2016-2032 Figure 11: Global Market Volume (Kg) Analysis by Type, 2016-2032 Figure 12: Global Market Value Share (%) and BPS Analysis by Type, 2022-2032 Figure 13: Global Market Y-o-Y Growth (%) Projections by Type, 2022-2032 Figure 14: Global Market Value (US$ Mn) Analysis by Category, 2016-2032 Figure 15: Global Market Volume (Kg) Analysis by Category, 2016-2032 Figure 16: Global Market Value Share (%) and BPS Analysis by Category, 2022-2032 Figure 17: Global Market Y-o-Y Growth (%) Projections by Category, 2022-2032 Figure 18: Global Market Value (US$ Mn) Analysis by Distribution Channel, 2016-2032 Figure 19: Global Market Volume (Kg) Analysis by Distribution Channel, 2016-2032 Figure 20: Global Market Value Share (%) and BPS Analysis by Distribution Channel, 2022-2032 Figure 21: Global Market Y-o-Y Growth (%) Projections by Distribution Channel, 2022-2032 Figure 22: Global Market Value (US$ Mn) Analysis by Freezing Technique, 2016-2032 Figure 23: Global Market Volume (Kg) Analysis by Freezing Technique, 2016-2032 Figure 24: Global Market Value Share (%) and BPS Analysis by Freezing Technique, 2022-2032 Figure 25: Global Market Y-o-Y Growth (%) Projections by Freezing Technique, 2022-2032 Figure 26: Global Market Attractiveness by Type, 2022-2032 Figure 27: Global Market Attractiveness by Category, 2022-2032 Figure 28: Global Market Attractiveness by Distribution Channel, 2022-2032 Figure 29: Global Market Attractiveness by Freezing Technique, 2022-2032 Figure 30: Global Market Attractiveness by Region, 2022-2032 Figure 31: North America Market Value (US$ Mn) by Type, 2022-2032 Figure 32: North America Market Value (US$ Mn) by Category, 2022-2032 Figure 33: North America Market Value (US$ Mn) by Distribution Channel, 2022-2032 Figure 34: North America Market Value (US$ Mn) by Freezing Technique, 2022-2032 Figure 35: North America Market Value (US$ Mn) by Country, 2022-2032 Figure 36: North America Market Value (US$ Mn) Analysis by Country, 2016-2032 Figure 37: North America Market Volume (Kg) Analysis by Country, 2016-2032 Figure 38: North America Market Value Share (%) and BPS Analysis by Country, 2022-2032 Figure 39: North America Market Y-o-Y Growth (%) Projections by Country, 2022-2032 Figure 40: North America Market Value (US$ Mn) Analysis by Type, 2016-2032 Figure 41: North America Market Volume (Kg) Analysis by Type, 2016-2032 Figure 42: North America Market Value Share (%) and BPS Analysis by Type, 2022-2032 Figure 43: North America Market Y-o-Y Growth (%) Projections by Type, 2022-2032 Figure 44: North America Market Value (US$ Mn) Analysis by Category, 2016-2032 Figure 45: North America Market Volume (Kg) Analysis by Category, 2016-2032 Figure 46: North America Market Value Share (%) and BPS Analysis by Category, 2022-2032 Figure 47: North America Market Y-o-Y Growth (%) Projections by Category, 2022-2032 Figure 48: North America Market Value (US$ Mn) Analysis by Distribution Channel, 2016-2032 Figure 49: North America Market Volume (Kg) Analysis by Distribution Channel, 2016-2032 Figure 50: North America Market Value Share (%) and BPS Analysis by Distribution Channel, 2022-2032 Figure 51: North America Market Y-o-Y Growth (%) Projections by Distribution Channel, 2022-2032 Figure 52: North America Market Value (US$ Mn) Analysis by Freezing Technique, 2016-2032 Figure 53: North America Market Volume (Kg) Analysis by Freezing Technique, 2016-2032 Figure 54: North America Market Value Share (%) and BPS Analysis by Freezing Technique, 2022-2032 Figure 55: North America Market Y-o-Y Growth (%) Projections by Freezing Technique, 2022-2032 Figure 56: North America Market Attractiveness by Type, 2022-2032 Figure 57: North America Market Attractiveness by Category, 2022-2032 Figure 58: North America Market Attractiveness by Distribution Channel, 2022-2032 Figure 59: North America Market Attractiveness by Freezing Technique, 2022-2032 Figure 60: North America Market Attractiveness by Country, 2022-2032 Figure 61: Latin America Market Value (US$ Mn) by Type, 2022-2032 Figure 62: Latin America Market Value (US$ Mn) by Category, 2022-2032 Figure 63: Latin America Market Value (US$ Mn) by Distribution Channel, 2022-2032 Figure 64: Latin America Market Value (US$ Mn) by Freezing Technique, 2022-2032 Figure 65: Latin America Market Value (US$ Mn) by Country, 2022-2032 Figure 66: Latin America Market Value (US$ Mn) Analysis by Country, 2016-2032 Figure 67: Latin America Market Volume (Kg) Analysis by Country, 2016-2032 Figure 68: Latin America Market Value Share (%) and BPS Analysis by Country, 2022-2032 Figure 69: Latin America Market Y-o-Y Growth (%) Projections by Country, 2022-2032 Figure 70: Latin America Market Value (US$ Mn) Analysis by Type, 2016-2032 Figure 71: Latin America Market Volume (Kg) Analysis by Type, 2016-2032 Figure 72: Latin America Market Value Share (%) and BPS Analysis by Type, 2022-2032 Figure 73: Latin America Market Y-o-Y Growth (%) Projections by Type, 2022-2032 Figure 74: Latin America Market Value (US$ Mn) Analysis by Category, 2016-2032 Figure 75: Latin America Market Volume (Kg) Analysis by Category, 2016-2032 Figure 76: Latin America Market Value Share (%) and BPS Analysis by Category, 2022-2032 Figure 77: Latin America Market Y-o-Y Growth (%) Projections by Category, 2022-2032 Figure 78: Latin America Market Value (US$ Mn) Analysis by Distribution Channel, 2016-2032 Figure 79: Latin America Market Volume (Kg) Analysis by Distribution Channel, 2016-2032 Figure 80: Latin America Market Value Share (%) and BPS Analysis by Distribution Channel, 2022-2032 Figure 81: Latin America Market Y-o-Y Growth (%) Projections by Distribution Channel, 2022-2032 Figure 82: Latin America Market Value (US$ Mn) Analysis by Freezing Technique, 2016-2032 Figure 83: Latin America Market Volume (Kg) Analysis by Freezing Technique, 2016-2032 Figure 84: Latin America Market Value Share (%) and BPS Analysis by Freezing Technique, 2022-2032 Figure 85: Latin America Market Y-o-Y Growth (%) Projections by Freezing Technique, 2022-2032 Figure 86: Latin America Market Attractiveness by Type, 2022-2032 Figure 87: Latin America Market Attractiveness by Category, 2022-2032 Figure 88: Latin America Market Attractiveness by Distribution Channel, 2022-2032 Figure 89: Latin America Market Attractiveness by Freezing Technique, 2022-2032 Figure 90: Latin America Market Attractiveness by Country, 2022-2032 Figure 91: Europe Market Value (US$ Mn) by Type, 2022-2032 Figure 92: Europe Market Value (US$ Mn) by Category, 2022-2032 Figure 93: Europe Market Value (US$ Mn) by Distribution Channel, 2022-2032 Figure 94: Europe Market Value (US$ Mn) by Freezing Technique, 2022-2032 Figure 95: Europe Market Value (US$ Mn) by Country, 2022-2032 Figure 96: Europe Market Value (US$ Mn) Analysis by Country, 2016-2032 Figure 97: Europe Market Volume (Kg) Analysis by Country, 2016-2032 Figure 98: Europe Market Value Share (%) and BPS Analysis by Country, 2022-2032 Figure 99: Europe Market Y-o-Y Growth (%) Projections by Country, 2022-2032 Figure 100: Europe Market Value (US$ Mn) Analysis by Type, 2016-2032 Figure 101: Europe Market Volume (Kg) Analysis by Type, 2016-2032 Figure 102: Europe Market Value Share (%) and BPS Analysis by Type, 2022-2032 Figure 103: Europe Market Y-o-Y Growth (%) Projections by Type, 2022-2032 Figure 104: Europe Market Value (US$ Mn) Analysis by Category, 2016-2032 Figure 105: Europe Market Volume (Kg) Analysis by Category, 2016-2032 Figure 106: Europe Market Value Share (%) and BPS Analysis by Category, 2022-2032 Figure 107: Europe Market Y-o-Y Growth (%) Projections by Category, 2022-2032 Figure 108: Europe Market Value (US$ Mn) Analysis by Distribution Channel, 2016-2032 Figure 109: Europe Market Volume (Kg) Analysis by Distribution Channel, 2016-2032 Figure 110: Europe Market Value Share (%) and BPS Analysis by Distribution Channel, 2022-2032 Figure 111: Europe Market Y-o-Y Growth (%) Projections by Distribution Channel, 2022-2032 Figure 112: Europe Market Value (US$ Mn) Analysis by Freezing Technique, 2016-2032 Figure 113: Europe Market Volume (Kg) Analysis by Freezing Technique, 2016-2032 Figure 114: Europe Market Value Share (%) and BPS Analysis by Freezing Technique, 2022-2032 Figure 115: Europe Market Y-o-Y Growth (%) Projections by Freezing Technique, 2022-2032 Figure 116: Europe Market Attractiveness by Type, 2022-2032 Figure 117: Europe Market Attractiveness by Category, 2022-2032 Figure 118: Europe Market Attractiveness by Distribution Channel, 2022-2032 Figure 119: Europe Market Attractiveness by Freezing Technique, 2022-2032 Figure 120: Europe Market Attractiveness by Country, 2022-2032 Figure 121: Asia Pacific Market Value (US$ Mn) by Type, 2022-2032 Figure 122: Asia Pacific Market Value (US$ Mn) by Category, 2022-2032 Figure 123: Asia Pacific Market Value (US$ Mn) by Distribution Channel, 2022-2032 Figure 124: Asia Pacific Market Value (US$ Mn) by Freezing Technique, 2022-2032 Figure 125: Asia Pacific Market Value (US$ Mn) by Country, 2022-2032 Figure 126: Asia Pacific Market Value (US$ Mn) Analysis by Country, 2016-2032 Figure 127: Asia Pacific Market Volume (Kg) Analysis by Country, 2016-2032 Figure 128: Asia Pacific Market Value Share (%) and BPS Analysis by Country, 2022-2032 Figure 129: Asia Pacific Market Y-o-Y Growth (%) Projections by Country, 2022-2032 Figure 130: Asia Pacific Market Value (US$ Mn) Analysis by Type, 2016-2032 Figure 131: Asia Pacific Market Volume (Kg) Analysis by Type, 2016-2032 Figure 132: Asia Pacific Market Value Share (%) and BPS Analysis by Type, 2022-2032 Figure 133: Asia Pacific Market Y-o-Y Growth (%) Projections by Type, 2022-2032 Figure 134: Asia Pacific Market Value (US$ Mn) Analysis by Category, 2016-2032 Figure 135: Asia Pacific Market Volume (Kg) Analysis by Category, 2016-2032 Figure 136: Asia Pacific Market Value Share (%) and BPS Analysis by Category, 2022-2032 Figure 137: Asia Pacific Market Y-o-Y Growth (%) Projections by Category, 2022-2032 Figure 138: Asia Pacific Market Value (US$ Mn) Analysis by Distribution Channel, 2016-2032 Figure 139: Asia Pacific Market Volume (Kg) Analysis by Distribution Channel, 2016-2032 Figure 140: Asia Pacific Market Value Share (%) and BPS Analysis by Distribution Channel, 2022-2032 Figure 141: Asia Pacific Market Y-o-Y Growth (%) Projections by Distribution Channel, 2022-2032 Figure 142: Asia Pacific Market Value (US$ Mn) Analysis by Freezing Technique, 2016-2032 Figure 143: Asia Pacific Market Volume (Kg) Analysis by Freezing Technique, 2016-2032 Figure 144: Asia Pacific Market Value Share (%) and BPS Analysis by Freezing Technique, 2022-2032 Figure 145: Asia Pacific Market Y-o-Y Growth (%) Projections by Freezing Technique, 2022-2032 Figure 146: Asia Pacific Market Attractiveness by Type, 2022-2032 Figure 147: Asia Pacific Market Attractiveness by Category, 2022-2032 Figure 148: Asia Pacific Market Attractiveness by Distribution Channel, 2022-2032 Figure 149: Asia Pacific Market Attractiveness by Freezing Technique, 2022-2032 Figure 150: Asia Pacific Market Attractiveness by Country, 2022-2032 Figure 151: MEA Market Value (US$ Mn) by Type, 2022-2032 Figure 152: MEA Market Value (US$ Mn) by Category, 2022-2032 Figure 153: MEA Market Value (US$ Mn) by Distribution Channel, 2022-2032 Figure 154: MEA Market Value (US$ Mn) by Freezing Technique, 2022-2032 Figure 155: MEA Market Value (US$ Mn) by Country, 2022-2032 Figure 156: MEA Market Value (US$ Mn) Analysis by Country, 2016-2032 Figure 157: MEA Market Volume (Kg) Analysis by Country, 2016-2032 Figure 158: MEA Market Value Share (%) and BPS Analysis by Country, 2022-2032 Figure 159: MEA Market Y-o-Y Growth (%) Projections by Country, 2022-2032 Figure 160: MEA Market Value (US$ Mn) Analysis by Type, 2016-2032 Figure 161: MEA Market Volume (Kg) Analysis by Type, 2016-2032 Figure 162: MEA Market Value Share (%) and BPS Analysis by Type, 2022-2032 Figure 163: MEA Market Y-o-Y Growth (%) Projections by Type, 2022-2032 Figure 164: MEA Market Value (US$ Mn) Analysis by Category, 2016-2032 Figure 165: MEA Market Volume (Kg) Analysis by Category, 2016-2032 Figure 166: MEA Market Value Share (%) and BPS Analysis by Category, 2022-2032 Figure 167: MEA Market Y-o-Y Growth (%) Projections by Category, 2022-2032 Figure 168: MEA Market Value (US$ Mn) Analysis by Distribution Channel, 2016-2032 Figure 169: MEA Market Volume (Kg) Analysis by Distribution Channel, 2016-2032 Figure 170: MEA Market Value Share (%) and BPS Analysis by Distribution Channel, 2022-2032 Figure 171: MEA Market Y-o-Y Growth (%) Projections by Distribution Channel, 2022-2032 Figure 172: MEA Market Value (US$ Mn) Analysis by Freezing Technique, 2016-2032 Figure 173: MEA Market Volume (Kg) Analysis by Freezing Technique, 2016-2032 Figure 174: MEA Market Value Share (%) and BPS Analysis by Freezing Technique, 2022-2032 Figure 175: MEA Market Y-o-Y Growth (%) Projections by Freezing Technique, 2022-2032 Figure 176: MEA Market Attractiveness by Type, 2022-2032 Figure 177: MEA Market Attractiveness by Category, 2022-2032 Figure 178: MEA Market Attractiveness by Distribution Channel, 2022-2032 Figure 179: MEA Market Attractiveness by Freezing Technique, 2022-2032 Figure 180: MEA Market Attractiveness by Country, 2022-2032
Need specific information?
Request CustomizationExplore Food and Beverage Insights
View Reports