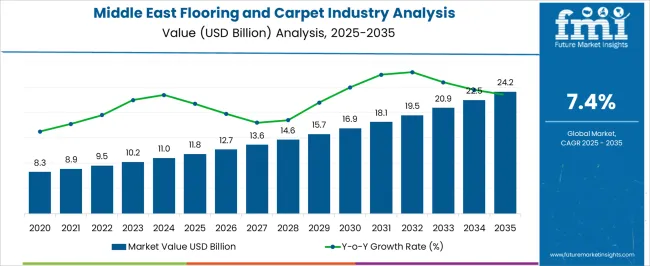
The Middle East Flooring And Carpet landscape was valued at USD 9,432.1 million in 2022. By the end of 2023, the industry is likely to reach a valuation of USD 10,169.2 million. During the forecast period, sales of flooring and carpet products in the Middle East are expected to rise at a 7.8% CAGR to reach USD 21,521.3 million by 2033.
Attributes | Details |
---|---|
Estimated Value in 2022 | USD 9,432.1 million |
Expected Value in 2023 | USD 10,169.2 million |
Expected Value in 2033 | USD 21,521.3 million |
Value-based CAGR from 2023 to 2033 | 7.8% |
Key Industry Trends and Highlights
Report Attributes | Details |
---|---|
Market value in 2022 | USD 9,432.1 million |
It is anticipated that the growing use of machine-made laminates, carpets, rugs, and other flooring options will create new expansion opportunities. The market expansion for carpet and flooring is expected to be driven by the increasing demand for innovative flooring solutions. The growing population is driving the need for residential structures, which is expected to support the expansion of the flooring and carpet markets.
The scope for flooring and carpet product sales in the Middle East is anticipated to be supported by the increasing popularity of carpet tiles and luxury goods in commercial areas. It is expected that the growing consumer preference for attractive flooring options and interior design for their homes will propel market expansion. The Middle East is known for having access to sophisticated and aesthetically pleasing flooring options.
The table below lists the top five nations expected to experience prominent growth during the forecast period. Qatar and Saudi Arabia are expected to experience the most significant development among these nations.
Forecast CAGRs from 2023 to 2033
Countries | CAGR from 2023 to 2033 |
---|---|
Saudi Arabia | 9% |
The UAE | 8.1% |
Qatar | 9.4% |
Oman | 4.9% |
Kuwait | 8.7% |
Saudi Arabia is expected to achieve a 9% compound annual growth rate (CAGR) during the forecast period. There is a significant construction boom underway in Saudi Arabia, with numerous infrastructural, business, and residential projects in various stages of development. These developments span a variety of commercial centers to megacities such as Neom. The demand for premium carpets and flooring materials increases as construction projects become larger.
Developers and contractors look for long-lasting, visually beautiful solutions to meet the various requirements of these projects.
The population of the nation is rapidly urbanizing, with more people living in major cities like Riyadh as well as Jeddah. Modernization of residential and commercial areas is prioritized alongside urbanization. The demand for flooring and carpet solutions that align with modern interior design trends is increasing among consumers and businesses.
Sales of flooring accessories and carpets in the UAE are projected to grow at an 8.1% CAGR from 2023 to 2033. The United Arab Emirates is widely recognized for its thriving tourist and hospitality sector, featuring opulent resorts, hotels, and commercial assets. Superior carpeting and flooring are essential for maintaining a high level of comfort and elegance for both visitors and locals. Using high-quality materials is essential for creating warm and inviting spaces.
Expo 2020 was held in the United Arab Emirates, marking a major international event that promoted infrastructure development and building projects. Large-scale facilities are needed for these kinds of events, and many of these require excellent carpet and flooring options. The UAE is also well known for holding a lot of shows and events, which fuels demand for carpeting and flooring.
Qatar is expected to emerge as an important contributor to the flooring and carpet landscape of the Middle East. It is poised to develop at a 9.4% CAGR during the forecast period. The 2022 FIFA World Cup was held in Qatar, which sparked a boom in building projects, including stadiums, lodging, and transportation. To create comfortable and safe spaces for guests, a lot of flooring and carpeting materials must be used in these construction projects.
In Qatar, environmentally friendly and sustainable building methods are highly valued. As a result, there is a growing demand for environmentally friendly green flooring options that align with regional sustainability goals. Flooring materials that fit these requirements are in great demand.
Oman is likely to expand with a 4.9% CAGR from 2023 to 2033. The real estate market in Oman is experiencing growth, with both residential and commercial developments on the rise. The demand for dependable and aesthetically pleasing flooring and carpeting products is driven by the expansion of residential and commercial buildings.
Its tourism sector is booming, and the country has an increasing number of leisure and recreational options. These types of companies require flooring options that are both aesthetically pleasing and long-lasting, able to withstand heavy foot traffic while creating welcoming environments that enhance the allure of regional tourism spots.
Kuwait is poised to expand at an 8.7% compound annual growth rate (CAGR) during the forecast period. Kuwait is concentrating on modernizing and renovating its existing buildings, particularly in its residential and commercial districts. There is a demand for new carpet and flooring as a result of these efforts to improve and repair houses. Companies and property owners seek modern and practical ways to revitalize their spaces.
The construction of hotels, restaurants, and office buildings is contributing to the growth of regional hospitality and commercial sectors. To create opulent and useful spaces, premium flooring options are essential. There is an increased need for high-quality carpet and flooring materials.
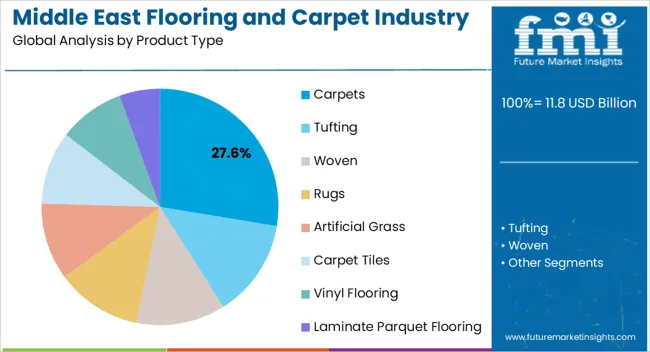
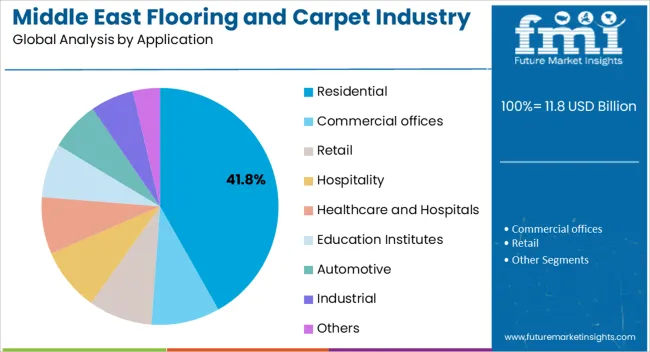
The table below highlights how carpets are projected to take up a significant global market share by product type. The residential application segment is likely to garner the dominant market share in 2023.
Category | Revenue Share in 2023 |
---|---|
Carpets by Product Type | 32.9% |
Residential Application | 35.2% |
The carpets segment is expected to account for a 32.9% revenue share in 2023. In the Middle East, carpets have a significant cultural value. They are frequently used to enhance the appearance of residential and commercial buildings, define and adorn rooms, and provide comfort. Carpets are a popular choice due to the cultural emphasis on creating pleasant spaces in the region and being hospitable.
Warmth and insulation from carpets are particularly beneficial in the diverse environment of the Middle East. Carpets are a versatile and useful flooring option since they keep interiors cool in hot desert locations and offer comfort and protection against cold floors in the winter.
Based on the application, the residential segment is anticipated to take up a significant share. In 2023, the segment acquired 35.2% of the Middle East flooring and carpet revenue share.
The Middle East features a diverse range of climates, including hot, dry deserts. Carpets and flooring options offer both comfort and insulation. They are a sensible option for residential areas, as they keep interiors cooler in arid regions and provide warmth and insulation against cold floors in the winter.
Middle Eastern interior design heavily relies on carpets and flooring options. They are prized for their capacity to improve the aesthetics and design of hospitable, culturally diverse homes. The area has a long-standing custom of adorning homes with elaborate carpet patterns and warm flooring materials to convey a feeling of coziness and warmth.
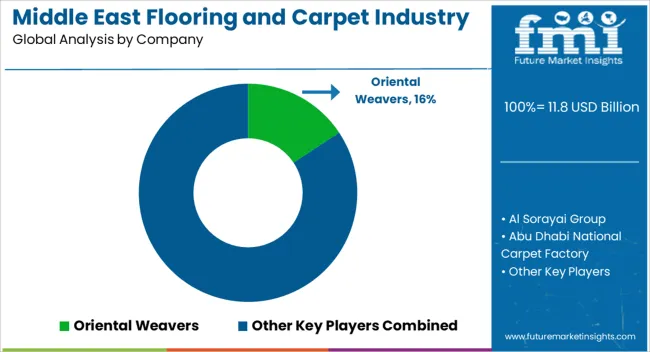
Flooring and carpet manufacturers are cautiously expanding their product offerings to cater to the diverse needs of their Middle Eastern clientele. It involves introducing a wider range of flooring types, patterns, and styles. Businesses can appeal to a variety of market segments, including residential and commercial locations, as well as the industrial and hospitality industries, by offering a wide range of products.
To cater to distinct use cases and aesthetic preferences, they may offer a variety of flooring solutions, including hardwood, carpet tiles, laminate, ceramic, vinyl, and others. This tactic draws in more consumers by positioning these businesses as one-stop shops for all flooring needs in addition to increasing revenue shares.
Some of the prominent developments by the important companies in this domain are provided below.
Company | Key Developments |
---|---|
Beaulieu International Group |
|
RAK Ceramics |
|
Attribute | Details |
---|---|
Estimated Industry Size in 2023 | USD 10,169.2 million |
Projected Industry Size in 2033 | USD 21,521.3 million |
Anticipated CAGR from 2023 to 2033 | 7.8% |
Historical Analysis of Demand for Flooring and Carpet in the Middle East | 2018 to 2022 |
Demand Forecast for Flooring and Carpet in the Middle East | 2023 to 2033 |
Report Coverage | Industry Size, Industry Trends, Analysis of key factors influencing Flooring and Carpet adoption in the Middle East, Insights on Global Players and their Industry Strategy in the Middle East, Ecosystem Analysis of Manufacturers in the Middle East |
Key Countries Analyzed while Studying Opportunities in Flooring and Carpet in the Middle East | Saudi Arabia, United Arab Emirates, Egypt, Turkey, Iran, Qatar, Oman, Kuwait, Bahrain, Jordan, Rest of the Middle East |
Key Companies Profiled | Al Sorayai Group; Abu Dhabi National Carpet Factory; Mac Carpet; Prado Egypt For Carpet; Gheytaran Carpet; Oriental Weavers; Standard Carpets Ind. LLC.; Saida Carpets; Dormina; Al Mira Carpet Factory; Abdullatif Carpets |
Table 1: Market Value (US$ Million) Forecast by Region, 2018 to 2033
Table 2: Market Volume (Sq.Ft) Forecast by Region, 2018 to 2033
Table 3: Market Value (US$ Million) Forecast by Product Type, 2018 to 2033
Table 4: Market Volume (Sq.Ft) Forecast by Product Type, 2018 to 2033
Table 5: Market Value (US$ Million) Forecast by Material, 2018 to 2033
Table 6: Market Volume (Sq.Ft) Forecast by Material, 2018 to 2033
Table 7: Market Value (US$ Million) Forecast by Application, 2018 to 2033
Table 8: Market Volume (Sq.Ft) Forecast by Application, 2018 to 2033
Table 9: Saudi Arabia Flooring and Carpet Market Value (US$ Million) Forecast by Country, 2018 to 2033
Table 10: Saudi Arabia Flooring and Carpet Market Volume (Sq.Ft) Forecast by Country, 2018 to 2033
Table 11: Saudi Arabia Flooring and Carpet Market Value (US$ Million) Forecast by Product Type, 2018 to 2033
Table 12: Saudi Arabia Flooring and Carpet Market Volume (Sq.Ft) Forecast by Product Type, 2018 to 2033
Table 13: Saudi Arabia Flooring and Carpet Market Value (US$ Million) Forecast by Material, 2018 to 2033
Table 14: Saudi Arabia Flooring and Carpet Market Volume (Sq.Ft) Forecast by Material, 2018 to 2033
Table 15: Saudi Arabia Flooring and Carpet Market Value (US$ Million) Forecast by Application, 2018 to 2033
Table 16: Saudi Arabia Flooring and Carpet Market Volume (Sq.Ft) Forecast by Application, 2018 to 2033
Table 17: UAE Flooring and Carpet Market Value (US$ Million) Forecast by Country, 2018 to 2033
Table 18: UAE Flooring and Carpet Market Volume (Sq.Ft) Forecast by Country, 2018 to 2033
Table 19: UAE Flooring and Carpet Market Value (US$ Million) Forecast by Product Type, 2018 to 2033
Table 20: UAE Flooring and Carpet Market Volume (Sq.Ft) Forecast by Product Type, 2018 to 2033
Table 21: UAE Flooring and Carpet Market Value (US$ Million) Forecast by Material, 2018 to 2033
Table 22: UAE Flooring and Carpet Market Volume (Sq.Ft) Forecast by Material, 2018 to 2033
Table 23: UAE Flooring and Carpet Market Value (US$ Million) Forecast by Application, 2018 to 2033
Table 24: UAE Flooring and Carpet Market Volume (Sq.Ft) Forecast by Application, 2018 to 2033
Table 25: Egypt Flooring and Carpet Market Value (US$ Million) Forecast by Country, 2018 to 2033
Table 26: Egypt Flooring and Carpet Market Volume (Sq.Ft) Forecast by Country, 2018 to 2033
Table 27: Egypt Flooring and Carpet Market Value (US$ Million) Forecast by Product Type, 2018 to 2033
Table 28: Egypt Flooring and Carpet Market Volume (Sq.Ft) Forecast by Product Type, 2018 to 2033
Table 29: Egypt Flooring and Carpet Market Value (US$ Million) Forecast by Material, 2018 to 2033
Table 30: Egypt Flooring and Carpet Market Volume (Sq.Ft) Forecast by Material, 2018 to 2033
Table 31: Egypt Flooring and Carpet Market Value (US$ Million) Forecast by Application, 2018 to 2033
Table 32: Egypt Flooring and Carpet Market Volume (Sq.Ft) Forecast by Application, 2018 to 2033
Table 33: Turkey Flooring and Carpet Market Value (US$ Million) Forecast by Country, 2018 to 2033
Table 34: Turkey Flooring and Carpet Market Volume (Sq.Ft) Forecast by Country, 2018 to 2033
Table 35: Turkey Flooring and Carpet Market Value (US$ Million) Forecast by Product Type, 2018 to 2033
Table 36: Turkey Flooring and Carpet Market Volume (Sq.Ft) Forecast by Product Type, 2018 to 2033
Table 37: Turkey Flooring and Carpet Market Value (US$ Million) Forecast by Material, 2018 to 2033
Table 38: Turkey Flooring and Carpet Market Volume (Sq.Ft) Forecast by Material, 2018 to 2033
Table 39: Turkey Flooring and Carpet Market Value (US$ Million) Forecast by Application, 2018 to 2033
Table 40: Turkey Flooring and Carpet Market Volume (Sq.Ft) Forecast by Application, 2018 to 2033
Table 41: Iran Flooring and Carpet Market Value (US$ Million) Forecast by Country, 2018 to 2033
Table 42: Iran Flooring and Carpet Market Volume (Sq.Ft) Forecast by Country, 2018 to 2033
Table 43: Iran Flooring and Carpet Market Value (US$ Million) Forecast by Product Type, 2018 to 2033
Table 44: Iran Flooring and Carpet Market Volume (Sq.Ft) Forecast by Product Type, 2018 to 2033
Table 45: Iran Flooring and Carpet Market Value (US$ Million) Forecast by Material, 2018 to 2033
Table 46: Iran Flooring and Carpet Market Volume (Sq.Ft) Forecast by Material, 2018 to 2033
Table 47: Iran Flooring and Carpet Market Value (US$ Million) Forecast by Application, 2018 to 2033
Table 48: Iran Flooring and Carpet Market Volume (Sq.Ft) Forecast by Application, 2018 to 2033
Table 49: Qatar Flooring and Carpet Market Value (US$ Million) Forecast by Country, 2018 to 2033
Table 50: Qatar Flooring and Carpet Market Volume (Sq.Ft) Forecast by Country, 2018 to 2033
Table 51: Qatar Flooring and Carpet Market Value (US$ Million) Forecast by Product Type, 2018 to 2033
Table 52: Qatar Flooring and Carpet Market Volume (Sq.Ft) Forecast by Product Type, 2018 to 2033
Table 53: Qatar Flooring and Carpet Market Value (US$ Million) Forecast by Material, 2018 to 2033
Table 54: Qatar Flooring and Carpet Market Volume (Sq.Ft) Forecast by Material, 2018 to 2033
Table 55: Qatar Flooring and Carpet Market Value (US$ Million) Forecast by Application, 2018 to 2033
Table 56: Qatar Flooring and Carpet Market Volume (Sq.Ft) Forecast by Application, 2018 to 2033
Table 57: Rest of Market Value (US$ Million) Forecast by Country, 2018 to 2033
Table 58: Rest of Market Volume (Sq.Ft) Forecast by Country, 2018 to 2033
Table 59: Rest of Market Value (US$ Million) Forecast by Product Type, 2018 to 2033
Table 60: Rest of Market Volume (Sq.Ft) Forecast by Product Type, 2018 to 2033
Table 61: Rest of Market Value (US$ Million) Forecast by Material, 2018 to 2033
Table 62: Rest of Market Volume (Sq.Ft) Forecast by Material, 2018 to 2033
Table 63: Rest of Market Value (US$ Million) Forecast by Application, 2018 to 2033
Table 64: Rest of Market Volume (Sq.Ft) Forecast by Application, 2018 to 2033
Figure 1: Market Value (US$ Million) by Product Type, 2023 to 2033
Figure 2: Market Value (US$ Million) by Material, 2023 to 2033
Figure 3: Market Value (US$ Million) by Application, 2023 to 2033
Figure 4: Market Value (US$ Million) by Region, 2023 to 2033
Figure 5: Market Value (US$ Million) Analysis by Region, 2018 to 2033
Figure 6: Market Volume (Sq.Ft) Analysis by Region, 2018 to 2033
Figure 7: Market Value Share (%) and BPS Analysis by Region, 2023 to 2033
Figure 8: Market Y-o-Y Growth (%) Projections by Region, 2023 to 2033
Figure 9: Market Value (US$ Million) Analysis by Product Type, 2018 to 2033
Figure 10: Market Volume (Sq.Ft) Analysis by Product Type, 2018 to 2033
Figure 11: Market Value Share (%) and BPS Analysis by Product Type, 2023 to 2033
Figure 12: Market Y-o-Y Growth (%) Projections by Product Type, 2023 to 2033
Figure 13: Market Value (US$ Million) Analysis by Material, 2018 to 2033
Figure 14: Market Volume (Sq.Ft) Analysis by Material, 2018 to 2033
Figure 15: Market Value Share (%) and BPS Analysis by Material, 2023 to 2033
Figure 16: Market Y-o-Y Growth (%) Projections by Material, 2023 to 2033
Figure 17: Market Value (US$ Million) Analysis by Application, 2018 to 2033
Figure 18: Market Volume (Sq.Ft) Analysis by Application, 2018 to 2033
Figure 19: Market Value Share (%) and BPS Analysis by Application, 2023 to 2033
Figure 20: Market Y-o-Y Growth (%) Projections by Application, 2023 to 2033
Figure 21: Market Attractiveness by Product Type, 2023 to 2033
Figure 22: Market Attractiveness by Material, 2023 to 2033
Figure 23: Market Attractiveness by Application, 2023 to 2033
Figure 24: Market Attractiveness by Region, 2023 to 2033
Figure 25: Saudi Arabia Flooring and Carpet Market Value (US$ Million) by Product Type, 2023 to 2033
Figure 26: Saudi Arabia Flooring and Carpet Market Value (US$ Million) by Material, 2023 to 2033
Figure 27: Saudi Arabia Flooring and Carpet Market Value (US$ Million) by Application, 2023 to 2033
Figure 28: Saudi Arabia Flooring and Carpet Market Value (US$ Million) by Country, 2023 to 2033
Figure 29: Saudi Arabia Flooring and Carpet Market Value (US$ Million) Analysis by Country, 2018 to 2033
Figure 30: Saudi Arabia Flooring and Carpet Market Volume (Sq.Ft) Analysis by Country, 2018 to 2033
Figure 31: Saudi Arabia Flooring and Carpet Market Value Share (%) and BPS Analysis by Country, 2023 to 2033
Figure 32: Saudi Arabia Flooring and Carpet Market Y-o-Y Growth (%) Projections by Country, 2023 to 2033
Figure 33: Saudi Arabia Flooring and Carpet Market Value (US$ Million) Analysis by Product Type, 2018 to 2033
Figure 34: Saudi Arabia Flooring and Carpet Market Volume (Sq.Ft) Analysis by Product Type, 2018 to 2033
Figure 35: Saudi Arabia Flooring and Carpet Market Value Share (%) and BPS Analysis by Product Type, 2023 to 2033
Figure 36: Saudi Arabia Flooring and Carpet Market Y-o-Y Growth (%) Projections by Product Type, 2023 to 2033
Figure 37: Saudi Arabia Flooring and Carpet Market Value (US$ Million) Analysis by Material, 2018 to 2033
Figure 38: Saudi Arabia Flooring and Carpet Market Volume (Sq.Ft) Analysis by Material, 2018 to 2033
Figure 39: Saudi Arabia Flooring and Carpet Market Value Share (%) and BPS Analysis by Material, 2023 to 2033
Figure 40: Saudi Arabia Flooring and Carpet Market Y-o-Y Growth (%) Projections by Material, 2023 to 2033
Figure 41: Saudi Arabia Flooring and Carpet Market Value (US$ Million) Analysis by Application, 2018 to 2033
Figure 42: Saudi Arabia Flooring and Carpet Market Volume (Sq.Ft) Analysis by Application, 2018 to 2033
Figure 43: Saudi Arabia Flooring and Carpet Market Value Share (%) and BPS Analysis by Application, 2023 to 2033
Figure 44: Saudi Arabia Flooring and Carpet Market Y-o-Y Growth (%) Projections by Application, 2023 to 2033
Figure 45: Saudi Arabia Flooring and Carpet Market Attractiveness by Product Type, 2023 to 2033
Figure 46: Saudi Arabia Flooring and Carpet Market Attractiveness by Material, 2023 to 2033
Figure 47: Saudi Arabia Flooring and Carpet Market Attractiveness by Application, 2023 to 2033
Figure 48: Saudi Arabia Flooring and Carpet Market Attractiveness by Country, 2023 to 2033
Figure 49: UAE Flooring and Carpet Market Value (US$ Million) by Product Type, 2023 to 2033
Figure 50: UAE Flooring and Carpet Market Value (US$ Million) by Material, 2023 to 2033
Figure 51: UAE Flooring and Carpet Market Value (US$ Million) by Application, 2023 to 2033
Figure 52: UAE Flooring and Carpet Market Value (US$ Million) by Country, 2023 to 2033
Figure 53: UAE Flooring and Carpet Market Value (US$ Million) Analysis by Country, 2018 to 2033
Figure 54: UAE Flooring and Carpet Market Volume (Sq.Ft) Analysis by Country, 2018 to 2033
Figure 55: UAE Flooring and Carpet Market Value Share (%) and BPS Analysis by Country, 2023 to 2033
Figure 56: UAE Flooring and Carpet Market Y-o-Y Growth (%) Projections by Country, 2023 to 2033
Figure 57: UAE Flooring and Carpet Market Value (US$ Million) Analysis by Product Type, 2018 to 2033
Figure 58: UAE Flooring and Carpet Market Volume (Sq.Ft) Analysis by Product Type, 2018 to 2033
Figure 59: UAE Flooring and Carpet Market Value Share (%) and BPS Analysis by Product Type, 2023 to 2033
Figure 60: UAE Flooring and Carpet Market Y-o-Y Growth (%) Projections by Product Type, 2023 to 2033
Figure 61: UAE Flooring and Carpet Market Value (US$ Million) Analysis by Material, 2018 to 2033
Figure 62: UAE Flooring and Carpet Market Volume (Sq.Ft) Analysis by Material, 2018 to 2033
Figure 63: UAE Flooring and Carpet Market Value Share (%) and BPS Analysis by Material, 2023 to 2033
Figure 64: UAE Flooring and Carpet Market Y-o-Y Growth (%) Projections by Material, 2023 to 2033
Figure 65: UAE Flooring and Carpet Market Value (US$ Million) Analysis by Application, 2018 to 2033
Figure 66: UAE Flooring and Carpet Market Volume (Sq.Ft) Analysis by Application, 2018 to 2033
Figure 67: UAE Flooring and Carpet Market Value Share (%) and BPS Analysis by Application, 2023 to 2033
Figure 68: UAE Flooring and Carpet Market Y-o-Y Growth (%) Projections by Application, 2023 to 2033
Figure 69: UAE Flooring and Carpet Market Attractiveness by Product Type, 2023 to 2033
Figure 70: UAE Flooring and Carpet Market Attractiveness by Material, 2023 to 2033
Figure 71: UAE Flooring and Carpet Market Attractiveness by Application, 2023 to 2033
Figure 72: UAE Flooring and Carpet Market Attractiveness by Country, 2023 to 2033
Figure 73: Egypt Flooring and Carpet Market Value (US$ Million) by Product Type, 2023 to 2033
Figure 74: Egypt Flooring and Carpet Market Value (US$ Million) by Material, 2023 to 2033
Figure 75: Egypt Flooring and Carpet Market Value (US$ Million) by Application, 2023 to 2033
Figure 76: Egypt Flooring and Carpet Market Value (US$ Million) by Country, 2023 to 2033
Figure 77: Egypt Flooring and Carpet Market Value (US$ Million) Analysis by Country, 2018 to 2033
Figure 78: Egypt Flooring and Carpet Market Volume (Sq.Ft) Analysis by Country, 2018 to 2033
Figure 79: Egypt Flooring and Carpet Market Value Share (%) and BPS Analysis by Country, 2023 to 2033
Figure 80: Egypt Flooring and Carpet Market Y-o-Y Growth (%) Projections by Country, 2023 to 2033
Figure 81: Egypt Flooring and Carpet Market Value (US$ Million) Analysis by Product Type, 2018 to 2033
Figure 82: Egypt Flooring and Carpet Market Volume (Sq.Ft) Analysis by Product Type, 2018 to 2033
Figure 83: Egypt Flooring and Carpet Market Value Share (%) and BPS Analysis by Product Type, 2023 to 2033
Figure 84: Egypt Flooring and Carpet Market Y-o-Y Growth (%) Projections by Product Type, 2023 to 2033
Figure 85: Egypt Flooring and Carpet Market Value (US$ Million) Analysis by Material, 2018 to 2033
Figure 86: Egypt Flooring and Carpet Market Volume (Sq.Ft) Analysis by Material, 2018 to 2033
Figure 87: Egypt Flooring and Carpet Market Value Share (%) and BPS Analysis by Material, 2023 to 2033
Figure 88: Egypt Flooring and Carpet Market Y-o-Y Growth (%) Projections by Material, 2023 to 2033
Figure 89: Egypt Flooring and Carpet Market Value (US$ Million) Analysis by Application, 2018 to 2033
Figure 90: Egypt Flooring and Carpet Market Volume (Sq.Ft) Analysis by Application, 2018 to 2033
Figure 91: Egypt Flooring and Carpet Market Value Share (%) and BPS Analysis by Application, 2023 to 2033
Figure 92: Egypt Flooring and Carpet Market Y-o-Y Growth (%) Projections by Application, 2023 to 2033
Figure 93: Egypt Flooring and Carpet Market Attractiveness by Product Type, 2023 to 2033
Figure 94: Egypt Flooring and Carpet Market Attractiveness by Material, 2023 to 2033
Figure 95: Egypt Flooring and Carpet Market Attractiveness by Application, 2023 to 2033
Figure 96: Egypt Flooring and Carpet Market Attractiveness by Country, 2023 to 2033
Figure 97: Turkey Flooring and Carpet Market Value (US$ Million) by Product Type, 2023 to 2033
Figure 98: Turkey Flooring and Carpet Market Value (US$ Million) by Material, 2023 to 2033
Figure 99: Turkey Flooring and Carpet Market Value (US$ Million) by Application, 2023 to 2033
Figure 100: Turkey Flooring and Carpet Market Value (US$ Million) by Country, 2023 to 2033
Figure 101: Turkey Flooring and Carpet Market Value (US$ Million) Analysis by Country, 2018 to 2033
Figure 102: Turkey Flooring and Carpet Market Volume (Sq.Ft) Analysis by Country, 2018 to 2033
Figure 103: Turkey Flooring and Carpet Market Value Share (%) and BPS Analysis by Country, 2023 to 2033
Figure 104: Turkey Flooring and Carpet Market Y-o-Y Growth (%) Projections by Country, 2023 to 2033
Figure 105: Turkey Flooring and Carpet Market Value (US$ Million) Analysis by Product Type, 2018 to 2033
Figure 106: Turkey Flooring and Carpet Market Volume (Sq.Ft) Analysis by Product Type, 2018 to 2033
Figure 107: Turkey Flooring and Carpet Market Value Share (%) and BPS Analysis by Product Type, 2023 to 2033
Figure 108: Turkey Flooring and Carpet Market Y-o-Y Growth (%) Projections by Product Type, 2023 to 2033
Figure 109: Turkey Flooring and Carpet Market Value (US$ Million) Analysis by Material, 2018 to 2033
Figure 110: Turkey Flooring and Carpet Market Volume (Sq.Ft) Analysis by Material, 2018 to 2033
Figure 111: Turkey Flooring and Carpet Market Value Share (%) and BPS Analysis by Material, 2023 to 2033
Figure 112: Turkey Flooring and Carpet Market Y-o-Y Growth (%) Projections by Material, 2023 to 2033
Figure 113: Turkey Flooring and Carpet Market Value (US$ Million) Analysis by Application, 2018 to 2033
Figure 114: Turkey Flooring and Carpet Market Volume (Sq.Ft) Analysis by Application, 2018 to 2033
Figure 115: Turkey Flooring and Carpet Market Value Share (%) and BPS Analysis by Application, 2023 to 2033
Figure 116: Turkey Flooring and Carpet Market Y-o-Y Growth (%) Projections by Application, 2023 to 2033
Figure 117: Turkey Flooring and Carpet Market Attractiveness by Product Type, 2023 to 2033
Figure 118: Turkey Flooring and Carpet Market Attractiveness by Material, 2023 to 2033
Figure 119: Turkey Flooring and Carpet Market Attractiveness by Application, 2023 to 2033
Figure 120: Turkey Flooring and Carpet Market Attractiveness by Country, 2023 to 2033
Figure 121: Iran Flooring and Carpet Market Value (US$ Million) by Product Type, 2023 to 2033
Figure 122: Iran Flooring and Carpet Market Value (US$ Million) by Material, 2023 to 2033
Figure 123: Iran Flooring and Carpet Market Value (US$ Million) by Application, 2023 to 2033
Figure 124: Iran Flooring and Carpet Market Value (US$ Million) by Country, 2023 to 2033
Figure 125: Iran Flooring and Carpet Market Value (US$ Million) Analysis by Country, 2018 to 2033
Figure 126: Iran Flooring and Carpet Market Volume (Sq.Ft) Analysis by Country, 2018 to 2033
Figure 127: Iran Flooring and Carpet Market Value Share (%) and BPS Analysis by Country, 2023 to 2033
Figure 128: Iran Flooring and Carpet Market Y-o-Y Growth (%) Projections by Country, 2023 to 2033
Figure 129: Iran Flooring and Carpet Market Value (US$ Million) Analysis by Product Type, 2018 to 2033
Figure 130: Iran Flooring and Carpet Market Volume (Sq.Ft) Analysis by Product Type, 2018 to 2033
Figure 131: Iran Flooring and Carpet Market Value Share (%) and BPS Analysis by Product Type, 2023 to 2033
Figure 132: Iran Flooring and Carpet Market Y-o-Y Growth (%) Projections by Product Type, 2023 to 2033
Figure 133: Iran Flooring and Carpet Market Value (US$ Million) Analysis by Material, 2018 to 2033
Figure 134: Iran Flooring and Carpet Market Volume (Sq.Ft) Analysis by Material, 2018 to 2033
Figure 135: Iran Flooring and Carpet Market Value Share (%) and BPS Analysis by Material, 2023 to 2033
Figure 136: Iran Flooring and Carpet Market Y-o-Y Growth (%) Projections by Material, 2023 to 2033
Figure 137: Iran Flooring and Carpet Market Value (US$ Million) Analysis by Application, 2018 to 2033
Figure 138: Iran Flooring and Carpet Market Volume (Sq.Ft) Analysis by Application, 2018 to 2033
Figure 139: Iran Flooring and Carpet Market Value Share (%) and BPS Analysis by Application, 2023 to 2033
Figure 140: Iran Flooring and Carpet Market Y-o-Y Growth (%) Projections by Application, 2023 to 2033
Figure 141: Iran Flooring and Carpet Market Attractiveness by Product Type, 2023 to 2033
Figure 142: Iran Flooring and Carpet Market Attractiveness by Material, 2023 to 2033
Figure 143: Iran Flooring and Carpet Market Attractiveness by Application, 2023 to 2033
Figure 144: Iran Flooring and Carpet Market Attractiveness by Country, 2023 to 2033
Figure 145: Qatar Flooring and Carpet Market Value (US$ Million) by Product Type, 2023 to 2033
Figure 146: Qatar Flooring and Carpet Market Value (US$ Million) by Material, 2023 to 2033
Figure 147: Qatar Flooring and Carpet Market Value (US$ Million) by Application, 2023 to 2033
Figure 148: Qatar Flooring and Carpet Market Value (US$ Million) by Country, 2023 to 2033
Figure 149: Qatar Flooring and Carpet Market Value (US$ Million) Analysis by Country, 2018 to 2033
Figure 150: Qatar Flooring and Carpet Market Volume (Sq.Ft) Analysis by Country, 2018 to 2033
Figure 151: Qatar Flooring and Carpet Market Value Share (%) and BPS Analysis by Country, 2023 to 2033
Figure 152: Qatar Flooring and Carpet Market Y-o-Y Growth (%) Projections by Country, 2023 to 2033
Figure 153: Qatar Flooring and Carpet Market Value (US$ Million) Analysis by Product Type, 2018 to 2033
Figure 154: Qatar Flooring and Carpet Market Volume (Sq.Ft) Analysis by Product Type, 2018 to 2033
Figure 155: Qatar Flooring and Carpet Market Value Share (%) and BPS Analysis by Product Type, 2023 to 2033
Figure 156: Qatar Flooring and Carpet Market Y-o-Y Growth (%) Projections by Product Type, 2023 to 2033
Figure 157: Qatar Flooring and Carpet Market Value (US$ Million) Analysis by Material, 2018 to 2033
Figure 158: Qatar Flooring and Carpet Market Volume (Sq.Ft) Analysis by Material, 2018 to 2033
Figure 159: Qatar Flooring and Carpet Market Value Share (%) and BPS Analysis by Material, 2023 to 2033
Figure 160: Qatar Flooring and Carpet Market Y-o-Y Growth (%) Projections by Material, 2023 to 2033
Figure 161: Qatar Flooring and Carpet Market Value (US$ Million) Analysis by Application, 2018 to 2033
Figure 162: Qatar Flooring and Carpet Market Volume (Sq.Ft) Analysis by Application, 2018 to 2033
Figure 163: Qatar Flooring and Carpet Market Value Share (%) and BPS Analysis by Application, 2023 to 2033
Figure 164: Qatar Flooring and Carpet Market Y-o-Y Growth (%) Projections by Application, 2023 to 2033
Figure 165: Qatar Flooring and Carpet Market Attractiveness by Product Type, 2023 to 2033
Figure 166: Qatar Flooring and Carpet Market Attractiveness by Material, 2023 to 2033
Figure 167: Qatar Flooring and Carpet Market Attractiveness by Application, 2023 to 2033
Figure 168: Qatar Flooring and Carpet Market Attractiveness by Country, 2023 to 2033
Figure 169: Rest of Market Value (US$ Million) by Product Type, 2023 to 2033
Figure 170: Rest of Market Value (US$ Million) by Material, 2023 to 2033
Figure 171: Rest of Market Value (US$ Million) by Application, 2023 to 2033
Figure 172: Rest of Market Value (US$ Million) by Country, 2023 to 2033
Figure 173: Rest of Market Value (US$ Million) Analysis by Country, 2018 to 2033
Figure 174: Rest of Market Volume (Sq.Ft) Analysis by Country, 2018 to 2033
Figure 175: Rest of Market Value Share (%) and BPS Analysis by Country, 2023 to 2033
Figure 176: Rest of Market Y-o-Y Growth (%) Projections by Country, 2023 to 2033
Figure 177: Rest of Market Value (US$ Million) Analysis by Product Type, 2018 to 2033
Figure 178: Rest of Market Volume (Sq.Ft) Analysis by Product Type, 2018 to 2033
Figure 179: Rest of Market Value Share (%) and BPS Analysis by Product Type, 2023 to 2033
Figure 180: Rest of Market Y-o-Y Growth (%) Projections by Product Type, 2023 to 2033
Figure 181: Rest of Market Value (US$ Million) Analysis by Material, 2018 to 2033
Figure 182: Rest of Market Volume (Sq.Ft) Analysis by Material, 2018 to 2033
Figure 183: Rest of Market Value Share (%) and BPS Analysis by Material, 2023 to 2033
Figure 184: Rest of Market Y-o-Y Growth (%) Projections by Material, 2023 to 2033
Figure 185: Rest of Market Value (US$ Million) Analysis by Application, 2018 to 2033
Figure 186: Rest of Market Volume (Sq.Ft) Analysis by Application, 2018 to 2033
Figure 187: Rest of Market Value Share (%) and BPS Analysis by Application, 2023 to 2033
Figure 188: Rest of Market Y-o-Y Growth (%) Projections by Application, 2023 to 2033
Figure 189: Rest of Market Attractiveness by Product Type, 2023 to 2033
Figure 190: Rest of Market Attractiveness by Material, 2023 to 2033
Figure 191: Rest of Market Attractiveness by Application, 2023 to 2033
Figure 192: Rest of Market Attractiveness by Country, 2023 to 2033
The global Middle East flooring and carpet landscape is expected to reach USD 10,169.2 million by 2023.
The global Middle East flooring and carpet space is set to expand by a CAGR of 7.8% by 2033.
The global Middle East flooring and carpet industry is forecast to reach USD 21,521.3 million by 2033.
The carpets are projected to attain a 32.9% share in 2023.
The residential segment is likely to acquire a 35.2% share in 2023.
Explore Similar Insights
Thank you!
You will receive an email from our Business Development Manager. Please be sure to check your SPAM/JUNK folder too.