Middle East and Africa Bio-Stimulants Market
Market Insights on Middle East and Africa Bio-Stimulants covering sales outlook, demand forecast & up-to-date key trends
Middle East & Africa Bio-Stimulants Market By Crop (Row Crops, Fruits & Vegetables, Turfs & Ornamental and Other Crop Types), Application (Foliar, Soil and Seed), Active Ingredients (Acid Based, Extract Based and Others) & Region - Forecast 2022 - 2030
Bio-Stimulants Market Snapshot (2022-2030)
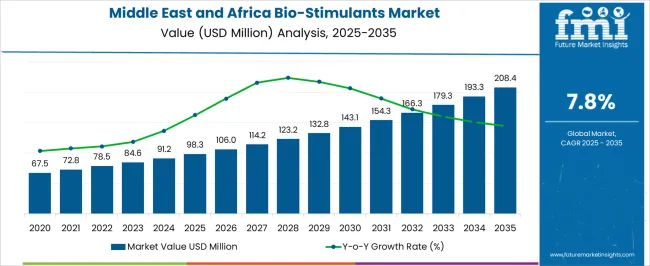
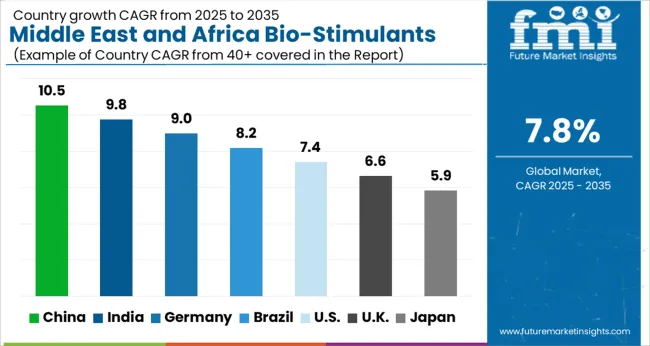
[256 Pages Report] The Middle East & Africa market of bio-stimulants is currently valued at around US$ 73,132.5 Th, and is anticipated to reach US$ 144,596.0 Th by 2030. The business is anticipated to witness a considerable CAGR of 7.9% during the period of 2022 and 2030.
Bio-Stimulants Market Value (2021A) |
US$ 73,132.5 Th |
Bio-Stimulants Market Estimates (2022E) |
US$ 78,563.9 Th |
Bio-Stimulants Market Projections (2030F) |
US$ 144,596.0 Th |
Value CAGR (2022-2030) |
7.9% |
Collective Value Share: Top 3 Countries (2022E) |
69.5% |
Owing to the increasing demand for higher crops production all over the globe, consumption rate of bio-stimulants is also estimated to witness a significant growth rate over the coming years. Considering this, FMI has forecast the global bio-stimulants sales to reach a valuation of US$ 144,596.0 Th by 2030.
Let us know your requirement to get
100% FREE customization
How The Market Progressed Till June 2022?
Market Statistics |
Details |
H1 2021(A) |
7.0% |
H1 2022 Projected |
7.5% |
H1 2022 Outlook |
7.4% |
BPS Change (H1'22 O - H1'22 P) |
(-) 10 ↓ |
BPS Change (H1'22 O - H1'21 A) |
(+) 40 ↑ |
MEA bio-stimulants market is expected to witness a growth rate of 7.4% during the first half of 2022, however the projected outlook of the market was 7.5% over the same time frame.
Variation between the BPS values observed in the bio-stimulants market in Middle East and Africa region in first half, 2022-Outlook over H1, 2022 projected reflects a loss of 10 units. Certain decline in the growth outlook is attributed to higher recovery of the economic and agricultural sector in 2021 from the pandemic crisis.
CAGR comparison analysis of the market for MEA bio-stimulants has been presented by Future Market Insights comparing half year growth outlook for 2022 as compare with 2021. The market growth is significantly influenced by demographic and certain innovation factors.
Significant development and investment in product innovation for bio-stimulants are benefiting the market owing to higher yield requirement in the farmland of Africa region. Further owing to increase in agricultural products with decreasing cultivation land, demand for bio-stimulants will rise in the Middle East and Africa region.
The bio-stimulants market is also facing certain challenges which includes, farmers' lack of knowledge about the efficacy and its advantages. Lack of investments in some countries regarding the commercialization and marketing of goods is preventing the market growth outlook. However, certain leading players are enhancing their presence in Africa region owing to significant potential for growth in the agrochemical sector.
2015-2021 Bio-Stimulants Market Outlook Compared to 2022-2030 Forecast
Between 2015 and 2021, the market for bio-stimulants grew at 6.5% compound annual growth rate in Middle East and Africa region. Growing demand for increasing crop production is augmenting the consumption rate of bio-stimulants. Decrease in the cultivation land and increasing demand for agricultural and horticultural products are demanding higher yield for crop production, which is bolstering the demand for bio-stimulants.
A number of bio-stimulants specific to the MEA agricultural industry are setting a plan in the sector's path to growth. The rising demand for bio-stimulants is as a result of the challenges faced by the MEA agricultural industry. This is fuelling the growth of the bio-stimulants market.
Scientists have sought to eliminate the effects of abiotic disturbance on plants using biological products which contain substances, with increasing agricultural output, it's essential to use more resources in ways that maximise production and observe efficiency, which is driving up the use of bio-stimulants to boost crop yield and production.
What are the growth aspects of Bio-Stimulants Market?
Bio-stimulants are substance that used to help manage an agriculture ecosystem, and to enhance the yield in farming area. In past few years, the agriculture industry witnessed positive growth, which is expected to drive the demand for bio-stimulants over the forecast period.
Bio-stimulants have recently won a reputation as an effective approach for maintaining rural sustainability and agricultural crop yields. Changes in demographic and current population growth trends are also anticipated to require more and better agricultural land, thereby increasing land scarcity and food prices.
Crop yield and quality enhancement in applicable land is predicted to gain widespread adoption in the coming years, which will set the stage for large-scale investment to develop advanced, efficient technology to mine crop produce. As a result, the African bio-stimulants market is expected to see significant growth during the projection period.
What was the Impact of COVID-19 Crisis on Bio-Stimulants Market?
As a consequence of the recent COVID-19 pandemic, supply and demand were both negatively impacted, resulting in lower market demand for products. As a result, businesses were able to continue producing goods. However, the pandemic had an impact on market dynamics in the form of a drop in demand for some crops in the aftermath of the virus. The COVID-19 pandemic, a novel coronavirus, has sent shockwaves around the world, resulting in one of, if not the worst, global crises in history.
Lockdowns enacted across countries to combat the COVID-19 pandemic have triggered the worst economic crisis in a generation. The market, on the other hand, is expected to grow during the forecast period due to its applications in various segments, which are expected to boost the market.
Find your sweet spots for generating winning opportunities in this market.
Talk to AnalystCountry-wise Insights
What is the Demand Outlook for Bio-Stimulants in Turkey?
Turkey is expected to account for a significant portion of the market, according to FMI. Turkey is expected to remain one of the dominating country in the Middle East and Africa market over the forecast period. Emerging and developing economies such as Turkey is expected to contribute significantly to the MEA economic growth.
Notably, some of the economies are expected to perform at marginal rates and witness gradual growth. Thus, GDP growth is expected to continue at a nominal rate over the next decade in Africa. Turkey is expected to be a key MEA bio-stimulants market owing to the presence of several key manufacturers in the region and high per capita consumption of the food grains and strict regulations in the region.
In terms of customer base, innovations, and geopolitical conditions, the Turkish market is extremely diverse. In the near future, this region's GDP is expected to grow significantly, propelling market growth. Turkey is expected to reach about US$ 6,974.2 Th by the year 2030.
What are the growth prospects of Bio-Stimulants in South Africa?
South Africa is projected reach an estimated value of US$ 11,866.1 Th by the end of 2030. In terms of improving organic practices, bio-stimulants are critical for the agricultural industry's future. Bio-stimulants can help to improve soil microflora, which helps to improve nutrient uptake efficiency.
Due to their environmentally friendly nature and performance efficiency, bio-stimulants are a great alternative for chemical-based agro products, and they are replacing them at a faster rate. Growing demand for low energy agricultural products, especially in the countries of Sub-Saharan Africa, South Africa and others, is creating a new market opportunity for Bio-Stimulants. Furthermore, rising awareness of the benefits of using bio-stimulants is propelling the market forward.
Category-wise Insights
How will growth of Row Crop segment is anticipated to benefit the Market Growth?
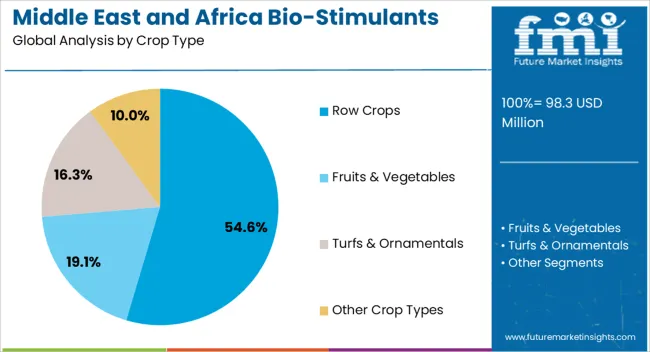
Raw crop type segment is expected to grow at a prominent value of 7.8% CAGR, over the forecast period of 2022 to 2030. Based on crop type, row crops are expected to create growth opportunities in the overall biostimulants market. Soybeans, corn, oats, barley, millets, and cotton are among them. These crops are widely grown in large areas around the world and provide considerable growth opportunities for the industry.
For crops like barley, soybeans, and corn, bio-stimulants are used to increase seed size, cell division rate, and yields. Bio-stimulants have been steadily used to cultivate cereals and row crops around the world. Moreover, the high cultivation of organic cereals will contribute to this demand. Organic farming is growing in acceptance and popularity in order to fulfill rising demand and is expected to widen massive growth opportunities for the industry.
What are the Sales Prospects of Active Ingredients in the Biostimulants Market?
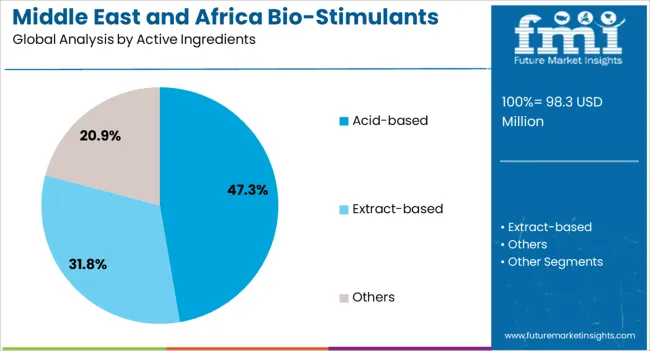
The acid based active ingredients segment is projected to create an absolute dollar opportunity of more than US$ 29,999.7 Th during the period of 2022 to 2030. The most common active ingredient is cid-based biostimulants. The acid-based segment includes humic, fulvic, and amino acid-based products. They encourage the plant growth producing flower in the plant, set fruit, pollinate, and develop fruit.
Humic acids occur naturally as the end products of microorganisms and fungi, as well as chemical deterioration of plant and animal byproducts in soil. Biostimulants previously featured a singular active ingredient that was tissue-specific. Industries have been developing formulas with blends of numerous active ingredients. Owing to the above factors, acid based active ingredients are expected to grow with a CAGR of 7.6% during the forecast period.

An unified Market Research Subscription Platform, built for today’s disparate research needs.
Scope of Report
Attribute |
Details |
Forecast Period |
2022-2030 |
Historical Data Available for |
2015-2021 |
Market Analysis |
USD Thousand for Value and Tons for Volume |
Key Countries Covered |
Egypt, Algeria, Morocco, South Africa, Ghana, Libya, Nigeria, Tunisia, Turkey, GCC Countries, Senegal |
Key Segments Covered |
Crop Type, Active Ingredients, Application and Countries |
Key Companies Profiled |
|
Report Coverage |
Market Forecast, Company Share Analysis, Competition Intelligence, DROT Analysis, Market Dynamics and Challenges, and Strategic Growth Initiatives |
Customization & Pricing |
Available upon Request |
Bio-Stimulants Market by Category
By Crop Type, the Bio-Stimulants Market is segmented as:
- Row Crops
- Fruits & Vegetables
- Turfs & Ornamentals
- Other Crop Types
By Active Ingredients, the market of Bio-Stimulants is segmented as:
- Acid-Based
- Extract-Based
- Others (Including Microbial Amendment, Trace Minerals, etc.)
By Application, the Bio-Stimulants Market is segmented as:
- Foliar
- Soil
- Seed
By Region, the market of Bio-Stimulants is segmented as:
- Egypt
- Algeria
- Morocco
- Tunisia
- Ghana
- Nigeria
- Senegal
- South Africa
- GCC Countries
- Turkey
- Libya
Frequently Asked Questions
The market of bio-stimulants is expected to total US$ 73,132.5 Th in 2021.
The bio-stimulants market has been estimated to exhibit growth rate of 7.9% between 2022 and 2030 on value basis in Middle East and Africa region.
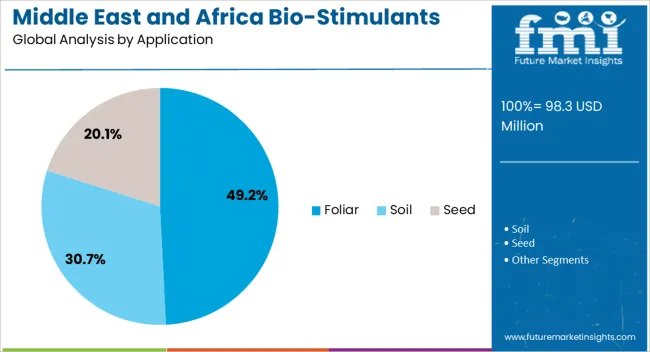
Foliar application is expected to contribute significantly to the growth of the overall market in 2022.
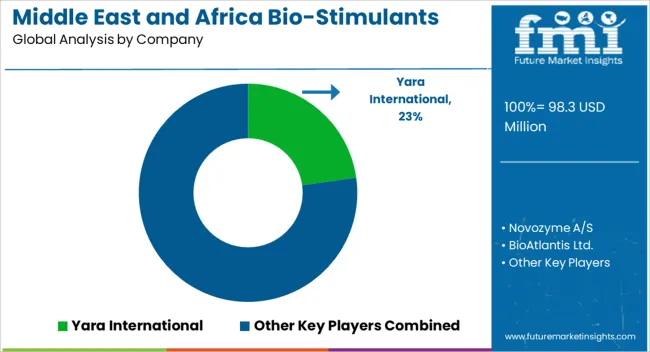
Yara International, BASF SE, Isagro S.p.A., Novozyme A/S, UPL Corporation Limited, BioAtlantis Ltd., Koppert B.V., Syngenta AG, Valagro SpA, Haifa Group, and others are the key players in the market of bio-stimulants.
The demand of biostimulants in Turkey is expected to increase by 7.9% CAGR between 2022 and 2030 on value basis.
Table of Content
1. Executive Summary
1.1. Middle East & Africa Market Outlook
1.2. Demand Side Trends
1.3. Supply Side Trends
1.4. Technology Roadmap
1.5. Analysis and Recommendations
2. Market Overview
2.1. Market Coverage / Taxonomy
2.2. Market Definition / Scope / Limitations
3. Key Market Trends
3.1. Key Trends Impacting the Market
3.2. Innovation / Development Trends
4. Key Success Factors
4.1. Services Adoption / Usage Analysis
5. Middle East & Africa Bio-Stimulants Market Demand Analysis 2015-2021 and Forecast, 2022-2030
5.1. Historical Market Volume (Units) Analysis, 2015-2021
5.2. Current and Future Market Volume (Units) Projections, 2022-2030
5.3. Y-o-Y Growth Trend Analysis
6. Middle East & Africa Bio-Stimulants Market - Pricing Analysis
6.1. Country Pricing Analysis By Active Ingredients
6.2. Pricing Break-up
7. Middle East & Africa Bio-Stimulants Market Demand (in Value or Size in US$ Mn) Analysis 2015-2021 and Forecast, 2022-2030
7.1. Historical Market Value (US$ Mn) Analysis, 2015-2021
7.2. Current and Future Market Value (US$ Mn) Projections, 2022-2030
7.2.1. Y-o-Y Growth Trend Analysis
7.2.2. Absolute $ Opportunity Analysis
8. Market Background
8.1. Macro-Economic Factors
8.1.1. Middle East & Africa Agricultural Industry Overview
8.1.2. Middle East & Africa Harvesting Area Overview
8.1.3. Middle East & Africa GDP Outlook
8.2. Forecast Factors - Relevance & Impact
8.2.1. Top Companies Historical Growth
8.2.2. Middle East & Africa Urbanization Growth Outlook
8.2.3. Manufacturers R&D Investments
8.2.4. Competition Among Manufacturers
8.2.5. Raw Material Prices
8.2.6. Organic and Inorganic Strategies
8.2.7. Power Prices
8.2.8. Bio-Stimulants: Product Life Cycle Analysis
8.2.9. Product Substitutes and Market Entrants
8.3. Value Chain – List of Manufacturers, Distributors and Respective Profit Margins
8.4. Impact of COVID – 19 Crisis
8.4.1. Current Statistics
8.4.2. Expected Recovery and Comparison with Sub-Prime Crisis
8.4.3. World Economy / Cluster Projections
8.5. Potential of Impact by Taxonomy
8.6. 2022 Market Size
8.6.1. Recovery by Quarters
8.6.2. Recovery Scenario (Short, Mid and Long term)
8.7. Long Term Projections
8.8. Market Dynamics
8.8.1. Drivers
8.8.2. Restraints
8.8.3. Opportunity Analysis
9. Middle East & Africa Bio-Stimulants Market Analysis 2015-2021 and Forecast 2022-2030, By Active Ingredients
9.1. Introduction / Key Findings
9.2. Historical Market Size (US$ Mn) and Volume Analysis By Active Ingredients, 2015-2021
9.3. Current and Future Market Size (US$ Mn) and Volume Analysis and Forecast By Active Ingredients, 2022-2030
9.3.1. Acid-Based
9.3.2. Extract-Based
9.3.3. Others
10. Middle East & Africa Bio-Stimulants Market Analysis 2015-2021 and Forecast 2022-2030, By Application
10.1. Introduction / Key Findings
10.2. Historical Market Size (US$ Mn) and Volume Analysis By Application, 2015-2021
10.3. Current and Future Market Size (US$ Mn) and Volume Analysis and Forecast By Application, 2022-2030
10.3.1. Foliar
10.3.2. Soil
10.3.3. Seed
11. Middle East & Africa Bio-Stimulants Market Analysis 2015-2021 and Forecast 2022-2030, By Crops
11.1. Introduction / Key Findings
11.2. Historical Market Size (US$ Mn) and Volume Analysis By Crops, 2015-2021
11.3. Current and Future Market Size (US$ Mn) and Volume Analysis and Forecast By Crops, 2022-2030
11.3.1. Row Crops
11.3.2. Fruits & Vegetables
11.3.3. Turfs & Ornamentals
11.3.4. Other Crop Types
12. Middle East & Africa Bio-Stimulants Market Analysis 2015-2021 and Forecast 2022-2030, by Country
12.1. Introduction
12.2. Historical Market Size (US$ Mn) and Volume Analysis By Country, 2015-2021
12.3. Current Market Size (US$ Mn) and Volume Analysis and Forecast By Country, 2022-2030
12.3.1. Egypt
12.3.2. Algeria
12.3.3. Morocco
12.3.4. Nigeria
12.3.5. South Africa
12.3.6. Ghana
12.3.7. Tunisia
12.3.8. Senegal
12.3.9. GCC Countries
12.3.10. Turkey
12.3.11. Libya
12.4. Market Attractiveness Analysis By Country
13. Egypt Bio-Stimulants Market Analysis 2015-2021 and Forecast 2022-2030
13.1. Introduction
13.2. Pricing Analysis
13.3. Historical Market Size (US$ Mn) and Volume Trend Analysis By Market Taxonomy, 2015-2021
13.4. Market Size (US$ Mn) and Volume Forecast By Market Taxonomy, 2022-2030
13.4.1. By Active Ingredients
13.4.2. By Application
13.4.3. By Crops
13.5. Market Attractiveness Analysis
13.5.1. By Active Ingredients
13.5.2. By Application
13.5.3. By Crops
14. Algeria Bio-Stimulants Market Analysis 2015-2021 and Forecast 2022-2030
14.1. Introduction
14.2. Pricing Analysis
14.3. Historical Market Size (US$ Mn) and Volume Trend Analysis By Market Taxonomy, 2015-2021
14.4. Market Size (US$ Mn) and Volume Forecast By Market Taxonomy, 2022-2030
14.4.1. By Active Ingredients
14.4.2. By Application
14.4.3. By Crops
14.5. Market Attractiveness Analysis
14.5.1. By Active Ingredients
14.5.2. By Application
14.5.3. By Crops
15. Morocco Bio-Stimulants Market Analysis 2015-2021 and Forecast 2022-2030
15.1. Introduction
15.2. Pricing Analysis
15.3. Historical Market Size (US$ Mn) and Volume Trend Analysis By Market Taxonomy, 2015-2021
15.4. Market Size (US$ Mn) and Volume Forecast By Market Taxonomy, 2022-2030
15.4.1. By Active Ingredients
15.4.2. By Application
15.4.3. By Crops
15.5. Market Attractiveness Analysis
15.5.1. By Active Ingredients
15.5.2. By Application
15.5.3. By Crops
16. South Africa Bio-Stimulants Market Analysis 2015-2021 and Forecast 2022-2030
16.1. Introduction
16.2. Pricing Analysis
16.3. Historical Market Size (US$ Mn) and Volume Trend Analysis By Market Taxonomy, 2015-2021
16.4. Market Size (US$ Mn) and Volume Forecast By Market Taxonomy, 2022-2030
16.4.1. By Active Ingredients
16.4.2. By Application
16.4.3. By Crops
16.5. Market Attractiveness Analysis
16.5.1. By Active Ingredients
16.5.2. By Application
16.5.3. By Crops
17. Nigeria Bio-Stimulants Market Analysis 2015-2021 and Forecast 2022-2030
17.1. Introduction
17.2. Pricing Analysis
17.3. Historical Market Size (US$ Mn) and Volume Trend Analysis By Market Taxonomy, 2015-2021
17.4. Market Size (US$ Mn) and Volume Forecast By Market Taxonomy, 2022-2030
17.4.1. By Active Ingredients
17.4.2. By Application
17.4.3. By Crops
17.5. Market Attractiveness Analysis
17.5.1. By Active Ingredients
17.5.2. By Application
17.5.3. By Crops
18. Ghana Bio-Stimulants Market Analysis 2015-2021 and Forecast 2022-2030
18.1. Introduction
18.2. Pricing Analysis
18.3. Historical Market Size (US$ Mn) and Volume Trend Analysis By Market Taxonomy, 2015-2021
18.4. Market Size (US$ Mn) and Volume Forecast By Market Taxonomy, 2022-2030
18.4.1. By Active Ingredients
18.4.2. By Application
18.4.3. By Crops
18.5. Market Attractiveness Analysis
18.5.1. By Active Ingredients
18.5.2. By Application
18.5.3. By Crops
19. Senegal Bio-Stimulants Market Analysis 2015-2021 and Forecast 2022-2030
19.1. Introduction
19.2. Pricing Analysis
19.3. Historical Market Size (US$ Mn) and Volume Trend Analysis By Market Taxonomy, 2015-2021
19.4. Market Size (US$ Mn) and Volume Forecast By Market Taxonomy, 2022-2030
19.4.1. By Active Ingredients
19.4.2. By Application
19.4.3. By Crops
19.5. Market Attractiveness Analysis
19.5.1. By Active Ingredients
19.5.2. By Application
19.5.3. By Crops
20. Tunisia Bio-Stimulants Market Analysis 2015-2021 and Forecast 2022-2030
20.1. Introduction
20.2. Pricing Analysis
20.3. Historical Market Size (US$ Mn) and Volume Trend Analysis By Market Taxonomy, 2015-2021
20.4. Market Size (US$ Mn) and Volume Forecast By Market Taxonomy, 2022-2030
20.4.1. By Active Ingredients
20.4.2. By Application
20.4.3. By Crops
20.5. Market Attractiveness Analysis
20.5.1. By Active Ingredients
20.5.2. By Application
20.5.3. By Crops
21. GCC Countries Bio-Stimulants Market Analysis 2015-2021 and Forecast 2022-2030
21.1. Introduction
21.2. Pricing Analysis
21.3. Historical Market Size (US$ Mn) and Volume Trend Analysis By Market Taxonomy, 2015-2021
21.4. Market Size (US$ Mn) and Volume Forecast By Market Taxonomy, 2022-2030
21.4.1. By Active Ingredients
21.4.2. By Application
21.4.3. By Crops
21.4.4. By Country
21.4.4.1. Bahrain
21.4.4.2. Kuwait
21.4.4.3. Oman
21.4.4.4. Qatar
21.4.4.5. Saudi Arabia
21.4.4.6. UAE
21.5. Market Attractiveness Analysis
21.5.1. By Active Ingredients
21.5.2. By Application
21.5.3. By Crops
21.5.4. By Country
22. Libya Bio-Stimulants Market Analysis 2015-2021 and Forecast 2022-2030
22.1. Introduction
22.2. Pricing Analysis
22.3. Historical Market Size (US$ Mn) and Volume Trend Analysis By Market Taxonomy, 2015-2021
22.4. Market Size (US$ Mn) and Volume Forecast By Market Taxonomy, 2022-2030
22.4.1. By Active Ingredients
22.4.2. By Application
22.4.3. By Crops
22.5. Market Attractiveness Analysis
22.5.1. By Active Ingredients
22.5.2. By Application
22.5.3. By Crops
23. Turkey Bio-Stimulants Market Analysis 2015-2021 and Forecast 2022-2030
23.1. Introduction
23.2. Pricing Analysis
23.3. Historical Market Size (US$ Mn) and Volume Trend Analysis By Market Taxonomy, 2015-2021
23.4. Market Size (US$ Mn) and Volume Forecast By Market Taxonomy, 2022-2030
23.4.1. By Active Ingredients
23.4.2. By Application
23.4.3. By Crops
23.5. Market Attractiveness Analysis
23.5.1. By Active Ingredients
23.5.2. By Application
23.5.3. By Crops
24. Market Structure Analysis
24.1. Market Analysis by Tier of Companies (Bio-Stimulants)
24.2. Market Concentration
24.3. Market Share Analysis of Top Players
24.4. Market Presence Analysis
24.4.1. By Country footprint of Players
24.4.2. Product foot print by Players
24.4.3. Channel Foot Print by Players
25. Competition Analysis
25.1. Competition Dashboard
25.2. Pricing Analysis by Competition
25.3. Competition Benchmarking
25.4. Competition Deep Dive
25.4.1. Yara International
25.4.1.1. Overview
25.4.1.2. Product Portfolio
25.4.1.3. Profitability by Market Segments (Product/Channel/Country)
25.4.1.4. Sales Footprint
25.4.1.5. Strategy Overview
25.4.1.5.1. Marketing Strategy
25.4.1.5.2. Product Strategy
25.4.1.5.3. Channel Strategy
25.4.2. BASF SE
25.4.2.1. Overview
25.4.2.2. Product Portfolio
25.4.2.3. Profitability by Market Segments (Product/Channel/Country)
25.4.2.4. Sales Footprint
25.4.2.5. Strategy Overview
25.4.2.5.1. Marketing Strategy
25.4.2.5.2. Product Strategy
25.4.2.5.3. Channel Strategy
25.4.3. Isagro S.p.A.
25.4.3.1. Overview
25.4.3.2. Product Portfolio
25.4.3.3. Profitability by Market Segments (Product/Channel/Country)
25.4.3.4. Sales Footprint
25.4.3.5. Strategy Overview
25.4.3.5.1. Marketing Strategy
25.4.3.5.2. Product Strategy
25.4.3.5.3. Channel Strategy
25.4.4. Novozyme A/S
25.4.4.1. Overview
25.4.4.2. Product Portfolio
25.4.4.3. Profitability by Market Segments (Product/Channel/Country)
25.4.4.4. Sales Footprint
25.4.4.5. Strategy Overview
25.4.4.5.1. Marketing Strategy
25.4.4.5.2. Product Strategy
25.4.4.5.3. Channel Strategy
25.4.5. UPL Corporation Limited
25.4.5.1. Overview
25.4.5.2. Product Portfolio
25.4.5.3. Profitability by Market Segments (Product/Channel/Country)
25.4.5.4. Sales Footprint
25.4.5.5. Strategy Overview
25.4.5.5.1. Marketing Strategy
25.4.5.5.2. Product Strategy
25.4.5.5.3. Channel Strategy
25.4.6. BioAtlantis Ltd.
25.4.6.1. Overview
25.4.6.2. Product Portfolio
25.4.6.3. Profitability by Market Segments (Product/Channel/Country)
25.4.6.4. Sales Footprint
25.4.6.5. Strategy Overview
25.4.6.5.1. Marketing Strategy
25.4.6.5.2. Product Strategy
25.4.6.5.3. Channel Strategy
25.4.7. Koppert B.V.
25.4.7.1. Overview
25.4.7.2. Product Portfolio
25.4.7.3. Profitability by Market Segments (Product/Channel/Country)
25.4.7.4. Sales Footprint
25.4.7.5. Strategy Overview
25.4.7.5.1. Marketing Strategy
25.4.7.5.2. Product Strategy
25.4.7.5.3. Channel Strategy
25.4.8. Syngenta AG
25.4.8.1. Overview
25.4.8.2. Product Portfolio
25.4.8.3. Profitability by Market Segments (Product/Channel/Country)
25.4.8.4. Sales Footprint
25.4.8.5. Strategy Overview
25.4.8.5.1. Marketing Strategy
25.4.8.5.2. Product Strategy
25.4.8.5.3. Channel Strategy
25.4.9. Seipasa
25.4.9.1. Overview
25.4.9.2. Product Portfolio
25.4.9.3. Profitability by Market Segments (Product/Channel/Country)
25.4.9.4. Sales Footprint
25.4.9.5. Strategy Overview
25.4.9.5.1. Marketing Strategy
25.4.9.5.2. Product Strategy
25.4.9.5.3. Channel Strategy
25.4.10. Omex Agrifluids Ltd.
25.4.10.1. Overview
25.4.10.2. Product Portfolio
25.4.10.3. Profitability by Market Segments (Product/Channel/Country)
25.4.10.4. Sales Footprint
25.4.10.5. Strategy Overview
25.4.10.5.1. Marketing Strategy
25.4.10.5.2. Product Strategy
25.4.10.5.3. Channel Strategy
25.4.11. Valagro SpA
25.4.11.1. Overview
25.4.11.2. Product Portfolio
25.4.11.3. Profitability by Market Segments (Product/Channel/Country)
25.4.11.4. Sales Footprint
25.4.11.5. Strategy Overview
25.4.11.5.1. Marketing Strategy
25.4.11.5.2. Product Strategy
25.4.11.5.3. Channel Strategy
25.4.12. Trade Corporation International-Omnia
25.4.12.1. Overview
25.4.12.2. Product Portfolio
25.4.12.3. Profitability by Market Segments (Product/Channel/Country)
25.4.12.4. Sales Footprint
25.4.12.5. Strategy Overview
25.4.12.5.1. Marketing Strategy
25.4.12.5.2. Product Strategy
25.4.12.5.3. Channel Strategy
25.4.13. Haifa Group
25.4.13.1. Overview
25.4.13.2. Product Portfolio
25.4.13.3. Profitability by Market Segments (Product/Channel/Country)
25.4.13.4. Sales Footprint
25.4.13.5. Strategy Overview
25.4.13.5.1. Marketing Strategy
25.4.13.5.2. Product Strategy
25.4.13.5.3. Channel Strategy
25.4.14. Kelp Products International
25.4.14.1. Overview
25.4.14.2. Product Portfolio
25.4.14.3. Profitability by Market Segments (Product/Channel/Country)
25.4.14.4. Sales Footprint
25.4.14.5. Strategy Overview
25.4.14.5.1. Marketing Strategy
25.4.14.5.2. Product Strategy
25.4.14.5.3. Channel Strategy
25.4.15. Madumbi-Andermatt Group
25.4.15.1. Overview
25.4.15.2. Product Portfolio
25.4.15.3. Profitability by Market Segments (Product/Channel/Country)
25.4.15.4. Sales Footprint
25.4.15.5. Strategy Overview
25.4.15.5.1. Marketing Strategy
25.4.15.5.2. Product Strategy
25.4.15.5.3. Channel Strategy
25.4.16. Greenlife Crop Protection Africa
25.4.16.1. Overview
25.4.16.2. Product Portfolio
25.4.16.3. Profitability by Market Segments (Product/Channel/Country)
25.4.16.4. Sales Footprint
25.4.16.5. Strategy Overview
25.4.16.5.1. Marketing Strategy
25.4.16.5.2. Product Strategy
25.4.16.5.3. Channel Strategy
Note: List of companies may be further augmented and refined during the course of research study
26. Assumptions and Acronyms Used
27. Research Methodology
Let us know your requirement to get
100% FREE customization
List of Tables
Table 01: MEA Bio-Stimulants Market Size (US$ Th.) and Volume (Tons) Forecast by Active Ingredient, 2015–2030
Table 02: MEA Bio-Stimulants Market Size (US$ Th.) and Volume (Tons) Forecast by Crop Type, 2015–2030
Table 03: MEA Bio-Stimulants Market Volume (Tons) Forecast by Application, 2015–2030
Table 04: MEA Bio-Stimulants Market Size (US$ Th.) Forecast by Country, 2015–2030
Table 05: MEA Bio-Stimulants Market Volume (Tons.) Forecast by Country, 2015–2030
Table 06: Egypt Bio-Stimulants Market Size (US$ Th.) and Volume (Tons) Forecast by Active Ingredient, 2015–2030
Table 07: Egypt Bio-Stimulants Market Size (US$ Th.) and Volume (Tons) Forecast by Crop Type, 2015–2030
Table 08: Egypt Bio-Stimulants Market Value (US$ Th.) and Volume (Tons) Forecast by Application, 2015–2030
Table 09: GCC Countries Bio-Stimulants Market Size (US$ Th.) and Volume (Tons) Forecast by Country, 2015–2030
Table 10: GCC Countries Bio-Stimulants Market Size (US$ Th.) and Volume (Tons) Forecast by Active Ingredient, 2015–2030
Table 11: GCC Countries Bio-Stimulants Market Size (US$ Th.) and Volume (Tons) Forecast by Crop Type, 2015–2030
Table 12: GCC Countries Bio-Stimulants Market Value (US$ Th.) and Volume (Tons) Forecast by Application, 2015–2030
Table 13: Turkey Bio-Stimulants Market Size (US$ Th.) and Volume (Tons) Forecast by Active Ingredient, 2015–2030
Table 14: Turkey Bio-Stimulants Market Size (US$ Th.) and Volume (Tons) Forecast by Crop Type, 2015–2030
Table 15: Turkey Bio-Stimulants Market Value (US$ Th.) and Volume (Tons) Forecast by Application, 2015–2030
Table 16: Libya Bio-Stimulants Market Size (US$ Th.) and Volume (Tons) Forecast by Active Ingredient, 2015–2030
Table 17: Libya Bio-Stimulants Market Size (US$ Th.) and Volume (Tons) Forecast by Crop Type, 2015–2030
Table 18: Libya Bio-Stimulants Market Volume (Tons) Forecast by Application, 2015–2030
Table 19: Algeria Bio-Stimulants Market Size (US$ Th.) and Volume (Tons) Forecast by Active Ingredient, 2015–2030
Table 20: Algeria Bio-Stimulants Market Size (US$ Th.) and Volume (Tons) Forecast by Crop Type, 2015–2030
Table 21: Algeria Bio-Stimulants Market Value (US$ Th.) and Volume (Tons) Forecast by Application, 2015–2030
Table 22: Morocco Bio-Stimulants Market Size (US$ Th.) and Volume (Tons) Forecast by Active Ingredient, 2015–2030
Table 23: Morocco Bio-Stimulants Market Size (US$ Th.) and Volume (Tons) Forecast by Crop Type, 2015–2030
Table 24: Morocco Bio-Stimulants Market Value (US$ Th.) and Volume (Tons) Forecast by Application, 2015–2030
Table 25: Tunisia Bio-Stimulants Market Size (US$ Th.) and Volume (Tons) Forecast by Active Ingredient, 2015–2030
Table 26: Tunisia Bio-Stimulants Market Size (US$ Th.) and Volume (Tons) Forecast by Crop Type, 2015–2030
Table 27: Tunisia Bio-Stimulants Market Volume (Tons) Forecast by Application, 2015–2030
Table 28: Ghana Bio-Stimulants Market Size (US$ Th.) and Volume (Tons) Forecast by Active Ingredient, 2015–2030
Table 29: Ghana Bio-Stimulants Market Size (US$ Th.) and Volume (Tons) Forecast by Crop Type, 2015–2030
Table 30: Ghana Bio-Stimulants Market Value (US$ Th.) and Volume (Tons) Forecast by Application, 2015–2030
Table 31: Nigeria Bio-Stimulants Market Size (US$ Th.) and Volume (Tons) Forecast by Active Ingredient, 2015–2030
Table 32: Nigeria Bio-Stimulants Market Size (US$ Th.) and Volume (Tons) Forecast by Crop Type, 2015–2030
Table 33: Nigeria Bio-Stimulants Market Value (US$ Th.) and Volume (Tons) Forecast by Application, 2015–2030
Table 34: Senegal Bio-Stimulants Market Size (US$ Th.) and Volume (Tons) Forecast by Active Ingredient, 2015–2030
Table 35: Senegal Bio-Stimulants Market Size (US$ Th.) and Volume (Tons) Forecast by Crop Type, 2015–2030
Table 36: Senegal Bio-Stimulants Market Value (US$ Th.) and Volume (Tons) Forecast by Application, 2015–2030
Table 37: South Africa Bio-Stimulants Market Size (US$ Th.) and Volume (Tons) Forecast by Active Ingredient, 2015–2030
Table 38: South Africa Bio-Stimulants Market Size (US$ Th.) and Volume (Tons) Forecast by Crop Type, 2015–2030
Table 39: South Africa Bio-Stimulants Market Value (US$ Th.) and Volume (Tons) Forecast by Application, 2015–2030
Find your sweet spots for generating winning opportunities in this market.
Talk to AnalystList of Charts
Figure 01: MEA Bio-Stimulants Market Share and BPS Analysis by Active Ingredient, 2022 & 2030
Figure 02: MEA Bio-Stimulants Market Y-o-Y Growth by Active Ingredient, 2022-2030
Figure 03: MEA Bio-Stimulants Market Attractiveness Analysis by Active Ingredient, 2022-2030
Figure 04: MEA Bio-Stimulants Market Absolute $ Opportunity by Acid-Based Segment, 2015–2030
Figure 05: MEA Bio-Stimulants Market Absolute $ Opportunity by Extract-Based Segment, 2015–2030
Figure 06: MEA Bio-Stimulants Market Absolute $ Opportunity by Others Segment, 2015–2030
Figure 07: MEA Bio-Stimulants Market Share and BPS Analysis by Crop Type, 2022 & 2030
Figure 08: MEA Bio-Stimulants Market Y-o-Y Growth by Crop Type, 2022-2030
Figure 09: MEA Bio-Stimulants Market Attractiveness Analysis by Crop Type,2022-2030
Figure 10: MEA Bio-Stimulants Market Absolute $ Opportunity by Row Crops Segment, 2015–2030
Figure 11: MEA Bio-Stimulants Market Absolute $ Opportunity by Fruits & Vegetables Segment, 2015–2030
Figure 12: MEA Bio-Stimulants Market Absolute $ Opportunity by Turfs & Ornamentals Segment, 2015–2030
Figure 13: MEA Bio-Stimulants Market Absolute $ Opportunity by Other Crop Types Segment, 2015–2030
Figure 14: MEA Bio-Stimulants Market Share and BPS Analysis by Application, 2022 & 2030
Figure 15: MEA Bio-Stimulants Market Y-o-Y Growth by Application, 2022-2030
Figure 16: MEA Bio-Stimulants Market Attractiveness Analysis by Application, 2022-2030
Figure 17: MEA Bio-Stimulants Market Absolute $ Opportunity by Foliar Segment, 2015–2030
Figure 18: MEA Bio-Stimulants Market Absolute $ Opportunity by Soil Segment, 2015–2030
Figure 19: MEA Bio-Stimulants Market Absolute $ Opportunity by Seed Segment, 2015–2030
Figure 20: MEA Bio-Stimulants Market Share and BPS Analysis by Country, 2022 & 2030
Figure 21: MEA Bio-Stimulants Market Y-o-Y Growth by Country, 2022-2030
Figure 22: MEA Bio-Stimulants Market Attractiveness Analysis by Country, 2022-2030
Figure 23: Egypt Bio-Stimulants Market Absolute $ Opportunity, 2015–2030
Figure 24: Algeria Bio-Stimulants Market Absolute $ Opportunity, 2015–2030
Figure 25: Morocco Bio-Stimulants Market Absolute $ Opportunity, 2015–2030
Figure 26: South Africa Bio-Stimulants Market Absolute $ Opportunity, 2015–2030
Figure 27: Nigeria Bio-Stimulants Market Absolute $ Opportunity, 2015–2030
Figure 28: Ghana Bio-Stimulants Market Absolute $ Opportunity, 2015–2030
Figure 29: Senegal Bio-Stimulants Market Absolute $ Opportunity, 2015–2030
Figure 30: Tunisia Bio-Stimulants Market Absolute $ Opportunity, 2015–2030
Figure 31: GCC Countries Bio-Stimulants Market Absolute $ Opportunity, 2015–2030
Figure 32: Turkey Bio-Stimulants Market Absolute $ Opportunity, 2015–2030
Figure 33: Libya Bio-Stimulants Market Absolute $ Opportunity by Seed Segment, 2015–2030
Figure 34: Egypt Bio-Stimulants Market Share and BPS Analysis by Active Ingredient, 2022 & 2030
Figure 35: Egypt Bio-Stimulants Market Y-o-Y Growth by Active Ingredient, 2022-2030
Figure 36: Egypt Bio-Stimulants Market Attractiveness Analysis by Active Ingredient, 2022-2030
Figure 37: Egypt Bio-Stimulants Market Share and BPS Analysis by Crop Type, 2022 & 2030
Figure 38: Egypt Bio-Stimulants Market Y-o-Y Growth by Crop Type, 2022-2030
Figure 39: Egypt Bio-Stimulants Market Attractiveness Analysis by Crop Type,2022-2030
Figure 40: Egypt Bio-Stimulants Market Share and BPS Analysis by Application, 2022 & 2030
Figure 41: Egypt Bio-Stimulants Market Y-o-Y Growth by Application, 2022-2030
Figure 42: Egypt Bio-Stimulants Market Attractiveness Analysis by Application, 2022-2030
Figure 43: GCC Countries Bio-Stimulants Market Share and BPS Analysis by Country, 2022 & 2030
Figure 44: GCC Countries Bio-Stimulants Market Y-o-Y Growth by Country, 2022-2030
Figure 45: GCC Countries Bio-Stimulants Market Attractiveness Analysis by Country, 2022-2030
Figure 46: Bahrain Bio-Stimulants Market Absolute $ Opportunity, 2015–2030
Figure 47: Kuwait Bio-Stimulants Market Absolute $ Opportunity, 2015–2030
Figure 48: Oman Bio-Stimulants Market Absolute $ Opportunity, 2015–2030
Figure 49: Qatar Bio-Stimulants Market Absolute $ Opportunity, 2015–2030
Figure 50: Saudi Arabia Bio-Stimulants Market Absolute $ Opportunity, 2015–2030
Figure 51: UAE Bio-Stimulants Market Absolute $ Opportunity, 2015–2030
Figure 52: GCC Countries Bio-Stimulants Market Share and BPS Analysis by Active Ingredient, 2022 & 2030
Figure 53: GCC Countries Bio-Stimulants Market Y-o-Y Growth by Active Ingredient, 2022-2030
Figure 54: GCC Countries Bio-Stimulants Market Attractiveness Analysis by Active Ingredient, 2022-2030
Figure 55: GCC Countries Bio-Stimulants Market Share and BPS Analysis by Crop Type, 2022 & 2030
Figure 56: GCC Countries Bio-Stimulants Market Y-o-Y Growth by Crop Type, 2022-2030
Figure 57: GCC Countries Market Attractiveness Analysis by Crop Type, 2022-2030
Figure 58: GCC Countries Bio-Stimulants Market Share and BPS Analysis by Application, 2022 & 2030
Figure 59: GCC Countries Bio-Stimulants Market Y-o-Y Growth by Application, 2022-2030
Figure 60: GCC Countries Bio-Stimulants Market Attractiveness Analysis by Application, 2022-2030
Figure 61: Turkey Bio-Stimulants Market Share and BPS Analysis by Active Ingredient, 2022 & 2030
Figure 62: Turkey Bio-Stimulants Market Y-o-Y Growth by Active Ingredient, 2022-2030
Figure 63: Turkey Bio-Stimulants Market Attractiveness Analysis by Active Ingredient, 2022-2030
Figure 64: Turkey Bio-Stimulants Market Share and BPS Analysis by Crop Type, 2022 & 2030
Figure 65: Turkey Bio-Stimulants Market Y-o-Y Growth by Crop Type, 2022-2030
Figure 66: Turkey Bio-Stimulants Market Attractiveness Analysis by Crop Type, 2022-2030
Figure 67: Turkey Bio-Stimulants Market Share and BPS Analysis by Application, 2022 & 2030
Figure 68: Turkey Bio-Stimulants Market Y-o-Y Growth by Application, 2022-2030
Figure 69: Turkey Bio-Stimulants Market Attractiveness Analysis by Application, 2022-2030
Figure 70: Libya Bio-Stimulants Market Share and BPS Analysis by Active Ingredient, 2022 & 2030
Figure 71: Libya Bio-Stimulants Market Y-o-Y Growth by Active Ingredient, 2022-2030
Figure 72: Libya Bio-Stimulants Market Attractiveness Analysis by Active Ingredient, 2022-2030
Figure 73: Libya Bio-Stimulants Market Share and BPS Analysis by Crop Type, 2022 & 2030
Figure 74: Libya Bio-Stimulants Market Y-o-Y Growth by Crop Type, 2022-2030
Figure 75: Libya Bio-Stimulants Market Attractiveness Analysis by Crop Type,2022-2030
Figure 76: Libya Bio-Stimulants Market Share and BPS Analysis by Application, 2022 & 2030
Figure 77: Libya Bio-Stimulants Market Y-o-Y Growth by Application, 2022-2030
Figure 78: Libya Bio-Stimulants Market Attractiveness Analysis by Application, 2022-2030
Figure 79: Algeria Bio-Stimulants Market Share and BPS Analysis by Active Ingredient, 2022 & 2030
Figure 80: Algeria Bio-Stimulants Market Y-o-Y Growth by Active Ingredient, 2022-2030
Figure 81: Algeria Bio-Stimulants Market Attractiveness Analysis by Active Ingredient, 2022-2030
Figure 82: Algeria Bio-Stimulants Market Share and BPS Analysis by Crop Type, 2022 & 2030
Figure 83: Algeria Bio-Stimulants Market Y-o-Y Growth by Crop Type, 2022-2030
Figure 84: Algeria Bio-Stimulants Market Attractiveness Analysis by Crop Type,2022-2030
Figure 85: Algeria Bio-Stimulants Market Share and BPS Analysis by Application, 2022 & 2030
Figure 86: Algeria Bio-Stimulants Market Y-o-Y Growth by Application, 2022-2030
Figure 87: Algeria Bio-Stimulants Market Attractiveness Analysis by Application, 2022-2030
Figure 89: Morocco Bio-Stimulants Market Share and BPS Analysis by Active Ingredient, 2022 & 2030
Figure 90: Morocco Bio-Stimulants Market Y-o-Y Growth by Active Ingredient, 2022-2030
Figure 91: Morocco Bio-Stimulants Market Attractiveness Analysis by Active Ingredient, 2022-2030
Figure 92: Morocco Bio-Stimulants Market Share and BPS Analysis by Crop Type, 2022 & 2030
Figure 93: Morocco Bio-Stimulants Market Y-o-Y Growth by Crop Type, 2022-2030
Figure 94: Morocco Bio-Stimulants Market Attractiveness Analysis by Crop Type,2022-2030
Figure 95: Morocco Bio-Stimulants Market Share and BPS Analysis by Application, 2022 & 2030
Figure 96: Morocco Bio-Stimulants Market Y-o-Y Growth by Application, 2022-2030
Figure 97: Morocco Bio-Stimulants Market Attractiveness Analysis by Application, 2022-2030
Figure 98: Tunisia Bio-Stimulants Market Share and BPS Analysis by Active Ingredient, 2022 & 2030
Figure 99: Tunisia Bio-Stimulants Market Y-o-Y Growth by Active Ingredient, 2022-2030
Figure 100: Tunisia Bio-Stimulants Market Attractiveness Analysis by Active Ingredient, 2022-2030
Figure 101: Tunisia Bio-Stimulants Market Share and BPS Analysis by Crop Type, 2022 & 2030
Figure 102: Tunisia Bio-Stimulants Market Y-o-Y Growth by Crop Type, 2022-2030
Figure 103: Tunisia Bio-Stimulants Market Attractiveness Analysis by Crop Type, 2022-2030
Figure 104: Tunisia Bio-Stimulants Market Share and BPS Analysis by Application, 2022 & 2030
Figure 105: Tunisia Bio-Stimulants Market Y-o-Y Growth by Application, 2022-2030
Figure 106: Tunisia Bio-Stimulants Market Attractiveness Analysis by Application, 2022-2030
Figure 107: Ghana Bio-Stimulants Market Share and BPS Analysis by Active Ingredient, 2022 & 2030
Figure 108: Ghana Bio-Stimulants Market Y-o-Y Growth by Active Ingredient, 2022-2030
Figure 109: Ghana Bio-Stimulants Market Attractiveness Analysis by Active Ingredient, 2022-2030
Figure 110: Ghana Bio-Stimulants Market Share and BPS Analysis by Crop Type, 2022 & 2030
Figure 111: Ghana Bio-Stimulants Market Y-o-Y Growth by Crop Type, 2022-2030
Figure 112: Ghana Bio-Stimulants Market Attractiveness Analysis by Crop Type,2022-2030
Figure 113: Ghana Bio-Stimulants Market Share and BPS Analysis by Application, 2022 & 2030
Figure 114: Ghana Bio-Stimulants Market Y-o-Y Growth by Application, 2022-2030
Figure 115: Ghana Bio-Stimulants Market Attractiveness Analysis by Application, 2022-2030
Figure 116: Nigeria Bio-Stimulants Market Share and BPS Analysis by Active Ingredient, 2022 & 2030
Figure 117: Nigeria Bio-Stimulants Market Y-o-Y Growth by Active Ingredient, 2022-2030
Figure 118: Nigeria Bio-Stimulants Market Attractiveness Analysis by Active Ingredient, 2022-2030
Figure 119: Nigeria Bio-Stimulants Market Share and BPS Analysis by Crop Type, 2022 & 2030
Figure 120: Nigeria Bio-Stimulants Market Y-o-Y Growth by Crop Type, 2022-2030
Figure 121: Nigeria Bio-Stimulants Market Attractiveness Analysis by Crop Type, 2022-2030
Figure 122: Nigeria Bio-Stimulants Market Share and BPS Analysis by Application, 2022 & 2030
Figure 123: Nigeria Bio-Stimulants Market Y-o-Y Growth by Application, 2022-2030
Figure 124: Nigeria Bio-Stimulants Market Attractiveness Analysis by Application, 2022-2030
Figure 125: Senegal Bio-Stimulants Market Share and BPS Analysis by Active Ingredient, 2022 & 2030
Figure 126: Senegal Bio-Stimulants Market Y-o-Y Growth by Active Ingredient, 2022-2030
Figure 127: Senegal Bio-Stimulants Market Attractiveness Analysis by Active Ingredient, 2022-2030
Figure 128: Senegal Bio-Stimulants Market Share and BPS Analysis by Crop Type, 2022 & 2030
Figure 129: Senegal Bio-Stimulants Market Y-o-Y Growth by Crop Type, 2022-2030
Figure 130: Senegal Bio-Stimulants Market Attractiveness Analysis by Crop Type, 2022-2030
Figure 131: Senegal Bio-Stimulants Market Share and BPS Analysis by Application, 2022 & 2030
Figure 132: Senegal Bio-Stimulants Market Y-o-Y Growth by Application, 2022-2030
Figure 133: Senegal Bio-Stimulants Market Attractiveness Analysis by Application, 2022-2030
Figure 134: South Africa Bio-Stimulants Market Share and BPS Analysis by Active Ingredient, 2022 & 2030
Figure 135: South Africa Bio-Stimulants Market Y-o-Y Growth by Active Ingredient, 2022-2030
Figure 136: South Africa Bio-Stimulants Market Attractiveness Analysis by Active Ingredient, 2022-2030
Figure 137: South Africa Bio-Stimulants Market Share and BPS Analysis by Crop Type, 2022 & 2030
Figure 138: South Africa Bio-Stimulants Market Y-o-Y Growth by Crop Type, 2022-2030
Figure 139: South Africa Bio-Stimulants Market Attractiveness Analysis by Crop Type, 2022-2030
Figure 140: South Africa Bio-Stimulants Market Share and BPS Analysis by Application, 2022 & 2030
Figure 141: South Africa Bio-Stimulants Market Y-o-Y Growth by Application, 2022-2030
Figure 142: South Africa Bio-Stimulants Market Attractiveness Analysis by Application, 2022-2030
Need specific information?
Request CustomizationExplore Chemicals & Materials Insights
View Reports