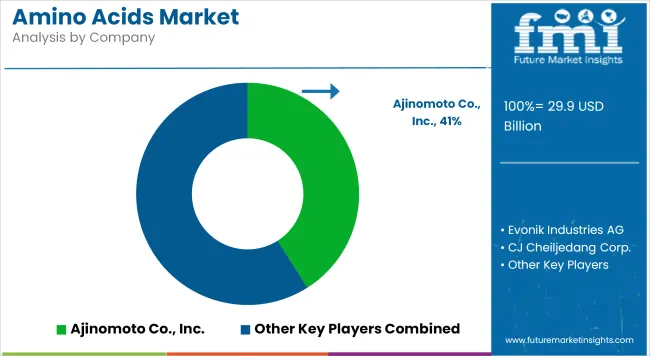
The global amino acids market is projected to expand from USD 29.9 billion in 2025 to USD 75.3 billion by 2035, registering a compound annual growth rate (CAGR) of 9.7% during the forecast period. This growth is being propelled by increasing consumption across food and beverage, pharmaceuticals, animal feed, and personal care sectors, where amino acids are essential for nutrition, metabolic health, and functional product formulations.
In the food and beverage industry, amino acids are witnessing rising demand due to heightened consumer awareness of protein intake, particularly in the context of sports nutrition and dietary supplements. The functional food sector is incorporating amino acids like leucine, isoleucine, and valine to support muscle recovery, metabolism, and endurance. This trend is aligning with broader lifestyle shifts toward health-focused diets and high-performance nutrition.
Animal feed applications continue to represent a substantial share of global amino acid consumption. Livestock sectors such as poultry, swine, and aquaculture are increasingly using essential amino acids like lysine, methionine, and threonine to improve growth performance, feed conversion ratios, and nutrient absorption in animals. As protein production intensifies to meet rising global demand, particularly in Asia and Latin America, feed-grade amino acids are gaining prominence for their role in optimizing feed formulations and reducing nitrogen emissions from livestock.
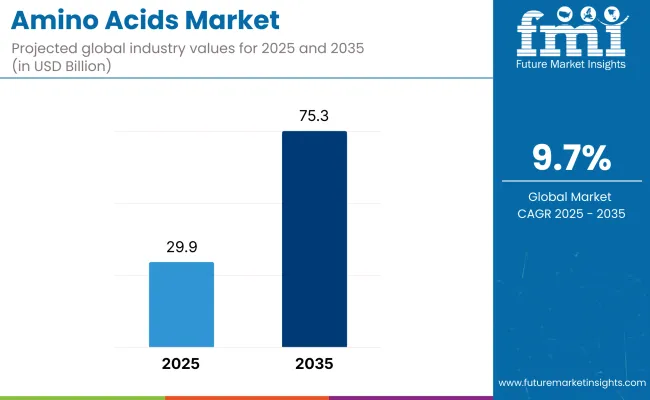
| Metric | Value |
|---|---|
| Industry Size (2025E) | USD 29.9 billion |
| Industry Value (2035F) | USD 75.3 billion |
| CAGR (2025 to 2035) | 8.7% |
Pharmaceutical usage of amino acids is growing as they are being integrated into treatments for metabolic disorders, intravenous nutrition therapies, and drug delivery systems. Amino acids are serving as critical components in the formulation of medical foods and specialized nutrition products. The demand for pharmaceutical-grade amino acids is being supported by the increasing prevalence of chronic illnesses and expanding healthcare access in emerging markets.
Technological progress in fermentation-based and enzymatic production methods is supporting the development of more sustainable and cost-efficient amino acid manufacturing. Innovations in microbial engineering, use of bio-based feedstocks, and closed-loop bioprocessing are helping manufacturers reduce their environmental footprint while scaling up production. However, volatility in raw material availability and regulatory scrutiny on synthetic variants may create operational and cost challenges.
Investments in biotechnology and bio-manufacturing are expected to enhance product quality, yield, and process efficiency. As plant-based and synthetic amino acid production continues to mature, the market is poised to benefit from diversification of supply chains and expansion into niche applications such as cosmeceuticals, diagnostics, and nutraceuticals. The growing versatility of amino acids across high-value end-use segments reinforces their strategic role in both health and industrial innovation.
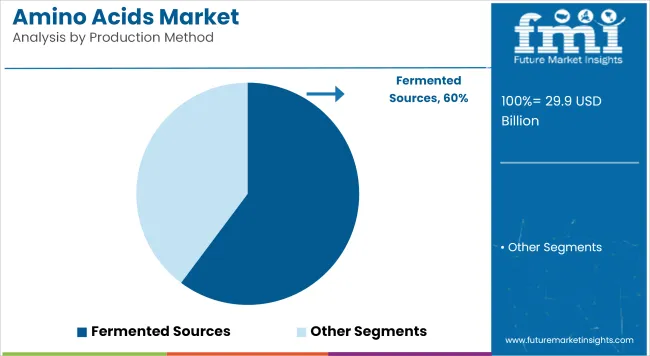
Fermented amino acids are estimated to account for approximately 60.2% of global market share in 2025, and CAGR of 9.4% during the study period. Microbial fermentation has become the primary method for producing amino acids like lysine, glutamic acid, and tryptophan, offering advantages in purity, consistency, and environmental compliance.
With growing demand for animal feed supplements, plant-based proteins, and clinical nutrition, fermentation processes are being increasingly optimized using advanced microbial strains and bioreactor technologies. The trend is further supported by global interest in sustainable production methods and avoidance of synthetic or chemically hydrolyzed alternatives.
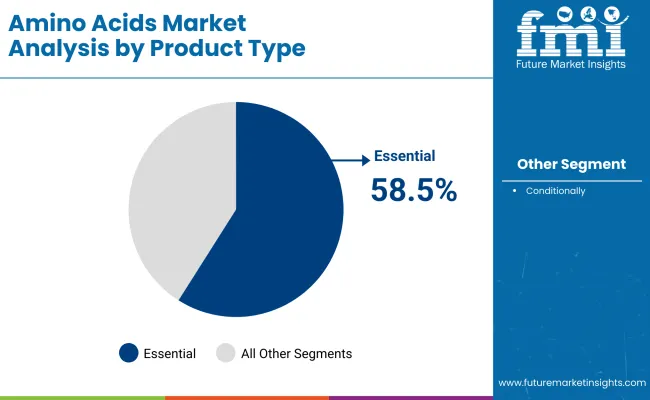
Essential amino acids are projected to hold approximately 58.5% of the global amino acid market share in 2025 and represent a CAGR of 9.1% over the forecast period. These amino acids cannot be synthesized by the human body and must be obtained from dietary sources, making them fundamental in nutritional supplements, fortified foods, and medical nutrition therapies.
In animal nutrition, essential amino acids such as lysine, methionine, and threonine are increasingly used to improve feed efficiency and growth performance. As consumer focus shifts toward wellness, active lifestyles, and personalized nutrition, essential amino acid formulations are witnessing higher demand in both human and veterinary applications.
Raw Material Price Volatility
The production of amino acids relies on key commodities like sugar, corn and soybean derivatives, which have experienced price shifts, supply chain disruptions and trade embargoes. Adverse weather conditions (such as floods or droughts), geopolitical tensions, and changes in agricultural policies may impact crop yield and raw material supply, which in turn, contributing to rising amino acid production costs.
The dependence on fermentation method of production, which needs large quantities of glucose or starch, is the principal reason for the threat to raw materials price variability the industry poses. Energy and transportation prices continue to rise and have a direct impact on market pricing as well. To combat these challenges, companies are looking at alternative feedstock’s, synthetic biology applications, and waste-to-value approaches all target agricultural by-products for amino acid production to decrease reliance on traditional raw materials.
Regulatory and Environmental Compliance
During the COVID-19 pandemic, the global amino acids market is expected to exhibit a positive growth of around 3.2% between 2019 and 2029. Health and governmental institutions like the FDA (USA), EFSA (Europe), and CFDA (China) demand very high standards for synthetic amino acids, including rules regarding labeling and legal limits in food supplements and pharmaceuticals. Furthermore, greenhouse gas emissions, waste, and water used for fermentation remain environmental threats which led to the new environmental regulations.
Obeying these laws requires a significant investment in purchasing waste treatment technologies, sustainable production processes and energy-efficient manufacturing. Not only must they comply with these regulations but they must also engage in environmentally sound practices such as utilizing biodegradable packaging and non-GMO fermentation methods in order to aid global sustainable development and compete in the marketplace.
Rising Demand for Plant-Based and Fermentation-Derived Amino Acids
The growing trend towards plant-base diet, vegan lifestyle, and non-chemical ingredients in the food formulations are providing new opportunities for the application of fermentation-derived amino acids. Moreover, consumers are increasingly tuned into non-GMO, allergen-free, and sustainable sources of protein, which has made plant-based lysine, methionine, and glutamine more popular than ever before.
With the goal of producing high-quality, bioavailable amino acids and shying away from animal-derived or chemical routes, organizations are allocating their resources toward innovations such as precision fermentation, enzymatic hydrolysis, and synthetic biology.
Progress on the use of amino acids can also be seen in the functional food and beverage sector, which embraces their use in protein-enriched snacks, dairy alternatives and sports nutrition supplements. More than ever, the trends in consumer demand for clean-label and minimally processed food products are soaring, and amino acid producers with natural and organic-certified products are leading the pack.
Expanding Applications in Pharmaceuticals and Biotechnology
Since then, the pharmaceutical and biotech industries have become increasingly incorporated amino acids in their drug formulations, metabolic therapies, and regenerative medicine. Advancements in gene editing, enzyme engineering, and precision medicine allowed for the development of amino acid-based therapies for neurodegenerative diseases, immune system modulation, and cellular regeneration.
Amino acids, being the building blocks of proteins, play critical roles in many biomolecules and biological processes, hence determining their metabolic pathway would be significant in physiological sciences especially in medical nutrition in the case of IV solutions, baby formulas, and dietary supplements required to treat metabolic disorders and malabsorption syndromes.
In addition, the activity of the biotech sector is also advanced through the use of amino acids in cell culture media, vaccine generation, and biomolecular synthesis to name the microscopic bits of health care innovations that have not been printed. Increasing personal enthusiasm for diets, therapeutic proteins, and bioengineered peptides will drive profits for suppliers of high-purity, pharmaceutical-grade amino acids.
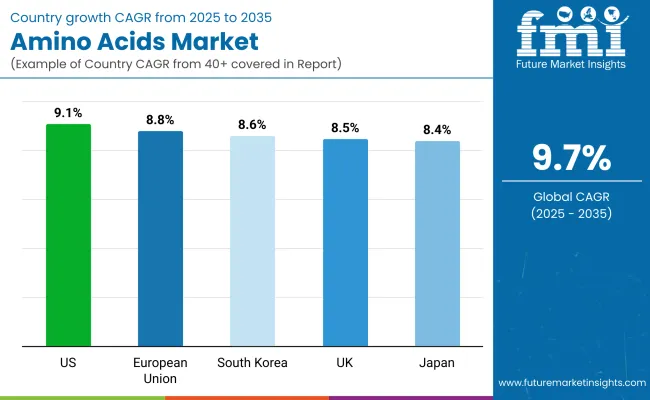
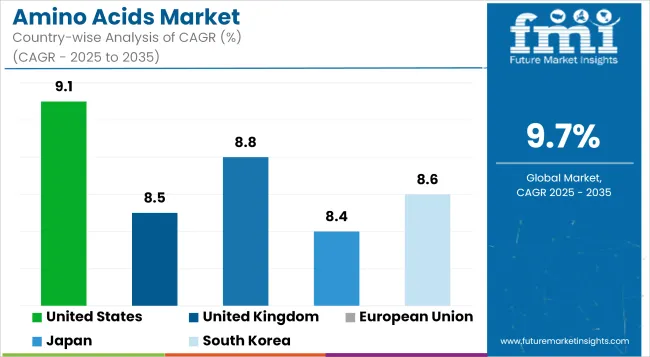
The United States amino acids market is flourishing rapidly, mainly due to the rising concern for nutrition, dietary supplements, and functional foods. Another factor helping to propel the growth of the amino acids pharmaceutical market is the increasing need of amino acids in pharmaceuticals, particularly in the treatment of metabolic disorders and in the promotion of muscle health.
Moreover, the present amino acid surplus due to the inclination of using only plant-based protein or exporting animal feeds fortified with amino acids or manufactured with only a plant protein base. Another important factor driving market growth is the increase in new improvements for amino corrosive extraction and aging handling. In addition, government initiatives are focusing on the beneficial aspects of healthful eating and sports nutrition contributing in line with expansion of the market.
| Country | CAGR (2025 to 2035) |
|---|---|
| United States | 9.1% |
The UK amino acids segment has experienced robust growth year on year driven by the growing number of consumers adopting plant-based diets and foods that serve a functional purpose. Amino acid demand in the pharmaceutical sector was not the only growth in the amino acid demand, sports nutrition on the other hand also witnessed an increase in demand.
Because of the government supporting healthy lifestyles and food production sustainability, the market is expected to rise even more. Furthermore, advancements in precision fermentation, as well as synthetic biology, are all contributing to the increasing production of amino acids. One of the significant factors driving the increased consumption of essential amino acids in the UK remains the development of the food processing and nutraceutical sector.
| Country | CAGR (2025 to 2035) |
|---|---|
| United Kingdom | 8.5% |
The momentum towards huge development of the European Union (EU) amino acids market is being pressed here by the development of interest for dietary supplements, sports nutrition and natural friendly food solutions among customers. Very nice food hygiene and nutrition plan in the space are good at the amino acids in functional food industry and medication applications have the role of assistance.
On top of that, fermentation technology and microbial synthesis innovation has optimized the production efficiency. Changing consumer perception regarding health and the increasing attention of food security and food quality issues in the light of increasingly adverse climatic conditions are compelling consumer preference for more alternative protein sources and is propelling the growth of the amino acid market.
| Region | CAGR (2025 to 2035) |
|---|---|
| European Union | 8.8% |
Japan's amino acid sector is on an upward trajectory mainly due to the booming pharmaceutical sector, progress in fundamental biotechnology research, and a growing trend in functional foods among consumers. demography of the elderly citizens and the focus on health and well-being is an internal component of the growth in the country. Moreover, we have been stepped it up the production ability of the amino acid fermentation technology which is superior to Japan and being utilized.
Moreover, the incorporation of amino acids in cosmetics, nutraceuticals, and high-performance animal feed is another factor endorsing readily market development. Continuous R&D investments along with good law on health-promoting items will make the amino acid market of Japan steady because of the increase.
| Country | CAGR (2025 to 2035) |
|---|---|
| Japan | 8.4% |
The South Korean amino acids market is booming, supported by its well-established food, pharmaceutical and animal feed industries. The major factors for amino acid production are the country's target towards the improvement of health and nutrition, and investments in biotechnology. The increasing prevalence of plant-based and functional foods in the region further drives the demand for essential amino acids in the country.
In addition, making advances in precision fermentation and microbial biotechnology is improving the production efficiency of South Korea. Another driver for the market growth is the support of the government for recent food technologies and sustainable diets solution.
| Country | CAGR (2025 to 2035) |
|---|---|
| South Korea | 8.6% |
The amino acid-based active ingredient market is evolving with companies prioritizing innovation to meet the demand for functional, clean-label products. Recent launches include amino acid formulations for personal care and nutrition, focusing on skin radiance and plant-based protein alternatives. Companies are investing in clinically proven ingredients that enhance hydration, skin tone, and barrier repair, while addressing the growing interest in plant-based, protein-rich beverages. These developments reflect a shift toward targeted, sustainable solutions that align with consumer preferences for wellness, clean beauty, and nutrition.
By Product Form
By Source
By Product Type
By Application
By Region
The global amino acids market is projected to reach USD 29,892.5 million by the end of 2025.
The market is anticipated to grow at a CAGR of 8.7% over the assessment period.
By 2035, the amino acids market is expected to reach USD 74,832.0 million.
The Food & Beverages segment is expected to lead due to the rising demand for protein-based and functional foods.
Major companies operating in the amino acids market include Ajinomoto Co., Inc., Evonik Industries AG, Cargill, Incorporated.


Full Research Suite comprises of:
Market outlook & trends analysis
Interviews & case studies
Strategic recommendations
Vendor profiles & capabilities analysis
5-year forecasts
8 regions and 60+ country-level data splits
Market segment data splits
12 months of continuous data updates
DELIVERED AS:
PDF EXCEL ONLINE
Amino Acids Premixes Market
Food Amino Acids Market Size, Growth, and Forecast for 2025 to 2035
Feed Amino Acids Market Analysis by Product, Application, and Region through 2035
Specialty Amino Acids Market Size and Share Forecast Outlook 2025 to 2035
Branched Chain Amino Acids Market Size and Share Forecast Outlook 2025 to 2035
Amino Resin Market Growth - Trends & Forecast 2025 to 2035
Amino Acid Metabolism Disorders Treatment Market Growth – Trends & Forecast 2024-2034
Acetaminophen API Market Report – Demand, Trends & Industry Forecast 2025–2035
Acetaminophen Market Analysis - Size, Share, and Forecast 2025 to 2035
Global Acetaminophen-Opioid Combination Market Analysis – Size, Share & Forecast 2024-2034
Chiral Amino Alcohols Market Size and Share Forecast Outlook 2025 to 2035
Serine Amino Acid Market - Size, Share, and Forecast Outlook 2025 to 2035
Liquid Amino Ingredients Market Analysis by Source,Type and Application Through 2035
Alanine Aminotransferase Reagent Market
(S)-(+)-2-Amino-1-Propanol Market Size and Share Forecast Outlook 2025 to 2035
Fermented Amino Acid Complex Market Size and Share Forecast Outlook 2025 to 2035
Theophylline And Aminophylline Market Size and Share Forecast Outlook 2025 to 2035
Antacids Market Analysis – Size, Trends & Forecast 2025 to 2035
Fatty Acids Market Size and Share Forecast Outlook 2025 to 2035
Threonine Acids Market Analysis by Food Dietary Supplements, Animal Feed, Pharmaceuticals, and Others Through 2035

Thank you!
You will receive an email from our Business Development Manager. Please be sure to check your SPAM/JUNK folder too.
Chat With
MaRIA