Food Amino Acids Market
Food Amino Acids Market by Type (Lysine, Glutamic Acid), Source (Plant-based, Animal-based), Distribution Channel (Direct, Indirect) & Region - Forecast 2022 - 2032
Market Insights on Food Amino Acids covering sales outlook, demand forecast & up-to-date key trends
Market Snapshot
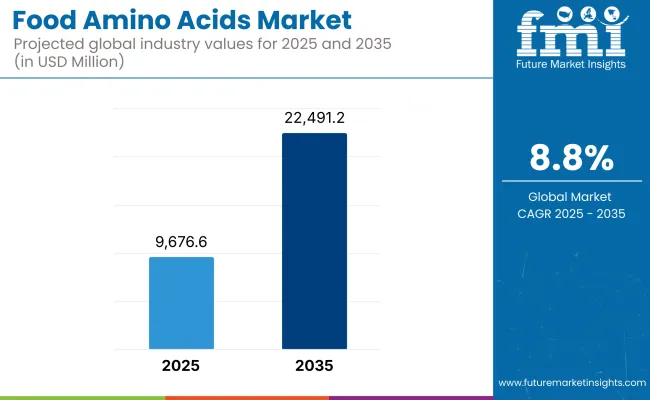
[350 Pages Report] The food amino acids market was is estimated to reach US$ 6.6 Bn in 2022. Expansion of the global amino acid supplements market size is anticipated to have a direct impact on sales of food amino acids, pushing demand at a robust 8.1% CAGR. Against this backdrop, the food amino acids market valuation will total approximately US$ 11.6 Bn in 2032.
Food Amino Acid Market Size Value in 2022 |
USD 6.6 Bn |
Food Amino Acid Market Forecast Value in 2032 |
USD 11.6 Bn |
Global Growth Rate (2022 to 2032) |
8.1% |
Forecast Period |
2022-2032 |
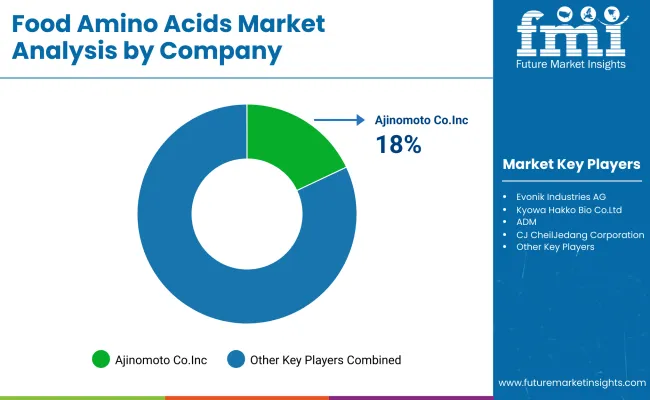
Ajinomoto Co. Inc., Kyowa Hakko Kirin Co., Ltd., Sigma-Aldrich, Co. LLC., Prinova Group LLC., and Daesang Corporation are identified as leading players operating in the food amino acids market.
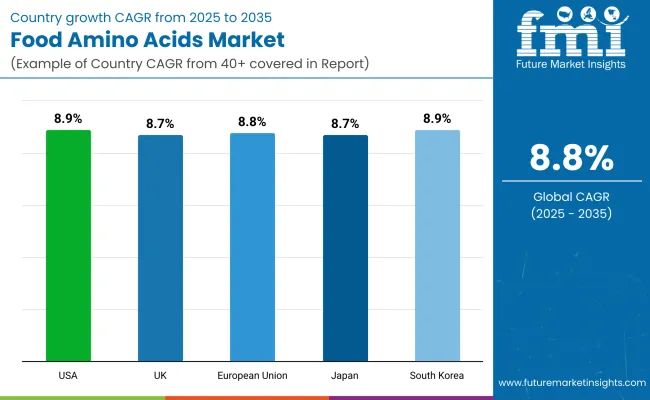
In 2021, sales in the U.S. food amino acids market grew by 7.6% year-on-year, and the trend is anticipated to continue over the forecast period, thereby augmenting the growth in the market.
Growing Health Awareness Amongst Athletes Will Fuel Sales of Food Amino Acids
Increasing awareness regarding balanced diets among the population is resulting in growing demand for dietary supplements. Amino acid supplements help recover faster from tiredness, boost endurance and mental focus, and reduce muscle pain. They are also beneficial in the treatment of metabolic disorders.
Athletes take energy drinks, low-carbohydrate foods, nutrition bars, and supplements on a regular basis to improve their performance. Citing this trend, brands are introducing food and beverage products that contain high levels of amino acids.
Besides this, manufacturers are focusing on expanding their amino acid production facilities in order to meet the growing demand for amino acid supplements. Rising demand in the amino acid dietary supplements market will fuel sales of food amino acids over the assessment period.
Let us know your requirement to get
100% FREE customization
Growing Focus on Highly Functional Diets is Influence Demand for Food Amino Acids
Shifting consumer preference towards functional foods and growing expenditure on clean label food and beverage products is expected to drive sales in the food grad amino acids market. This is expected to spur demand for food amino acids across industries such as pharmaceuticals, sports nutrition and food & beverage across the globe.
Customer are seeking healthy food and beverage products that comprise a substantial amount of calcium, vitamins, and mineral. This is resulting in high adoption of amino acids as additives to boost metabolism and health. Food amino acids are also being incorporated in cattle hormone production, which is anticipated to drive the market in the forthcoming years.
Surging Demand for Plant-based Products Will Create Opportunities for Growth
Plant-based raw materials are the primary source of amino acids, which is resulting in growing preference for bio-based products among consumers. In response to this, plant-based food amino acids derived from soybean, corn, and wheat are being incorporated in infant formula, food and beverage products and nutraceuticals.
Further, amid rising demand for meat products derived from livestock, poultry, and aquatic animals, the global animal feed market is projected to surpass US$ 300 Bn by 2032, which is anticipated to augment growth in the global food amino acids market.
Growing need for protein-rich food sources is fueling meat intake among consumers in various countries. Amino acids are added to animal diets because they improve milk performance regardless of production level, increase dairy herd fertility, and reduce the prevalence of metabolic diseases.
Find your sweet spots for generating winning opportunities in this market.
Talk to AnalystPotential Barriers Hampering the Expansion
Price fluctuations, variations in production levels, and changes in tariff policies are identified as roadblocks in the global food amino acids market.
Manufacturers are expected to face a supply scarcity of raw materials, which will impact sales of food amino acids market. Rising corn, soybean, and wheat prices are likely to have an influence on market profitability. However, the introduction of microfiltration technology to boost yield is anticipated to create opportunities for growth.
Further, consumers' misconceptions regarding allergies caused by amino acids such as fatigue, migraines, and tachycardia, may restrict growth in the global food amino acids market.
Country-Wise Analysis
Why is the U.S. Food Amino Acids Market Considered Lucrative?
“Growing Adoption of Food Amino Acids in Sport Nutrition Will Fuel Growth”
As per FMI, the U.S. is anticipated to dominate the North America food amino acids market over the forecast period. Growing consumption of processed and convenient meals, along with surging demand for clean label food products in the country will augment sales in the market. In addition to this, rising awareness protein-rich and low-sugar foods will drive sales over the assessment period.
What Will be the Demand Outlook in the U.K. Food Amino Acids Market?
“Surging Demand for Tryptophan Foods in the U.K. Will Propel Sales”
During the forecast period, sales in the U.K. food amino acid market are expected to rise at a CAGR of 5.6%. Food amino acids are being incorporated in the meat industry owing to increasing demand for animal-derived goods, which is expected to boost sales in the country over the assessment period.
What is Driving the China Food Amino Acids Market?
“Growing Consumption of Processed Foods in China will Spur Demand for Food Amino Acids”
China is anticipated to account for a lion’s share in the East Asia food amino acids market over the assessment period. Growth can be attributed to increasing adoption of amino acids in processed and ready-to-eat meals, along with growing demand for functional and clean-label food products in the country.

An unified Market Research Subscription Platform, built for today’s disparate research needs.
Category wise analysis
Why are Applications in the Nutraceuticals and Dietary Supplements Rising?
“Increasing Adoption of Food Amino Acids in Nutraceuticals and Dietary Supplements Will Boost Growth”
In terms of applications, sales in the nutraceuticals and dietary supplements segment grew at a 5.9% CAGR in 2021, and the trend is anticipated to continue over the forecast period. Growing adoption of nutraceuticals and dietary supplements among athletes and the geriatric population will boost sales in this segment in the forthcoming years.
Which is the Most Preferred Product Type?
“Rising Demand for Glutamine Foods Will Drive the Adoption of Food Amino Acids”
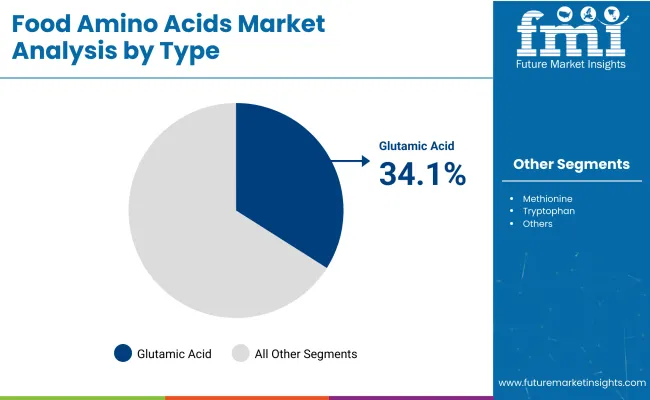
Based on type, demand in the glutamic acid segment is projected to surge at a 6.6% CAGR through 2032. Increasing incorporation of food amino acids as taste enhancers in a variety of foods products such as snacks, dressings and soups will fuel sales in this segment in the forthcoming years.
Impact of Covid-19 on the Market
The pandemic had a considerable impact on the food and beverage industry globally due to raw material shortages, infected workforce at industrial levels, demand-supply volatility, trade and logistics, and uncertain consumer demand for food items.
The economic downturn that followed the pandemic could cause a delay in the commercialization of food amino acids. Small and medium-sized businesses, which are the backbone of the technological industry, have seen a sharp reduction in income since the epidemic began in 2020. As a result, market participants faced several hurdles as supply chain interruptions were noticed.
Scope Of Report
FMI’s latest market analysis on the global food amino acids divulges into trends prevailing in the market that are influencing sales of food amino acids. Factors such as demand, supply, product procurement, production, and sales of food amino acids across applications segment including nutraceuticals and dietary supplements, infant food and food fortification are discussed at large.
The report offers a comprehensive analysis of demand trends regarding food amino acids across various geographies to help readers identify lucrative investment pockets. Amid surging adoption of food amino acids in sports nutrition, North America is anticipated to emerge as the frontrunner in the global food amino acids market. Key trends boosting sales in countries such as the U.S. and Canada are scrutinized in the report.
Amid growing consumption of fortified foods in the Asia Pacific, countries such as China, South Korea, Japan, and India will offer remunerative opportunities for growth. How will increasing consumer preference for functional packaged food will impact sales of food amino acids in Asia Pacific is studied in detail.
The study highlights which food amino acids product type will remain under the spotlight among consumers across various countries, offering an in-depth analysis of consumer preferences, technological advancements and promotional strategies adopted by key market players.
Growing inclination towards clean-label and plant-based products is steering growth in the global food amino acids market. How growth will unfold amid this scenario, with deep emphasis on product launches, mergers, acquisitions, and technological innovations are covered comprehensively for the forecast period 2022-2032.
The food amino acids market study includes:
- A 10-year in-depth sales and demand forecast for food amino acids across 4 major application segments.
- Detailed analysis of production, supply chain, raw material procurement and demand trends prevailing across 25 countries, highlighting potential investment pockets.
- Illustrative graphical representation of food amino acids applications across various segments, offering an insightful timeline of sales of food amino acids in the food and beverage sector.
- Consumer preferences, demand trends and advancements in terms of production that may influence sales of food amino acids.
- How vendors are incorporating different variants of food amino acids in convenience foods and sports nutrition products and its impact on the overall growth in the market.
Attribute |
Details |
Food Amino Acid Market Size Value in 2022 |
US$ 6.6 Bn |
Food Amino Acid Market Forecast Value in 2032 |
US$ 11.6 Bn |
Global Growth Rate (2022 to 2032) |
8.1% |
Forecast Period |
2022-2032 |
Historical Data Available for |
2017-2021 |
Market Analysis |
US$ Mn for Value & MT for Volume |
Report Coverage |
Market Forecast, Company Share Analysis, Competition Intelligence, DROT Analysis, Market Dynamics and Challenges, and Strategic Growth Initiatives |
Key Regions Covered |
|
Key Segments Covered |
Type, Source, Application, and Distribution Channel |
Applications |
Nutraceuticals and dietary supplements, infant formula, food fortification, convenience foods and others |
Key Companies Profiled |
Ajinomoto Co. Inc., Kyowa Hakko Kirin Co. Ltd., Sigma-Aldrich, Co. LLC., Prinova Group LLC., Daesang Corporation, Others |
Pricing |
Available upon Request |
Segmentation
By Type:
- Lysine
- Glutamic Acid
- Methionine
- Tryptophan
- Others
By Source:
- Plant-based
- Animal-based
- Synthetic
By Application:
- Nutraceuticals & dietary supplements
- Infant formula
- Food fortification
- Convenience food
- Others
By Distribution Channel:
- Direct
- Indirect
- Pharmacy Stores
- E-retailers
- Specialty stores
- Supermarkets
Frequently Asked Questions
Currently food amino acids market is worth more than USD 6.6 Bn.
Food amino acids consumption is expected to grow at a CAGR of around 8.1% during the period 2022-2032.
In terms of revenue, the food amino acids market grew at a CAGR of around 7.7% during 2017-2022.
The global food amino acids market was forecasted to surpass USD 11.6 Bn by the end of 2032.
Ajinomoto Co. Inc., Kyowa Hakko Kirin Co. Ltd., Sigma-Aldrich, Co. LLC., Prinova Group LLC., Daesang Corporation are expected to be the top players driving the market growth.
Market players are focusing on new product launches, strong distribution channels, and merger-acquisition strategies to remain a prominent player in the global market.
United States, Canada, China, the U.K, India are the major countries driving demand for functional proteins.
Europe holds around 33% of the total food amino acids revenue share.
The U.S. food amino acids market is projected to grow at a CAGR of around 7.6% over the next ten years.
The report presents a detailed cost analysis of food amino acids based on application i.e., •Nutraceuticals & dietary supplements, infant formula, food fortification, convenience food, and others.
1. Market Overview
1.1. Market Coverage / Taxonomy
1.2. Market Definition / Scope / Limitations
2. The Massive Impact of the Crisis
2.1. Global Food Amino Acids Market Forecast Scenario Comparison of Annual Growth Rates for short Term (2021-2025) and Long Term (2026-2031)
2.1.1. Optimistic Scenario
2.1.1.1. China
2.1.1.2. US
2.1.1.3. India
2.1.1.4. Euro Zone
2.1.1.5. Asia Pacific
2.1.1.6. Rest of the World
2.1.2. Likely Scenario
2.1.2.1. China
2.1.2.2. US
2.1.2.3. India
2.1.2.4. Euro Zone
2.1.2.5. Asia Pacific
2.1.2.6. Rest of the World
2.1.3. Pessimistic Scenario
2.1.3.1. China
2.1.3.2. US
2.1.3.3. India
2.1.3.4. Euro Zone
2.1.3.5. Asia Pacific
2.1.3.6. Rest of the World
2.2. Key Factors Impacting the Market
2.3. Note: Market Assessment shall be Provided for Likely Scenario
3. Market Dynamics
3.1. Drivers
3.1.1. Supply Side Drivers
3.1.2. Demand Side drivers
3.1.3. Economic Side Drivers
3.2. Restraints
3.3. Opportunity
3.4. Market trends By Region
3.5. Product Launches
3.6. Product Claims & Nutritional Information Scan by Buyers
3.7. Macro-Economic Factors
3.8. Forecast Factors - Relevance & Impact
3.9. Consumers Survey Analysis
4. Key Regulations
4.1. Packaging & Labelling Regulations
4.2. Certifications and Certifying Agency Overview
4.3. Import/Export Policies
5. Global Food Amino Acids Market Demand Analysis 2016-2020 and Forecast, 2021-2031
5.1. Historical Market Volume (Metric Tons) Analysis, 2016-2020
5.2. Current and Future Market Volume (Metric Tons) Projections, 2021-2031
5.3. Y-o-Y Growth Trend Analysis
6. Global Food Amino Acids Market - Pricing Analysis
6.1. Regional Pricing Analysis (US$/Metric Tons) By Source (2016,2021,2031)
6.1.1. Plant Based
6.1.2. Animal-Based
6.2. Pricing Break-up (2016,2021,2031)
6.2.1. Producer Level Pricing
6.2.2. Distributor Level Pricing
6.2.3. Retailer Level Pricing
6.3. Global Average Pricing Analysis Benchmark
7. Global Food Amino Acids Market Demand (Size in US$ Mn) Analysis 2016-2020 and Forecast, 2021-2031
7.1. Historical Market Value (US$ Mn) Analysis, 2016-2020
7.2. Current and Future Market Value (US$ Mn) Projections, 2021-2031
7.2.1. Y-o-Y Growth Trend Analysis
7.2.2. Absolute $ Opportunity Analysis
8. Global Food Amino Acids Market Analysis 2016-2020 and Forecast 2021-2031, By Type
8.1. Introduction / Key Findings
8.2. Historical Market Size (US$ Mn) and Volume Analysis By Type, 2016 - 2020
8.3. Current and Future Market Size (US$ Mn) and Volume Analysis and Forecast By Type, 2021-2031
8.3.1. Lysine
8.3.2. Glutamic Acid
8.3.3. Methionine
8.3.4. Tryptophan
8.3.5. Others
8.4. Market Attractiveness Analysis By Type
9. Global Food Amino Acids Market Analysis 2016-2020 and Forecast 2021-2031, By Source
9.1. Introduction / Key Findings
9.2. Historical Market Size (US$ Mn) and Volume Analysis By Source, 2016 - 2020
9.3. Current and Future Market Size (US$ Mn) and Volume Analysis and Forecast By Source, 2021-2031
9.3.1. Plant Based
9.3.2. Animal-Based
9.4. Market Attractiveness Analysis By Source
10. Global Food Amino Acids Market Analysis 2016-2020 and Forecast 2021-2031, By Application
10.1. Introduction / Key Findings
10.2. Historical Market Size (US$ Mn) and Volume Analysis By Application, 2016 - 2020
10.3. Current and Future Market Size (US$ Mn) and Volume Analysis and Forecast By Application, 2021-2031
10.3.1. Food & Dietary Supplements
10.3.2. Pharmaceuticals
10.3.3. Animal Feed
10.4. Market Attractiveness Analysis By Application
11. Global Food Amino Acids Market Analysis 2016-2020 and Forecast 2021-2031, By Region
11.1. Introduction
11.2. Historical Market Size (US$ Mn) and Volume Analysis By Region, 2016 - 2020
11.3. Current Market Size (US$ Mn) and Volume Analysis and Forecast By Region, 2021-2031
11.3.1. North America
11.3.2. Latin America
11.3.3. Europe
11.3.4. East Asia
11.3.5. South Asia
11.3.6. Oceania
11.3.7. Middle East and Africa (MEA)
11.4. Market Attractiveness Analysis By Region
12. North America Food Amino Acids Market Analysis 2016-2020 and Forecast 2021-2031
12.1. Introduction
12.2. Pricing Analysis
12.3. Historical Market Size (US$ Mn) and Volume Trend Analysis By Market Taxonomy, 2016 - 2020
12.4. Market Size (US$ Mn) and Volume Forecast By Market Taxonomy, 2021 - 2031
12.4.1. By Country
12.4.1.1. U.S.
12.4.1.2. Canada
12.4.2. By Type
12.4.3. By Source
12.4.4. By Application
12.5. Market Attractiveness Analysis
12.5.1. By Type
12.5.2. By Source
12.5.3. By Application
12.6. Market Trends
12.7. Key Market Participants - Intensity Mapping
12.8. Drivers and Restraints - Impact Analysis
13. Latin America Food Amino Acids Market Analysis 2016-2020 and Forecast 2021-2031
13.1. Introduction
13.2. Pricing Analysis
13.3. Historical Market Size (US$ Mn) and Volume Trend Analysis By Market Taxonomy, 2016 - 2020
13.4. Market Size (US$ Mn) and Volume Forecast By Market Taxonomy, 2021 - 2031
13.4.1. By Country
13.4.1.1. Brazil
13.4.1.2. Mexico
13.4.1.3. Argentina
13.4.1.4. Chile
13.4.1.5. Peru
13.4.1.6. Rest of Latin America
13.4.2. By Type
13.4.3. By Source
13.4.4. By Application
13.5. Market Attractiveness Analysis
13.5.1. By Type
13.5.2. By Source
13.5.3. By Application
13.6. Market Trends
13.7. Key Market Participants - Intensity Mapping
13.8. Drivers and Restraints - Impact Analysis
14. Europe Food Amino Acids Market Analysis 2016-2020 and Forecast 2021-2031
14.1. Introduction
14.2. Pricing Analysis
14.3. Historical Market Size (US$ Mn) and Volume Trend Analysis By Market Taxonomy, 2016 - 2020
14.4. Market Size (US$ Mn) and Volume Forecast By Market Taxonomy, 2021 - 2031
14.4.1. By Country
14.4.1.1. Germany
14.4.1.2. Italy
14.4.1.3. France
14.4.1.4. U.K.
14.4.1.5. Spain
14.4.1.6. BENELUX
14.4.1.7. Nordic
14.4.1.8. Russia
14.4.1.9. Poland
14.4.1.10. Rest of Europe
14.4.2. By Type
14.4.3. By Source
14.4.4. By Application
14.5. Market Attractiveness Analysis
14.5.1. By Type
14.5.2. By Source
14.5.3. By Application
14.6. Market Trends
14.7. Key Market Participants - Intensity Mapping
14.8. Drivers and Restraints - Impact Analysis
15. East Asia Food Amino Acids Market Analysis 2016-2020 and Forecast 2021-2031
15.1. Introduction
15.2. Pricing Analysis
15.3. Historical Market Size (US$ Mn) and Volume Trend Analysis By Market Taxonomy, 2016 - 2020
15.4. Market Size (US$ Mn) and Volume Forecast By Market Taxonomy, 2021 - 2031
15.4.1. By Country
15.4.1.1. China
15.4.1.2. Japan
15.4.1.3. South Korea
15.4.2. By Type
15.4.3. By Source
15.4.4. By Application
15.5. Market Attractiveness Analysis
15.5.1. By Type
15.5.2. By Source
15.5.3. By Application
15.6. Market Trends
15.7. Key Market Participants - Intensity Mapping
15.8. Drivers and Restraints - Impact Analysis
16. South Asia Food Amino Acids Market Analysis 2016-2020 and Forecast 2021-2031
16.1. Introduction
16.2. Pricing Analysis
16.3. Historical Market Size (US$ Mn) and Volume Trend Analysis By Market Taxonomy, 2016 - 2020
16.4. Market Size (US$ Mn) and Volume Forecast By Market Taxonomy, 2021 - 2031
16.4.1. By Country
16.4.1.1. India
16.4.1.2. Thailand
16.4.1.3. Indonesia
16.4.1.4. Malaysia
16.4.1.5. Singapore
16.4.1.6. Rest of South Asia
16.4.2. By Type
16.4.3. By Source
16.4.4. By Application
16.5. Market Attractiveness Analysis
16.5.1. By Type
16.5.2. By Source
16.5.3. By Application
16.6. Market Trends
16.7. Key Market Participants - Intensity Mapping
16.8. Drivers and Restraints - Impact Analysis
17. Oceania Food Amino Acids Market Analysis 2016-2020 and Forecast 2021-2031
17.1. Introduction
17.2. Pricing Analysis
17.3. Historical Market Size (US$ Mn) and Volume Trend Analysis By Market Taxonomy, 2016 - 2020
17.4. Market Size (US$ Mn) and Volume Forecast By Market Taxonomy, 2021 - 2031
17.4.1. By Country
17.4.1.1. Australia
17.4.1.2. New Zealand
17.4.2. By Type
17.4.3. By Source
17.4.4. By Application
17.5. Market Attractiveness Analysis
17.5.1. By Type
17.5.2. By Source
17.5.3. By Application
17.6. Market Trends
17.7. Key Market Participants - Intensity Mapping
17.8. Drivers and Restraints - Impact Analysis
18. Middle East and Africa Food Amino Acids Market Analysis 2016-2020 and Forecast 2021-2031
18.1. Introduction
18.2. Pricing Analysis
18.3. Historical Market Size (US$ Mn) and Volume Trend Analysis By Market Taxonomy, 2016 - 2020
18.4. Market Size (US$ Mn) and Volume Forecast By Market Taxonomy, 2021 - 2031
18.4.1. By Country
18.4.1.1. GCC Countries
18.4.1.2. North Africa
18.4.1.3. South Africa
18.4.1.4. Centra Africa
18.4.2. By Type
18.4.3. By Source
18.4.4. By Application
18.5. Market Attractiveness Analysis
18.5.1. By Type
18.5.2. By Source
18.5.3. By Application
18.6. Market Trends
18.7. Key Market Participants - Intensity Mapping
18.8. Drivers and Restraints - Impact Analysis
19. Key Countries Bulk Ingredients Market Analysis 2016–2020 and Forecast 2021–2031
19.1. U.S.
19.1.1. Pricing Analysis (2016, 2021, 2031)
19.1.2. Market Value and Volume Analysis 2016–2020 and Forecast 2021–2031
19.1.2.1. By Type
19.1.2.2. By Source
19.1.2.3. By Application
19.2. Canada
19.2.1. Pricing Analysis (2016, 2021, 2031)
19.2.2. Market Value and Volume Analysis 2016–2020 and Forecast 2021–2031
19.2.2.1. By Type
19.2.2.2. By Source
19.2.2.3. By Application
19.3. Brazil
19.3.1. Pricing Analysis (2016, 2021, 2031)
19.3.2. Market Value and Volume Analysis 2016–2020 and Forecast 2021–2031
19.3.2.1. By Type
19.3.2.2. By Source
19.3.2.3. By Application
19.4. Mexico
19.4.1. Pricing Analysis (2016, 2021, 2031)
19.4.2. Market Value and Volume Analysis 2016–2020 and Forecast 2021–2031
19.4.2.1. By Type
19.4.2.2. By Source
19.4.2.3. By Application
19.5. Argentina
19.5.1. Pricing Analysis (2016, 2021, 2031)
19.5.2. Market Value and Volume Analysis 2016–2020 and Forecast 2021–2031
19.5.2.1. By Type
19.5.2.2. By Source
19.5.2.3. By Application
19.6. Peru
19.6.1. Pricing Analysis (2016, 2021, 2031)
19.6.2. Market Value and Volume Analysis 2016–2020 and Forecast 2021–2031
19.6.2.1. By Type
19.6.2.2. By Source
19.6.2.3. By Application
19.7. Chile
19.7.1. Pricing Analysis (2016, 2021, 2031)
19.7.2. Market Value and Volume Analysis 2016–2020 and Forecast 2021–2031
19.7.2.1. By Type
19.7.2.2. By Source
19.7.2.3. By Application
19.8. Germany
19.8.1. Pricing Analysis (2016, 2021, 2031)
19.8.2. Market Value and Volume Analysis 2016–2020 and Forecast 2021–2031
19.8.2.1. By Type
19.8.2.2. By Source
19.8.2.3. By Application
19.9. Italy
19.9.1. Pricing Analysis (2016, 2021, 2031)
19.9.2. Market Value and Volume Analysis 2016–2020 and Forecast 2021–2031
19.9.2.1. By Type
19.9.2.2. By Source
19.9.2.3. By Application
19.10. France
19.10.1. Pricing Analysis (2016, 2021, 2031)
19.10.2. Market Value and Volume Analysis 2016–2020 and Forecast 2021–2031
19.10.2.1. By Type
19.10.2.2. By Source
19.10.2.3. By Application
19.11. U.K.
19.11.1. Pricing Analysis (2016, 2021, 2031)
19.11.2. Market Value and Volume Analysis 2016–2020 and Forecast 2021–2031
19.11.2.1. By Type
19.11.2.2. By Source
19.11.2.3. By Application
19.12. Spain
19.12.1. Pricing Analysis (2016, 2021, 2031)
19.12.2. Market Value and Volume Analysis 2016–2020 and Forecast 2021–2031
19.12.2.1. By Type
19.12.2.2. By Source
19.12.2.3. By Application
19.13. Benelux
19.13.1. Pricing Analysis (2016, 2021, 2031)
19.13.2. Market Value and Volume Analysis 2016–2020 and Forecast 2021–2031
19.13.2.1. By Type
19.13.2.2. By Source
19.13.2.3. By Application
19.14. Russia
19.14.1. Pricing Analysis (2016, 2021, 2031)
19.14.2. Market Value and Volume Analysis 2016–2020 and Forecast 2021–2031
19.14.2.1. By Type
19.14.2.2. By Source
19.14.2.3. By Application
19.15. India
19.15.1. Pricing Analysis (2016, 2021, 2031)
19.15.2. Market Value and Volume Analysis 2016–2020 and Forecast 2021–2031
19.15.2.1. By Type
19.15.2.2. By Source
19.15.2.3. By Application
19.16. Thailand
19.16.1. Pricing Analysis (2016, 2021, 2031)
19.16.2. Market Value and Volume Analysis 2016–2020 and Forecast 2021–2031
19.16.2.1. By Type
19.16.2.2. By Source
19.16.2.3. By Application
19.17. Indonesia
19.17.1. Pricing Analysis (2016, 2021, 2031)
19.17.2. Market Value and Volume Analysis 2016–2020 and Forecast 2021–2031
19.17.2.1. By Type
19.17.2.2. By Source
19.17.2.3. By Application
19.18. Malaysia
19.18.1. Pricing Analysis (2016, 2021, 2031)
19.18.2. Market Value and Volume Analysis 2016–2020 and Forecast 2021–2031
19.18.2.1. By Type
19.18.2.2. By Source
19.18.2.3. By Application
19.19. China
19.19.1. Pricing Analysis (2016, 2021, 2031)
19.19.2. Market Value and Volume Analysis 2016–2020 and Forecast 2021–2031
19.19.2.1. By Type
19.19.2.2. By Source
19.19.2.3. By Application
19.20. Japan
19.20.1. Pricing Analysis (2016, 2021, 2031)
19.20.2. Market Value and Volume Analysis 2016–2020 and Forecast 2021–2031
19.20.2.1. By Type
19.20.2.2. By Source
19.20.2.3. By Application
19.21. South Korea
19.21.1. Pricing Analysis (2016, 2021, 2031)
19.21.2. Market Value and Volume Analysis 2016–2020 and Forecast 2021–2031
19.21.2.1. By Type
19.21.2.2. By Source
19.21.2.3. By Application
19.22. Australia
19.22.1. Pricing Analysis (2016, 2021, 2031)
19.22.2. Market Value and Volume Analysis 2016–2020 and Forecast 2021–2031
19.22.2.1. By Type
19.22.2.2. By Source
19.22.2.3. By Application
19.23. New Zealand
19.23.1. Pricing Analysis (2016, 2021, 2031)
19.23.2. Market Value and Volume Analysis 2016–2020 and Forecast 2021–2031
19.23.2.1. By Type
19.23.2.2. By Source
19.23.2.3. By Application
19.24. GCC Countries
19.24.1. Pricing Analysis (2016, 2021, 2031)
19.24.2. Market Value and Volume Analysis 2016–2020 and Forecast 2021–2031
19.24.2.1. By Type
19.24.2.2. By Source
19.24.2.3. By Application
19.25. Central Africa
19.25.1. Pricing Analysis (2016, 2021, 2031)
19.25.2. Market Value and Volume Analysis 2016–2020 and Forecast 2021–2031
19.25.2.1. By Type
19.25.2.2. By Source
19.25.2.3. By Application
19.26. Northern Africa
19.26.1. Pricing Analysis (2016, 2021, 2031)
19.26.2. Market Value and Volume Analysis 2016–2020 and Forecast 2021–2031
19.26.2.1. By Type
19.26.2.2. By Source
19.26.2.3. By Application
19.27. South Africa
19.27.1. Pricing Analysis (2016, 2021, 2031)
19.27.2. Market Value and Volume Analysis 2016–2020 and Forecast 2021–2031
19.27.2.1. By Type
19.27.2.2. By Source
19.27.2.3. By Application
20. Market Structure Analysis
20.1. Market Analysis by Tier of Companies
20.2. Company Share Analysis of Top Players
20.2.1. By Source
20.2.2. By Region
20.3. Market Presence Analysis
20.3.1. By Regional Footprint of Players
20.3.2. Product Footprint by Players
20.3.3. Channel Footprint by Players
21. Competition Analysis
21.1. Competition Dashboard
21.2. Competition Deep Dive (Tentative List)
21.2.1. Novus International
21.2.1.1. Overview
21.2.1.2. Product Portfolio
21.2.1.3. Profitability by Market Segments (Product/Channel/Region)
21.2.1.4. Sales Footprint
21.2.1.5. Strategy Overview
21.2.1.5.1. Marketing Strategy
21.2.1.5.2. Product Strategy
21.2.2. Prinova Group LLC
21.2.2.1. Overview
21.2.2.2. Product Portfolio
21.2.2.3. Profitability by Market Segments (Product/Channel/Region)
21.2.2.4. Sales Footprint
21.2.2.5. Strategy Overview
21.2.2.5.1. Marketing Strategy
21.2.2.5.2. Product Strategy
21.2.3. Royal DSM
21.2.3.1. Overview
21.2.3.2. Product Portfolio
21.2.3.3. Profitability by Market Segments (Product/Channel/Region)
21.2.3.4. Sales Footprint
21.2.3.5. Strategy Overview
21.2.3.5.1. Marketing Strategy
21.2.3.5.2. Product Strategy
21.2.4. Ajinomoto Co., Inc.
21.2.4.1. Overview
21.2.4.2. Product Portfolio
21.2.4.3. Profitability by Market Segments (Product/Channel/Region)
21.2.4.4. Sales Footprint
21.2.4.5. Strategy Overview
21.2.4.5.1. Marketing Strategy
21.2.4.5.2. Product Strategy
21.2.5. Kemin Industries
21.2.5.1. Overview
21.2.5.2. Product Portfolio
21.2.5.3. Profitability by Market Segments (Product/Channel/Region)
21.2.5.4. Sales Footprint
21.2.5.5. Strategy Overview
21.2.5.5.1. Marketing Strategy
21.2.5.5.2. Product Strategy
21.2.6. Slgma-Aldrich, Co. Ltd.
21.2.6.1. Overview
21.2.6.2. Product Portfolio
21.2.6.3. Profitability by Market Segments (Product/Channel/Region)
21.2.6.4. Sales Footprint
21.2.6.5. Strategy Overview
21.2.6.5.1. Marketing Strategy
21.2.6.5.2. Product Strategy
21.2.7. Kyowa Hakko klrln Co., Ltd.
21.2.7.1. Overview
21.2.7.2. Product Portfolio
21.2.7.3. Profitability by Market Segments (Product/Channel/Region)
21.2.7.4. Sales Footprint
21.2.7.5. Strategy Overview
21.2.7.5.1. Marketing Strategy
21.2.7.5.2. Product Strategy
21.2.8. Daesang Corporation
21.2.8.1. Overview
21.2.8.2. Product Portfolio
21.2.8.3. Profitability by Market Segments (Product/Channel/Region)
21.2.8.4. Sales Footprint
21.2.8.5. Strategy Overview
21.2.8.5.1. Marketing Strategy
21.2.8.5.2. Product Strategy
21.2.9. Other Players (On Additional Requests)
21.2.9.1. Overview
21.2.9.2. Product Portfolio
21.2.9.3. Profitability by Market Segments (Product/Channel/Region)
21.2.9.4. Sales Footprint
21.2.9.5. Strategy Overview
21.2.9.5.1. Marketing Strategy
21.2.9.5.2. Product Strategy
22. Value Chain Analysis
22.1. Operating margins at each node of supply chain
22.2. List of Active Market Participants
22.2.1. Product Manufacturers
22.2.2. Key Brands
23. Assumptions and Acronyms Used
24. Research Methodology
Let us know your requirement to get
100% FREE customization
Table 1: Global Food Amino Acids Market Value (USD Mn) and Forecast by Region, 2017-2021
Table 2: Global Food Amino Acids Market Value (USD Mn) and Forecast by Region, 2022-2032
Table 3: Global Food Amino Acids Market Volume (Metric Tons) and Forecast by Region, 2017-2021
Table 4: Global Food Amino Acids Market Volume (Metric Tons) and Forecast by Region, 2022-2032
Table 5: Global Food Amino Acids Market Value (USD Mn) and Forecast by Type, 2017-2021
Table 6: Global Food Amino Acids Market Value (USD Mn) and Forecast by Type, 2022-2032
Table 7: Global Food Amino Acids Market Volume (Metric Tons) and Forecast by Type, 2017-2021
Table 8: Global Food Amino Acids Market Volume (Metric Tons) and Forecast by Type, 2022-2032
Table 9: Global Food Amino Acids Market Value (USD Mn) and Forecast by Source, 2017-2021
Table 10: Global Food Amino Acids Market Value (USD Mn) and Forecast by Source, 2022-2032
Table 11: Global Food Amino Acids Market Volume (Metric Tons) and Forecast by Source, 2017-2021
Table 12: Global Food Amino Acids Market Volume (Metric Tons) and Forecast by Source, 2022-2032
Table 13: Global Food Amino Acids Market Value (USD Mn) and Forecast by Application, 2017-2021
Table 14: Global Food Amino Acids Market Value (USD Mn) and Forecast by Application, 2022-2032
Table 15: Global Food Amino Acids Market Volume (Metric Tons) and Forecast by Application, 2017-2021
Table 16: Global Food Amino Acids Market Volume (Metric Tons) and Forecast by Application, 2022-2032
Table 17: North America Food Amino Acids Market Value (USD Mn) and Forecast by Country, 2017-2021
Table 18: North America Food Amino Acids Market Value (USD Mn) and Forecast by Country, 2022-2032
Table 19: North America Food Amino Acids Market Volume (Metric Tons) and Forecast by Country, 2017-2021
Table 20: North America Food Amino Acids Market Volume (Metric Tons) and Forecast by Country, 2022-2032
Table 21: North America Food Amino Acids Market Value (USD Mn) and Forecast by Type, 2017-2021
Table 22: North America Food Amino Acids Market Value (USD Mn) and Forecast by Type, 2022-2032
Table 23: North America Food Amino Acids Market Volume (Metric Tons) and Forecast by Type, 2017-2021
Table 24: North America Food Amino Acids Market Volume (Metric Tons) and Forecast by Type, 2022-2032
Table 25: North America Food Amino Acids Market Value (USD Mn) and Forecast by Source, 2017-2021
Table 26: North America Food Amino Acids Market Value (USD Mn) and Forecast by Source, 2022-2032
Table 27: North America Food Amino Acids Market Volume (Metric Tons) and Forecast by Source, 2017-2021
Table 28: North America Food Amino Acids Market Volume (Metric Tons) and Forecast by Source, 2022-2032
Table 29: North America Food Amino Acids Market Value (USD Mn) and Forecast by Application, 2017-2021
Table 30: North America Food Amino Acids Market Value (USD Mn) and Forecast by Application, 2022-2032
Table 31: North America Food Amino Acids Market Volume (Metric Tons) and Forecast by Application, 2017-2021
Table 32: North America Food Amino Acids Market Volume (Metric Tons) and Forecast by Application, 2022-2032
Table 33: Latin America Food Amino Acids Market Value (USD Mn) and Forecast by Country, 2017-2021
Table 34: Latin America Food Amino Acids Market Value (USD Mn) and Forecast by Country, 2022-2032
Table 35: Latin America Food Amino Acids Market Volume (Metric Tons) and Forecast by Country, 2017-2021
Table 36: Latin America Food Amino Acids Market Volume (Metric Tons) and Forecast by Country, 2022-2032
Table 37: Latin America Food Amino Acids Market Value (USD Mn) and Forecast by Type, 2017-2021
Table 38: Latin America Food Amino Acids Market Value (USD Mn) and Forecast by Type, 2022-2032
Table 39: Latin America Food Amino Acids Market Volume (Metric Tons) and Forecast by Type, 2017-2021
Table 40: Latin America Food Amino Acids Market Volume (Metric Tons) and Forecast by Type, 2022-2032
Table 41: Latin America Food Amino Acids Market Value (USD Mn) and Forecast by Source, 2017-2021
Table 42: Latin America Food Amino Acids Market Value (USD Mn) and Forecast by Source, 2022-2032
Table 43: Latin America Food Amino Acids Market Volume (Metric Tons) and Forecast by Source, 2017-2021
Table 44: Latin America Food Amino Acids Market Volume (Metric Tons) and Forecast by Source, 2022-2032
Table 45: Latin America Food Amino Acids Market Value (USD Mn) and Forecast by Application, 2017-2021
Table 46: Latin America Food Amino Acids Market Value (USD Mn) and Forecast by Application, 2022-2032
Table 47: Latin America Food Amino Acids Market Volume (Metric Tons) and Forecast by Application, 2017-2021
Table 48: Latin America Food Amino Acids Market Volume (Metric Tons) and Forecast by Application, 2022-2032
Table 49: Europe Food Amino Acids Market Value (USD Mn) and Forecast by Country, 2017-2021
Table 50: Europe Food Amino Acids Market Value (USD Mn) and Forecast by Country, 2022-2032
Table 51: Europe Food Amino Acids Market Volume (Metric Tons) and Forecast by Country, 2017-2021
Table 52: Europe Food Amino Acids Market Volume (Metric Tons) and Forecast by Country, 2022-2032
Table 53: Europe Food Amino Acids Market Value (USD Mn) and Forecast by Type, 2017-2021
Table 54: Europe Food Amino Acids Market Value (USD Mn) and Forecast by Type, 2022-2032
Table 55: Europe Food Amino Acids Market Volume (Metric Tons) and Forecast by Type, 2017-2021
Table 56: Europe Food Amino Acids Market Volume (Metric Tons) and Forecast by Type, 2022-2032
Table 57: Europe Food Amino Acids Market Value (USD Mn) and Forecast by Source, 2017-2021
Table 58: Europe Food Amino Acids Market Value (USD Mn) and Forecast by Source, 2022-2032
Table 59: Europe Food Amino Acids Market Volume (Metric Tons) and Forecast by Source, 2017-2021
Table 60: Europe Food Amino Acids Market Volume (Metric Tons) and Forecast by Source, 2022-2032
Table 61: Europe Food Amino Acids Market Value (USD Mn) and Forecast by Application, 2017-2021
Table 62: Europe Food Amino Acids Market Value (USD Mn) and Forecast by Application, 2022-2032
Table 63: Europe Food Amino Acids Market Volume (Metric Tons) and Forecast by Application, 2017-2021
Table 64: Europe Food Amino Acids Market Volume (Metric Tons) and Forecast by Application, 2022-2032
Table 65: East Asia Food Amino Acids Market Value (USD Mn) and Forecast by Country, 2017-2021
Table 66: East Asia Food Amino Acids Market Value (USD Mn) and Forecast by Country, 2022-2032
Table 67: East Asia Food Amino Acids Market Volume (Metric Tons) and Forecast by Country, 2017-2021
Table 68: East Asia Food Amino Acids Market Volume (Metric Tons) and Forecast by Country, 2022-2032
Table 69: East Asia Food Amino Acids Market Value (USD Mn) and Forecast by Type, 2017-2021
Table 70: East Asia Food Amino Acids Market Value (USD Mn) and Forecast by Type, 2022-2032
Table 71: East Asia Food Amino Acids Market Volume (Metric Tons) and Forecast by Type, 2017-2021
Table 72: East Asia Food Amino Acids Market Volume (Metric Tons) and Forecast by Type, 2022-2032
Table 73: East Asia Food Amino Acids Market Value (USD Mn) and Forecast by Source, 2017-2021
Table 74: East Asia Food Amino Acids Market Value (USD Mn) and Forecast by Source, 2022-2032
Table 75: East Asia Food Amino Acids Market Volume (Metric Tons) and Forecast by Source, 2017-2021
Table 76: East Asia Food Amino Acids Market Volume (Metric Tons) and Forecast by Source, 2022-2032
Table 77: East Asia Food Amino Acids Market Value (USD Mn) and Forecast by Application, 2017-2021
Table 78: East Asia Food Amino Acids Market Value (USD Mn) and Forecast by Application, 2022-2032
Table 79: East Asia Food Amino Acids Market Volume (Metric Tons) and Forecast by Application, 2017-2021
Table 80: East Asia Food Amino Acids Market Volume (Metric Tons) and Forecast by Application, 2022-2032
Table 81: South Asia Food Amino Acids Market Value (USD Mn) and Forecast by Country, 2017-2021
Table 82: South Asia Food Amino Acids Market Value (USD Mn) and Forecast by Country, 2022-2032
Table 83: South Asia Food Amino Acids Market Volume (Metric Tons) and Forecast by Country, 2017-2021
Table 84: South Asia Food Amino Acids Market Volume (Metric Tons) and Forecast by Country, 2022-2032
Table 85: South Asia Food Amino Acids Market Value (USD Mn) and Forecast by Type, 2017-2021
Table 86: South Asia Food Amino Acids Market Value (USD Mn) and Forecast by Type, 2022-2032
Table 87: South Asia Food Amino Acids Market Volume (Metric Tons) and Forecast by Type, 2017-2021
Table 88: South Asia Food Amino Acids Market Volume (Metric Tons) and Forecast by Type, 2022-2032
Table 89: South Asia Food Amino Acids Market Value (USD Mn) and Forecast by Source, 2017-2021
Table 90: South Asia Food Amino Acids Market Value (USD Mn) and Forecast by Source, 2022-2032
Table 91: South Asia Food Amino Acids Market Volume (Metric Tons) and Forecast by Source, 2017-2021
Table 92: South Asia Food Amino Acids Market Volume (Metric Tons) and Forecast by Source, 2022-2032
Table 93: South Asia Food Amino Acids Market Value (USD Mn) and Forecast by Application, 2017-2021
Table 94: South Asia Food Amino Acids Market Value (USD Mn) and Forecast by Application, 2022-2032
Table 95: South Asia Food Amino Acids Market Volume (Metric Tons) and Forecast by Application, 2017-2021
Table 96: South Asia Food Amino Acids Market Volume (Metric Tons) and Forecast by Application, 2022-2032
Table 97: Oceania Food Amino Acids Market Value (USD Mn) and Forecast by Country, 2017-2021
Table 98: Oceania Food Amino Acids Market Value (USD Mn) and Forecast by Country, 2022-2032
Table 99: Oceania Food Amino Acids Market Volume (Metric Tons) and Forecast by Country, 2017-2021
Table 100: Oceania Food Amino Acids Market Volume (Metric Tons) and Forecast by Country, 2022-2032
Table 101: Oceania Food Amino Acids Market Value (USD Mn) and Forecast by Type, 2017-2021
Table 102: Oceania Food Amino Acids Market Value (USD Mn) and Forecast by Type, 2022-2032
Table 103: Oceania Food Amino Acids Market Volume (Metric Tons) and Forecast by Type, 2017-2021
Table 104: Oceania Food Amino Acids Market Volume (Metric Tons) and Forecast by Type, 2022-2032
Table 105: Oceania Food Amino Acids Market Value (USD Mn) and Forecast by Source, 2017-2021
Table 106: Oceania Food Amino Acids Market Value (USD Mn) and Forecast by Source, 2022-2032
Table 107: Oceania Food Amino Acids Market Volume (Metric Tons) and Forecast by Source, 2017-2021
Table 108: Oceania Food Amino Acids Market Volume (Metric Tons) and Forecast by Source, 2022-2032
Table 109: Oceania Food Amino Acids Market Value (USD Mn) and Forecast by Application, 2017-2021
Table 110: Oceania Food Amino Acids Market Value (USD Mn) and Forecast by Application, 2022-2032
Table 111: Oceania Food Amino Acids Market Volume (Metric Tons) and Forecast by Application, 2017-2021
Table 112: Oceania Food Amino Acids Market Volume (Metric Tons) and Forecast by Application, 2022-2032
Table 113: Middle East & Africa Food Amino Acids Market Value (USD Mn) and Forecast by Country, 2017-2021
Table 114: Middle East & Africa Food Amino Acids Market Value (USD Mn) and Forecast by Country, 2022-2032
Table 115: Middle East & Africa Food Amino Acids Market Volume (Metric Tons) and Forecast by Country, 2017-2021
Table 116: Middle East & Africa Food Amino Acids Market Volume (Metric Tons) and Forecast by Country, 2022-2032
Table 117: Middle East & Africa Food Amino Acids Market Value (USD Mn) and Forecast by Type, 2017-2021
Table 118: Middle East & Africa Food Amino Acids Market Value (USD Mn) and Forecast by Type, 2022-2032
Table 119: Middle East & Africa Food Amino Acids Market Volume (Metric Tons) and Forecast by Type, 2017-2021
Table 120: Middle East & Africa Food Amino Acids Market Volume (Metric Tons) and Forecast by Type, 2022-2032
Table 121: Middle East & Africa Food Amino Acids Market Value (USD Mn) and Forecast by Source, 2017-2021
Table 122: Middle East & Africa Food Amino Acids Market Value (USD Mn) and Forecast by Source, 2022-2032
Table 123: Middle East & Africa Food Amino Acids Market Volume (Metric Tons) and Forecast by Source, 2017-2021
Table 124: Middle East & Africa Food Amino Acids Market Volume (Metric Tons) and Forecast by Source, 2022-2032
Table 125: Middle East & Africa Food Amino Acids Market Value (USD Mn) and Forecast by Application, 2017-2021
Table 126: Middle East & Africa Food Amino Acids Market Value (USD Mn) and Forecast by Application, 2022-2032
Table 127: Middle East & Africa Food Amino Acids Market Volume (Metric Tons) and Forecast by Application, 2017-2021
Table 128: Middle East & Africa Food Amino Acids Market Volume (Metric Tons) and Forecast by Application, 2022-2032
Find your sweet spots for generating winning opportunities in this market.
Talk to AnalystFigure 1: Global Food Amino Acids Market Value (USD Mn) and Volume (MT) Forecast, 2022-2032
Figure 2: Global Food Amino Acids Market Absolute $ Opportunity (USD Mn), 2022-2032
Figure 3: Global Food Amino Acids Market Value (USD Mn) and % Growth by Region, 2022-2032
Figure 4: Global Food Amino Acids Market Y-o-Y Growth Rate by Region, 2022-2032
Figure 5: Global Food Amino Acids Market Value (USD Mn) and % Growth by Type, 2022-2032
Figure 6: Global Food Amino Acids Market Y-o-Y Growth Rate by Type, 2022-2032
Figure 7: Global Food Amino Acids Market Value (USD Mn) and % Growth by Source, 2022-2032
Figure 8: Global Food Amino Acids Market Y-o-Y Growth Rate by Source, 2022-2032
Figure 9: Global Food Amino Acids Market Value (USD Mn) and % Growth by Application, 2022-2032
Figure 10: Global Food Amino Acids Market Y-o-Y Growth Rate by Application, 2022-2032
Figure 11: Global Food Amino Acids Market Attractiveness Analysis by Region, 2022-2032
Figure 12: Global Food Amino Acids Market Attractiveness Analysis by Type, 2022-2032
Figure 13: Global Food Amino Acids Market Attractiveness Analysis by Source, 2022-2032
Figure 14: Global Food Amino Acids Market Attractiveness Analysis by Application, 2022-2032
Figure 15: North America Food Amino Acids Market Value (USD Mn) and Volume (MT) Forecast, 2022-2032
Figure 16: North America Food Amino Acids Market Absolute $ Opportunity (USD Mn), 2022-2032
Figure 17: North America Food Amino Acids Market Value (USD Mn) and % Growth by Country, 2022-2032
Figure 18: North America Food Amino Acids Market Y-o-Y Growth Rate by Country, 2022-2032
Figure 19: North America Food Amino Acids Market Value (USD Mn) and % Growth by Type, 2022-2032
Figure 20: North America Food Amino Acids Market Y-o-Y Growth Rate by Type, 2022-2032
Figure 21: North America Food Amino Acids Market Value (USD Mn) and % Growth by Source, 2022-2032
Figure 22: North America Food Amino Acids Market Y-o-Y Growth Rate by Source, 2022-2032
Figure 23: North America Food Amino Acids Market Value (USD Mn) and % Growth by Application, 2022-2032
Figure 24: North America Food Amino Acids Market Y-o-Y Growth Rate by Application, 2022-2032
Figure 25: North America Food Amino Acids Market Attractiveness Analysis by Country, 2022-2032
Figure 26: North America Food Amino Acids Market Attractiveness Analysis by Type, 2022-2032
Figure 27: North America Food Amino Acids Market Attractiveness Analysis by Source, 2022-2032
Figure 28: North America Food Amino Acids Market Attractiveness Analysis by Application, 2022-2032
Figure 29: Latin America Food Amino Acids Market Value (USD Mn) and Volume (MT) Forecast, 2022-2032
Figure 30: Latin America Food Amino Acids Market Absolute $ Opportunity (USD Mn), 2022-2032
Figure 31: Latin America Food Amino Acids Market Value (USD Mn) and % Growth by Country, 2022-2032
Figure 32: Latin America Food Amino Acids Market Y-o-Y Growth Rate by Country, 2022-2032
Figure 33: Latin America Food Amino Acids Market Value (USD Mn) and % Growth by Type, 2022-2032
Figure 34: Latin America Food Amino Acids Market Y-o-Y Growth Rate by Type, 2022-2032
Figure 35: Latin America Food Amino Acids Market Value (USD Mn) and % Growth by Source, 2022-2032
Figure 36: Latin America Food Amino Acids Market Y-o-Y Growth Rate by Source, 2022-2032
Figure 37: Latin America Food Amino Acids Market Value (USD Mn) and % Growth by Application, 2022-2032
Figure 38: Latin America Food Amino Acids Market Y-o-Y Growth Rate by Application, 2022-2032
Figure 39: Latin America Food Amino Acids Market Attractiveness Analysis by Country, 2022-2032
Figure 40: Latin America Food Amino Acids Market Attractiveness Analysis by Type, 2022-2032
Figure 41: Latin America Food Amino Acids Market Attractiveness Analysis by Source, 2022-2032
Figure 42: Latin America Food Amino Acids Market Attractiveness Analysis by Application, 2022-2032
Figure 43: Europe Food Amino Acids Market Value (USD Mn) and Volume (MT) Forecast, 2022-2032
Figure 44: Europe Food Amino Acids Market Absolute $ Opportunity (USD Mn), 2022-2032
Figure 45: Europe Food Amino Acids Market Value (USD Mn) and % Growth by Country, 2022-2032
Figure 46: Europe Food Amino Acids Market Y-o-Y Growth Rate by Country, 2022-2032
Figure 47: Europe Food Amino Acids Market Value (USD Mn) and % Growth by Type, 2022-2032
Figure 48: Europe Food Amino Acids Market Y-o-Y Growth Rate by Type, 2022-2032
Figure 49: Europe Food Amino Acids Market Value (USD Mn) and % Growth by Source, 2022-2032
Figure 50: Europe Food Amino Acids Market Y-o-Y Growth Rate by Source, 2022-2032
Figure 51: Europe Food Amino Acids Market Value (USD Mn) and % Growth by Application, 2022-2032
Figure 52: Europe Food Amino Acids Market Y-o-Y Growth Rate by Application, 2022-2032
Figure 53: Europe Food Amino Acids Market Attractiveness Analysis by Country, 2022-2032
Figure 54: Europe Food Amino Acids Market Attractiveness Analysis by Type, 2022-2032
Figure 55: Europe Food Amino Acids Market Attractiveness Analysis by Source, 2022-2032
Figure 56: Europe Food Amino Acids Market Attractiveness Analysis by Application, 2022-2032
Figure 57: East Asia Food Amino Acids Market Value (USD Mn) and Volume (MT) Forecast, 2022-2032
Figure 58: East Asia Food Amino Acids Market Absolute $ Opportunity (USD Mn), 2022-2032
Figure 59: East Asia Food Amino Acids Market Value (USD Mn) and % Growth by Country, 2022-2032
Figure 60: East Asia Food Amino Acids Market Y-o-Y Growth Rate by Country, 2022-2032
Figure 61: East Asia Food Amino Acids Market Value (USD Mn) and % Growth by Type, 2022-2032
Figure 62: East Asia Food Amino Acids Market Y-o-Y Growth Rate by Type, 2022-2032
Figure 63: East Asia Food Amino Acids Market Value (USD Mn) and % Growth by Source, 2022-2032
Figure 64: East Asia Food Amino Acids Market Y-o-Y Growth Rate by Source, 2022-2032
Figure 65: East Asia Food Amino Acids Market Value (USD Mn) and % Growth by Application, 2022-2032
Figure 66: East Asia Food Amino Acids Market Y-o-Y Growth Rate by Application, 2022-2032
Figure 67: East Asia Food Amino Acids Market Attractiveness Analysis by Country, 2022-2032
Figure 68: East Asia Food Amino Acids Market Attractiveness Analysis by Type, 2022-2032
Figure 69: East Asia Food Amino Acids Market Attractiveness Analysis by Source, 2022-2032
Figure 70: East Asia Food Amino Acids Market Attractiveness Analysis by Application, 2022-2032
Figure 71: South Asia Food Amino Acids Market Value (USD Mn) and Volume (MT) Forecast, 2022-2032
Figure 72: South Asia Food Amino Acids Market Absolute $ Opportunity (USD Mn), 2022-2032
Figure 73: South Asia Food Amino Acids Market Value (USD Mn) and % Growth by Country, 2022-2032
Figure 74: South Asia Food Amino Acids Market Y-o-Y Growth Rate by Country, 2022-2032
Figure 75: South Asia Food Amino Acids Market Value (USD Mn) and % Growth by Type, 2022-2032
Figure 76: South Asia Food Amino Acids Market Y-o-Y Growth Rate by Type, 2022-2032
Figure 77: South Asia Food Amino Acids Market Value (USD Mn) and % Growth by Source, 2022-2032
Figure 78: South Asia Food Amino Acids Market Y-o-Y Growth Rate by Source, 2022-2032
Figure 79: South Asia Food Amino Acids Market Value (USD Mn) and % Growth by Application, 2022-2032
Figure 80: South Asia Food Amino Acids Market Y-o-Y Growth Rate by Application, 2022-2032
Figure 81: South Asia Food Amino Acids Market Attractiveness Analysis by Country, 2022-2032
Figure 82: South Asia Food Amino Acids Market Attractiveness Analysis by Type, 2022-2032
Figure 83: South Asia Food Amino Acids Market Attractiveness Analysis by Source, 2022-2032
Figure 84: South Asia Food Amino Acids Market Attractiveness Analysis by Application, 2022-2032
Figure 85: Oceania Food Amino Acids Market Value (USD Mn) and Volume (MT) Forecast, 2022-2032
Figure 86: Oceania Food Amino Acids Market Absolute $ Opportunity (USD Mn), 2022-2032
Figure 87: Oceania Food Amino Acids Market Value (USD Mn) and % Growth by Country, 2022-2032
Figure 88: Oceania Food Amino Acids Market Y-o-Y Growth Rate by Country, 2022-2032
Figure 89: Oceania Food Amino Acids Market Value (USD Mn) and % Growth by Type, 2022-2032
Figure 90: Oceania Food Amino Acids Market Y-o-Y Growth Rate by Type, 2022-2032
Figure 91: Oceania Food Amino Acids Market Value (USD Mn) and % Growth by Source, 2022-2032
Figure 92: Oceania Food Amino Acids Market Y-o-Y Growth Rate by Source, 2022-2032
Figure 93: Oceania Food Amino Acids Market Value (USD Mn) and % Growth by Application, 2022-2032
Figure 94: Oceania Food Amino Acids Market Y-o-Y Growth Rate by Application, 2022-2032
Figure 95: Oceania Food Amino Acids Market Attractiveness Analysis by Country, 2022-2032
Figure 96: Oceania Food Amino Acids Market Attractiveness Analysis by Type, 2022-2032
Figure 97: Oceania Food Amino Acids Market Attractiveness Analysis by Source, 2022-2032
Figure 98: Oceania Food Amino Acids Market Attractiveness Analysis by Application, 2022-2032
Figure 99: Middle East & Africa Food Amino Acids Market Value (USD Mn) and Volume (MT) Forecast, 2022-2032
Figure 100: Middle East & Africa Food Amino Acids Market Absolute $ Opportunity (USD Mn), 2022-2032
Figure 101: Middle East & Africa Food Amino Acids Market Value (USD Mn) and % Growth by Country, 2022-2032
Figure 102: Middle East & Africa Food Amino Acids Market Y-o-Y Growth Rate by Country, 2022-2032
Figure 103: Middle East & Africa Food Amino Acids Market Value (USD Mn) and % Growth by Type, 2022-2032
Figure 104: Middle East & Africa Food Amino Acids Market Y-o-Y Growth Rate by Type, 2022-2032
Figure 105: Middle East & Africa Food Amino Acids Market Value (USD Mn) and % Growth by Source, 2022-2032
Figure 106: Middle East & Africa Food Amino Acids Market Y-o-Y Growth Rate by Source, 2022-2032
Figure 107: Middle East & Africa Food Amino Acids Market Value (USD Mn) and % Growth by Application, 2022-2032
Figure 108: Middle East & Africa Food Amino Acids Market Y-o-Y Growth Rate by Application, 2022-2032
Figure 109: Middle East & Africa Food Amino Acids Market Attractiveness Analysis by Country, 2022-2032
Figure 110: Middle East & Africa Food Amino Acids Market Attractiveness Analysis by Type, 2022-2032
Figure 111: Middle East & Africa Food Amino Acids Market Attractiveness Analysis by Source, 2022-2032
Figure 112: Middle East & Africa Food Amino Acids Market Attractiveness Analysis by Application, 2022-2032
Need specific information?
Request CustomizationExplore Food and Beverage Insights
View Reports