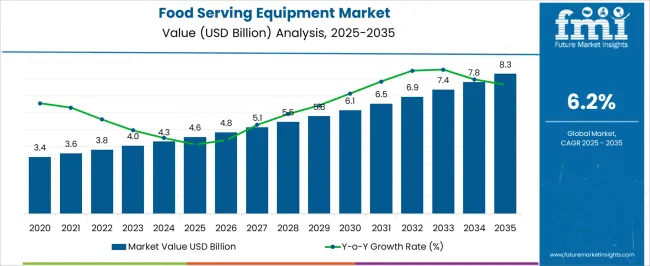
The Food Serving Equipment Market is estimated to be valued at USD 4.6 billion in 2025 and is projected to reach USD 8.3 billion by 2035, registering a compound annual growth rate (CAGR) of 6.2% over the forecast period.
| Metric | Value |
|---|---|
| Food Serving Equipment Market Estimated Value in (2025 E) | USD 4.6 billion |
| Food Serving Equipment Market Forecast Value in (2035 F) | USD 8.3 billion |
| Forecast CAGR (2025 to 2035) | 6.2% |
The Food Serving Equipment Market is experiencing consistent growth, supported by increasing global foodservice consumption and the expansion of hospitality and institutional catering sectors. The current market landscape is shaped by a growing focus on food safety standards, energy-efficient operations, and digital monitoring systems. Leading manufacturers are aligning with sustainability goals and regulatory requirements by introducing smart, modular equipment that minimizes operational waste and optimizes temperature and storage control.
As per industry statements and technology provider announcements, the demand for equipment that ensures hygiene, efficiency, and food integrity is intensifying across both commercial and institutional segments. This momentum is expected to continue as quick-service chains and full-service restaurants expand their footprint in emerging economies.
Press releases and investor updates from key players also highlight increasing capital expenditure in foodservice infrastructure, modernization of kitchen facilities, and demand for multi-functional, space-saving equipment These developments are collectively driving the adoption of advanced food serving equipment across varied end-user verticals, reinforcing a steady upward growth trajectory for the market.
The market is segmented by Product Type and End User and region. By Product Type, the market is divided into Refrigeration Equipment, Kitchen Purpose Equipment, Ware Washing Equipment, and Food Holding & Storing Equipment. In terms of End User, the market is classified into Full-Service Restaurants, Quick Service Restaurants, Hotels, Airports, Railways, Hospitals, Schools, and Supermarkets & Delis. Regionally, the market is classified into North America, Latin America, Western Europe, Eastern Europe, Balkan & Baltic Countries, Russia & Belarus, Central Asia, East Asia, South Asia & Pacific, and the Middle East & Africa.
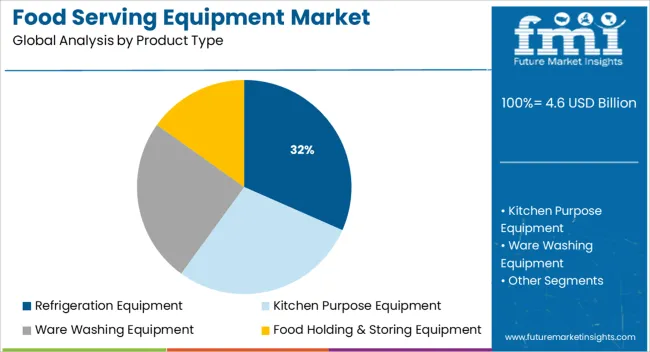
The refrigeration equipment segment is projected to contribute 31.6% of the Food Serving Equipment Market revenue share in 2025, making it the largest product type segment. This dominance is being driven by its critical role in ensuring food safety, preservation, and compliance with temperature control standards in commercial foodservice operations. The segment has witnessed increased adoption due to stringent regulations mandating safe storage of perishable items across restaurants, hotels, and institutional kitchens.
Product announcements by leading manufacturers have emphasized innovation in energy-efficient compressors, smart temperature monitoring, and modular designs that cater to limited-space kitchens. This equipment is also being favored due to its integration with digital inventory systems and real-time alerts, which reduce spoilage and operational downtime.
The focus on cold-chain compliance, especially in large-scale catering and hospitality services, has further reinforced its importance The rising need for fresh, ready-to-serve, and safely stored food in both dine-in and takeaway models has significantly contributed to the sustained growth of this segment.
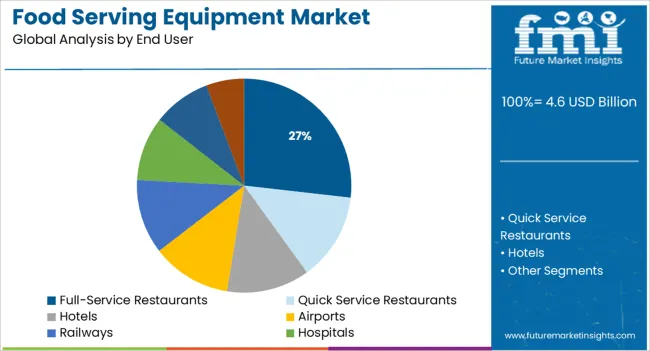
The full-service restaurants segment is anticipated to hold 26.8% of the Food Serving Equipment Market revenue share in 2025, establishing itself as the leading end-user segment. This leadership position is being supported by the expansion of dining establishments, evolving consumer preferences for dine-in experiences, and the increased focus on food presentation and service quality. Investor updates and hospitality industry reports have highlighted that full-service restaurants are investing in premium-grade serving equipment to ensure operational efficiency, maintain food quality, and comply with food safety protocols.
The segment’s growth is being further supported by rising disposable incomes, urbanization, and a global shift toward experiential dining. Manufacturers have responded to this demand by offering custom solutions that support volume serving, portion control, and temperature maintenance.
Additionally, the integration of digital interfaces in serving equipment has enabled better kitchen-to-table coordination and reduced turnaround time, making them a preferred choice for full-service dining formats These factors have collectively contributed to the segment’s strong market positioning in 2025.
During the historical period from 2020 to 2025, the global food-serving equipment market exhibited steady growth at a CAGR of 4.6%. This growth is attributed to the emergence of custom food service appliances to cook a wide range of cuisines. Besides, the invention of advanced equipment and machinery for storing and preparing food such as electric refrigerators, ranges, and cooking stoves is another vital factor that pushed growth in the global food serving equipment market during the historical period.
Ongoing technological advancements with the help of continuous research and development (R&D) activities are likely to help appliance companies to deliver highly efficient products to their clients. Demand for unique food serving equipment is also expected to surge in the evaluation period with the emergence of multiple casual restaurant chains across Europe, Asia Pacific, North America, and Latin America.
Companies in these regions are nowadays mandated to sell tested and certified commercial kitchen appliances as per the safety rules implemented by government bodies across the globe. For instance, the National Sanitation Foundation (NSF), which is an American product certification, inspection, and testing non-profit organization, announced the development of new equipment safety standards to ensure food sanitation protocols and safety requirements are maintained by end-use industries. Owing to the aforementioned factors, the global food serving equipment market is estimated to showcase a CAGR of 6.2% in the forecast period (2025 to 2035).
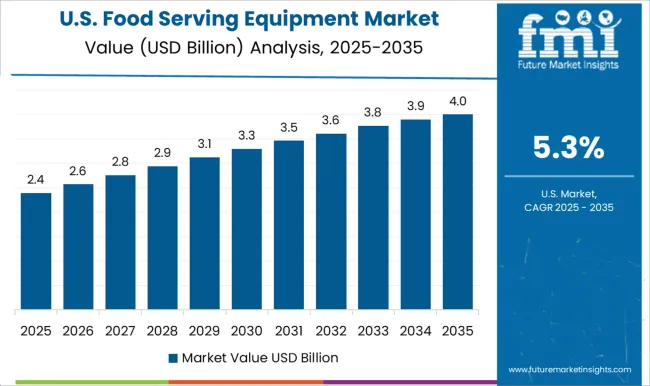
Rising Number of Fast Food Chains in the USA to Spur Sales of Electric Serving Warmers
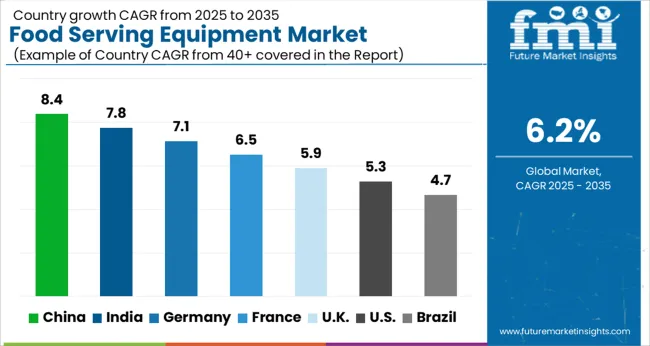
As per FMI, the food serving equipment market in the USA is estimated to be worth about USD 8.3 million by the end of 2035. The country is anticipated to generate nearly 72% of the North American market share during the assessment period. A rising number of fast food chains and restaurants across the US is projected to drive the market in the next decade. Also, the urgent need to extend the shelf life of food items and maintain their optimum temperature is likely to bolster the market.
Expansion of Tourism in the UK to Boost the Demand for Food Serving Supplies
In the next ten years, the UK is estimated to account for around 23% of the share in the Europe food serving equipment market. The country is projected to create an absolute dollar opportunity of nearly USD 332 Million by the end of 2035. Ongoing advancements in the food processing sector is one of the major factor contributing to growth in the UK market.
Besides, the presence of well-established brands such as Fryer's, Chicken Cottage, Leon Restaurants, Krispy Kreme UK, Ed's Easy Diner, Sam's Chicken, and Morley's in the country is anticipated to foster sales. Government initiatives to expand the tourism sector and immigration in the country are also set to uplift the restaurant industry, thereby fueling sales of food-serving equipment across the UK.
Westernizing Dining Customs in China to Push Sales of Commercial Kitchen Equipment
According to FMI, the China food serving equipment market is set to be worth over USD 255.4 Million, accounting for 32% of the Asia Pacific market share during the forecast period. This growth is attributed to the rising population in the country with a wide range of socioeconomic and cultural characteristics.
Furthermore, as western countries have increased their investments in the country to develop its food industry, demand for food serving equipment has surged. It has led to the advancement of production levels and the reduction of processing times.
Apart from that, the expansion of the tourism sector and rapidly westernizing dining customs in China are expected to bolster the market. A rising number of customers experimenting with new foods and developing a taste for different cuisines are compelling restaurants in the country to incorporate various cuisines into their menus. Coupled with this, the high demand for processed food and beverages in China is projected to drive the market.
Quick Service Restaurants to Look for Advanced Electric Hot Food Serving Counters
Based on end users, the quick-service restaurant segment is expected to remain at the forefront in the global food-serving equipment market in the next ten years. Quick-service restaurants have recently evolved as a significant providers of mass-produced food, which has been attracting a rising number of consumers towards enjoying and experiencing their services. Economical, good taste and convenience in terms of both money and time are some of the vital factors supporting the segment’s growth.
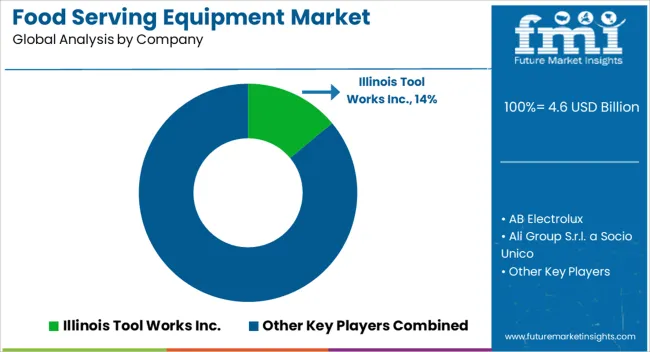
The global food serving equipment market is highly fragmented with the presence of a large number of key players. The rising deployment of sustainable technology in modern equipment has encouraged key companies to focus more on mergers & acquisitions and partnerships that would benefit their business. Meanwhile, a few other international companies are joining hands with sustainability to develop customer-centric equipment, thereby addressing food wastage problems.
For instance,
| Attribute | Details |
|---|---|
| Estimated Market Size (2025) | USD 4.6 billion |
| Projected Market Valuation (2035) | USD 8.3 billion |
| Value-based CAGR (2025 to 2035) | 6.2% |
| Forecast Period | 2025 to 2035 |
| Historical Data Available for | 2020 to 2025 |
| Market Analysis | Value (USD Million) |
| Key Regions Covered |
North America; Latin America; Europe; Asia Pacific; Oceania; Middle East & Africa (MEA) |
| Key Countries Covered |
The US, Canada, Mexico, Germany, The UK, France, Italy, Spain, China, Japan, India, South Korea, Australia, Brazil, Argentina, South Africa, UAE |
| Key Segments Covered |
Product TypeType, End User, Region |
| Key Companies Profiled |
AB Electrolux; Ali Group S.r.l. a Socio Unico; Dover Corporation; Duke Manufacturing; Dover Corporation; Welbilt Inc. (Manitowoc Foodservice, Inc.); Illinois Tool Works Inc.; Hatco Corporation; Ali Group S.r.l.; MKN Maschinenfabrik Kurt Neubauer GmbH & Co KG; Al-Halabi Refrigeration & Steel LLC; Fujimak Corporation; Conagra Brands; Greencore Group; Nestlé S.A; Olam International; The Kraft Heinz Company; PepsiCo Inc.; AGRANA Group; Bonduelle; Dole Food; SVZ International B.V.;Sahyadri Farms; Diana Group S.A.S.; RAJE AGRO FOODS PRIVET LIMITED |
| Report Coverage | Market Forecast, Company Share Analysis, Competitive Landscape, DROT Analysis, Market Dynamics and Challenges, and Strategic Growth Initiatives |
The global food serving equipment market is estimated to be valued at USD 4.6 billion in 2025.
The market size for the food serving equipment market is projected to reach USD 8.3 billion by 2035.
The food serving equipment market is expected to grow at a 6.2% CAGR between 2025 and 2035.
The key product types in food serving equipment market are refrigeration equipment, kitchen purpose equipment, ware washing equipment and food holding & storing equipment.
In terms of end user, full-service restaurants segment to command 26.8% share in the food serving equipment market in 2025.


Our Research Products

The "Full Research Suite" delivers actionable market intel, deep dives on markets or technologies, so clients act faster, cut risk, and unlock growth.

The Leaderboard benchmarks and ranks top vendors, classifying them as Established Leaders, Leading Challengers, or Disruptors & Challengers.

Locates where complements amplify value and substitutes erode it, forecasting net impact by horizon

We deliver granular, decision-grade intel: market sizing, 5-year forecasts, pricing, adoption, usage, revenue, and operational KPIs—plus competitor tracking, regulation, and value chains—across 60 countries broadly.

Spot the shifts before they hit your P&L. We track inflection points, adoption curves, pricing moves, and ecosystem plays to show where demand is heading, why it is changing, and what to do next across high-growth markets and disruptive tech

Real-time reads of user behavior. We track shifting priorities, perceptions of today’s and next-gen services, and provider experience, then pace how fast tech moves from trial to adoption, blending buyer, consumer, and channel inputs with social signals (#WhySwitch, #UX).

Partner with our analyst team to build a custom report designed around your business priorities. From analysing market trends to assessing competitors or crafting bespoke datasets, we tailor insights to your needs.
Supplier Intelligence
Discovery & Profiling
Capacity & Footprint
Performance & Risk
Compliance & Governance
Commercial Readiness
Who Supplies Whom
Scorecards & Shortlists
Playbooks & Docs
Category Intelligence
Definition & Scope
Demand & Use Cases
Cost Drivers
Market Structure
Supply Chain Map
Trade & Policy
Operating Norms
Deliverables
Buyer Intelligence
Account Basics
Spend & Scope
Procurement Model
Vendor Requirements
Terms & Policies
Entry Strategy
Pain Points & Triggers
Outputs
Pricing Analysis
Benchmarks
Trends
Should-Cost
Indexation
Landed Cost
Commercial Terms
Deliverables
Brand Analysis
Positioning & Value Prop
Share & Presence
Customer Evidence
Go-to-Market
Digital & Reputation
Compliance & Trust
KPIs & Gaps
Outputs
Full Research Suite comprises of:
Market outlook & trends analysis
Interviews & case studies
Strategic recommendations
Vendor profiles & capabilities analysis
5-year forecasts
8 regions and 60+ country-level data splits
Market segment data splits
12 months of continuous data updates
DELIVERED AS:
PDF EXCEL ONLINE
Food & Beverage OEE Software Market Size and Share Forecast Outlook 2025 to 2035
Food Grade Crosslinked Polyvinylpolypyrrolidone (PVPP) Market Size and Share Forecast Outlook 2025 to 2035
Food Grade Cassia Gum Powder Market Size and Share Forecast Outlook 2025 to 2035
Food Grade Dry Film Lubricant Market Size and Share Forecast Outlook 2025 to 2035
Food Basket Market Forecast and Outlook 2025 to 2035
Food Grade Tremella Polysaccharide Market Size and Share Forecast Outlook 2025 to 2035
Food Sorting Machine Market Size and Share Forecast Outlook 2025 to 2035
Foodservice Paper Bag Market Size and Share Forecast Outlook 2025 to 2035
Food Stabilizers Market Size and Share Forecast Outlook 2025 to 2035
Food Packaging Film Market Size and Share Forecast Outlook 2025 to 2035
Food Certification Market Size and Share Forecast Outlook 2025 to 2035
Food Tray Market Size and Share Forecast Outlook 2025 to 2035
Food & Beverage Industrial Disinfection and Cleaning Market Size and Share Forecast Outlook 2025 to 2035
Food Technology Market Size and Share Forecast Outlook 2025 to 2035
Food Tourism Sector Market Size and Share Forecast Outlook 2025 to 2035
Food Processing Boiler Market Size and Share Forecast Outlook 2025 to 2035
Food Packaging Machines Market Size and Share Forecast Outlook 2025 to 2035
Food Minerals Market Size and Share Forecast Outlook 2025 to 2035
Food And Beverage Chemicals Market Size and Share Forecast Outlook 2025 to 2035
Food and Beverage Industry Software Market Size and Share Forecast Outlook 2025 to 2035

Thank you!
You will receive an email from our Business Development Manager. Please be sure to check your SPAM/JUNK folder too.
Chat With
MaRIA