Reports

- Global Locations -

Headquarters

Future Market Insights, Inc.

Christiana Corporate, 200
Continental Drive, Suite 401,
Newark, Delaware - 19713,
United States

T: +1-845-579-5705

Americas

Future Market Insights, Inc.

616 Corporate Way, Suite 2-9018,
Valley Cottage, NY 10989, United States

T: +1-347-918-3531

MEA

Future Market Insights

1602-6 Jumeirah Bay X2 Tower, Plot No: JLT-PH2-X2A,
Jumeirah Lakes Towers, Dubai,
United Arab Emirates

Europe

Future Market Insights

3rd Floor, 207 Regent Street,
W1B 3HH London
United Kingdom

T: + 44 (0) 20 8123 9659
D: +44 (0) 20 3287 4268

Asia Pacific

Future Market Insights

IndiaLand Global Tech Park, Unit UG-1, Behind Grand HighStreet, Phase 1, Hinjawadi, MH, Pune – 411057, India

Food Starch Market Outlook (2023 to 2033)

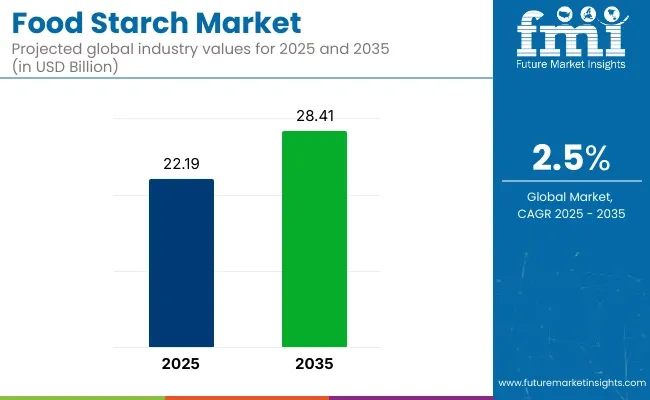
The global food starch market size is expected to reach a valuation of US$ 20.92 billion in 2023. It is set to accelerate at a CAGR of 3% from 2023 to 2032. The global market is anticipated to reach a valuation of US$ 28.83 billion by 2033.

The food starch market is experiencing significant growth and transformation driven by various factors, such as changing consumer preferences, increasing demand for convenience foods, and the growing need for clean-label and natural ingredients.

Food starch, derived from various sources such as corn, wheat, potato, and tapioca, plays a crucial role in the food industry, serving as a versatile ingredient with multiple functionalities, catering to the rising demand.

Attributes Key Statistics
Food Starch Market Estimated Size (2023) US$ 20.92 billion
Projected Market Valuation (2033) US$ 28.83 billion
Value-based CAGR (2023 to 2033) 3%

Don't pay for what you don't need

Customize your report by selecting specific countries or regions and save 30%!

2018 to 2022 Global Food Starch Demand Outlook Compared to 2023 to 2033 Forecast

The global food starch market recorded a CAGR of 2.2% between 2018 and 2022. The period marked increasing investments in research and developmental activities by key players.

Consumer preference for health and wellness maintenance is expected to drive the market for food starch globally.

Cereals and potatoes are the key contributors of starch in diets. It is beneficial to include starch in an individual's diet as it has functional ingredients that help to prevent weight gain and can eliminate severe symptoms of obesity.

Consumers also prefer gluten-free products, which are expected to push food starch demand across the globe. To fulfill the rising demand for low-calorie and low-fat products, starch is being used as an additive in breads, cookies, bread rolls, and sauces.

Owing to the aforementioned factors, the global food starch market is anticipated to exhibit a growth rate of 3% during the forecast period (2023 to 2033).

What are the Top Two Trends Driving Sales of Food Starch?

High Demand for Nutritious Food Items

  • Increasing consumer focus on health and wellness drives the demand for nutritional food products.
  • The market is likely to be swayed by consumers consciously incorporating food products rich in minerals and vitamins to enhance their immunity.
  • The inclination towards maintaining health and wellness is expected to boost the demand for starch food, particularly cereals, and potatoes.
  • Consumers are seeking food options that provide essential nutrients, leading to an increased interest in starch-based food products, in turn boosting market growth.

Increasing Requirement of Clean Label Products

  • Growing demand for clean-label products drives market growth globally.
  • Consumers with easy access to information through social media are increasingly conscious of the raw materials used in food production.
  • Collaboration between key players and international companies aims to develop cleaner starch food products.
  • BENEO GmbH introduced Remypure, a clean-label rice starch, catering to the consumer demand for preservative-free and transparent products.
  • Manufacturers are investing in new technologies to enhance the functional properties of basic cereals, meeting the rising demand for clean-label products.
  • Consumers prefer the clean label variants for their unique texture, aroma, and absence of artificial ingredients.
Nandini Roy Choudhury

Principal Consultant

Talk to Analyst

Find your sweet spots for generating winning opportunities in this market.

What Factors Are Expected to Dwindle the Market Size?

  • Limited availability of specialty starches for niche applications due to restricted sourcing and processing capabilities.
  • Price volatility of raw materials, such as corn and wheat, can impact the cost and profitability of food starch products.
  • Challenges in achieving desired texture, stability, and sensory attributes when formulating with certain starch types.
  • Consumer concerns regarding the potential allergenicity and genetically modified organisms (GMO) in starch-based products.
  • Stringent regulations and labeling requirements related to the use of starches derived from genetically modified crops.
  • Technological limitations in the processing and modification of certain starches hinder their functionality and versatility in food applications.
  • Growing competition from alternative ingredients and additives that offer similar functionalities to starches poses a challenge to the market.
  • Lack of consumer awareness and understanding of food starches' different types and benefits limits market growth and adoption.
  • Environmental concerns related to the production and sourcing of certain starches, such as the use of water and energy-intensive processes.

Comparative View of the Market

Food Starch Market:

Attributes Food Starch Market
CAGR (2023 to 2033) 3%
Market Value (2033) US$ 28.83 billion
Opportunity The increasing demand for gluten-free and clean-label products presents an opportunity for food starch manufacturers to develop innovative and versatile starch solutions that cater to these dietary preferences and market trends.
Key Trends The rising focus on sustainability and environmentally friendly practices in the food industry is driving the adoption of eco-friendly starch sources and production methods, such as using non-GMO crops and implementing energy-efficient manufacturing processes.

Food Additives Market:

Attributes Food Additives Market
CAGR (2023 to 2033) 6.6%
Market Value (2033) US$ 4.62 billion
Opportunity The food service industry, including hotels and restaurants, is experiencing a growing demand for food additives driven by the increasing focus on advanced nutrition in food, creating new market opportunities.
Key Trends Market growth is propelled by the increasing consumer demand for vegan and ready-to-eat food options, creating a surge in market opportunities.

Bakery Ingredients Market:

Attributes Bakery Ingredients Market
CAGR (2023 to 2033) 6.3%
Market Value (2033) US$ 35 billion
Opportunity The market is set to be propelled forward by the increasing demand for clean-label and artisan bakery products, which are gaining significant popularity. This surge in consumer preference presents key trends and opportunities for growth in the industry.
Key Trends Technological advancements have revolutionized the bakery industry by extending the shelf life of baked goods and redefining the key trends in the bakery ingredients market.

Get the data you need at a Fraction of the cost

Personalize your report by choosing insights you need
and save 40%!

Country-wise Insights

How is the United States Food Starch Market Faring?

The United States is one of the leading markets for food starch as it is highly used in ready-to-eat premixes. It is also used in many high-end restaurants and local cafes to make numerous cuisines. Demand for food starch is expected to rise with the growing trend of consumer snacking in the country.

Demand from other countries in North America, like Canada, is expected to grow owing to wide applications of food starch in the chemical, textile, paper, and animal feed industries.

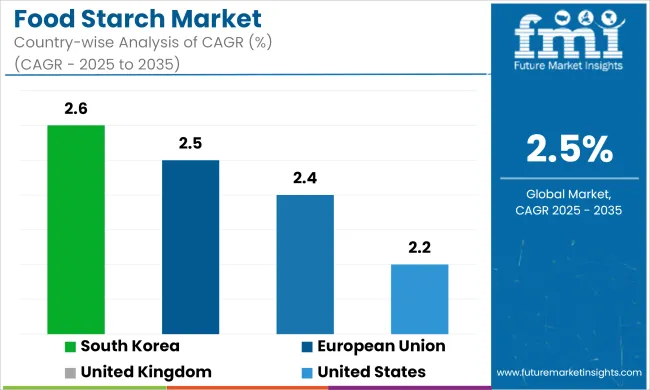
As per FMI, the United States food starch industry is expected to reach a value share of 24.3% in 2023.

The demand for food starch in the United States is influenced by factors such as population growth, changing dietary preferences, and the expansion of the food processing industry.

Why is India Considered to Be a Promising Market for Food Starch?

The food and beverage industry is growing rapidly in India. As a result, demand for cereals, pulses, and carbonated & non-carbonated beverages is rising. Due to rapid urbanization, many people are traveling to cities for work, and it is leading to significant changes in lifestyles.

The high spending capacity of consumers in India is thus set to fuel the demand for ready-to-eat food products that contain food starch. Besides, as food starch can be used as a stabilizer, thickening agent, and emulsifier, its demand is expected to rise in India.

Starch and starch derivatives are considered a key part of staple food preparations like sago, rice, and noodles in the country. As per FMI, the India food starch market is expected to secure a 4.5% CAGR from 2023 to 2033.

How is the United Kingdom Food Starch Industry Progressing?

Meat is a significant component of daily meals in European countries like the United Kingdom, with consumers allocating a significant portion of their food budget to meat and meat products. However, the health risks associated with fat in meat, such as cardiovascular disease, obesity, and cancer, have impacted the demand for meat in the United Kingdom. Consequently, key players are investing in the development of high-quality fat replacement alternatives in the country.

The United Kingdom food starch industry is progressing robustly, driven by evolving consumer preferences and a focus on innovation, facilitating its projected growth rate of 2.8% during the forecast period.

With increasing awareness about the importance of nutrition, consumers in the United Kingdom are seeking healthier and cleaner-label food options. This has led to a surge in demand for food starches that align with clean-label and organic trends.

Manufacturers are investing in research and development to enhance the functional properties of starches and cater to specific dietary requirements, such as gluten-free and vegan options.

The industry's growth is further supported by ongoing product development, ensuring a diverse range of starch products to meet the evolving needs of consumers in the United Kingdom market.

Category-wise Insights

Which is the Leading Source of Food Starches?

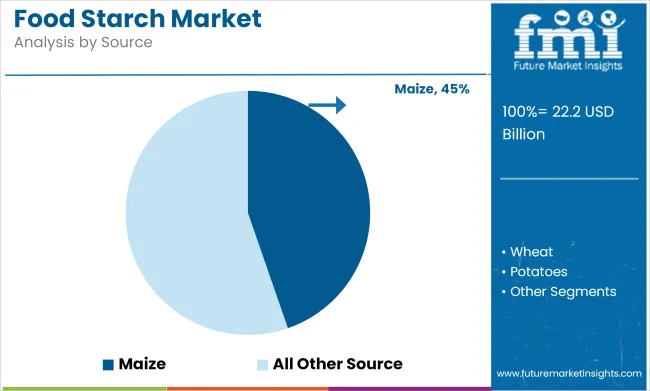
By source, the maize segment is anticipated to be at the forefront of the market during the forecast period, with a value share of 34% in 2022.

Maize starch is obtained from corn grains, and they are used in making corn syrups & sugars, soups, and sauces. Many dieticians suggest including corn starch in daily meals as they help to maintain glucose levels in the body. It is also extensively used for the manufacturing of gloves and diaphragms.

Owing to its wide range of utility, demand for maize starch is expected to rise during the assessment period. Key manufacturers are also focusing on developing new functionalities of maize starch to cater to the rising demand across various end-use industries.

Which is the Highly Preferred Starch Type in the Global Food Starch Market?

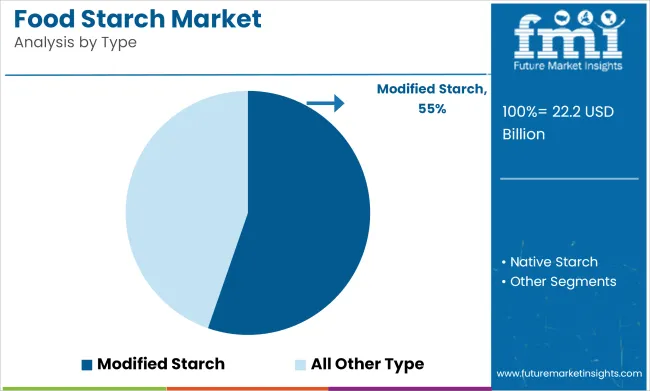
By type, the modified starch segment is likely to lead the market by the end of 2033. Modified starch is prepared enzymatically or chemically by treating native starch to alter its properties.

It is showcasing high demand due to its applications across various industries, aiding the estimated value share of 41% in 2022.

It is used to provide stability against extreme heat or cold. Besides, it can control the viscosity of a liquid. Rising consumer preference for natural ingredients is expected to push the demand for modified food starch owing to its functional benefits.

In Europe, this food starch is extensively used as a natural sweetener in numerous carbonated and non-carbonated energy drinks. As consumer demand for low-fat and low-calorie products is surging, the need for modified food starch is expected to rise in the upcoming decade.

Modified starches can be customized to meet specific application requirements, providing tailored solutions for different food products. They also contribute to clean label formulations by replacing undesirable ingredients.

How is the Competitive Landscape in the Food Starch Industry?

Food starch manufacturers are coming up with new technologies that would fulfill the rising consumer demand for healthy food. Key manufacturers are also developing new varieties of food starch with varying levels of fat content.

  • In March 2020, Tate & Lyle launched a CLARIA EVERLAST line of clean-label starches for freeze-thawing stability. The CLARIA Clean Label Starch product line now comprises cook-up and instant starches made from corn and tapioca starch.

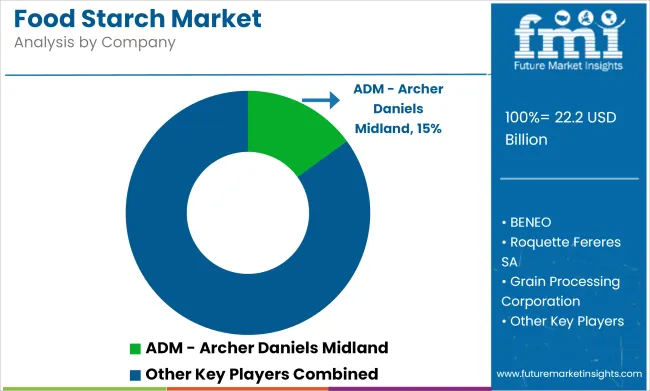
Archer Daniels Midland (ADM) and Agrana Continue to be on the Top of the Food Starch Chain

Archer Daniels Midland (ADM) and Agrana continue making headways in global food starch. Archer Daniels Midland (ADM) specializes in human and animal nutrients. It has a wide range of human nutrition products, including starches, botanicals, edible oils, colors, pulses, beans, nuts, alternative proteins, and many others.

The company's starches are solely derived from plant-based feedstock such as wheat and corn. It offers a diverse portfolio of starches for every end-use industry- from wallboard construction to papermaking. In addition to that, ADM provides specialty EnviroStrip products that have been curated for innovative dry stripping applications.

The company's transfer stations are strategically located across North America and various other production facilities. It provides unique starches through its robust supply chain and distribution networks. It has an extensive distribution system of barges, ships, tractor-trailers, and railcars. Its robust network ensures that the starches reach customers at the right location and time.

The company's starches perform well in solid-fiber and corrugating applications, in addition to the food space. In May 2022, for instance, ADM announced that it is planning to invest in a significant expansion of starch production at its Minnesota facility to meet the surging demand from the food and beverage sector.

Agrana, on the other hand, is in the second position in terms of revenue, followed by ADM in the starch business. It manufactures top-notch starch products by utilizing environmentally-sensitive and modern methods. It uses raw materials like wheat, potatoes, and corn to make starches.

Agrana’s organic starches help in adding value to almost all organic products in the food and luxury food spaces. As starch is used as a thickening agent in the preparation of jellies, snacks, puddings, gums, sauces, and soups, Agrana is expected to showcase high demand.

Segmentation Analysis

By Type:

  • Modified Starch
  • Native Starch

By Source:

  • Maize
  • Wheat
  • Potatoes
  • Other

By Application:

  • Animal Feed
  • Bakery and Confectionery
  • Beverage
  • Cosmetics

By Sales Channel:

  • Offline Sales Channel
    • Supermarkets/Hypermarkets
    • Departmental Stores
    • Convenience Store
    • Other Sales Channel
  • Online Sales Channel
    • Company Website
    • E-commerce Platform

By Region:

  • North America
  • Latin America
  • Europe
  • East Asia
  • South Asia
  • Oceania
  • The Middle East and Africa

Frequently Asked Questions

How Much the Food Starch Market is Slated to Attain?

The market is slated to attain US$ 20.92 billion in 2023.

At What Speed, the Food Starch Market is Expected to Expand?

The market is expected to expand at a CAGR of 3% through 2033.

Which Factors are Stimulating Market Growth?

Increasing demand for nutritious foods and surging preference for clean-label products are stimulating product sales.

Which Factor is Negatively Affecting the Market’s Pace?

Growing competition from alternative ingredients is slowing the market’s pace.

Which Asian Country Exhibits as a Lucrative Investment Opportunity?

India exhibits a profitable investment opportunity for market players.

Table of Content

1. Executive Summary

    1.1. Global Market Outlook

    1.2. Demand-side Trends

    1.3. Supply-side Trends

    1.4. Technology Roadmap Analysis

    1.5. Analysis and Recommendations

2. Market Overview

    2.1. Market Coverage / Taxonomy

    2.2. Market Definition / Scope / Limitations

3. Market Background

    3.1. Market Dynamics

        3.1.1. Drivers

        3.1.2. Restraints

        3.1.3. Opportunity

        3.1.4. Trends

    3.2. Scenario Forecast

        3.2.1. Demand in Optimistic Scenario

        3.2.2. Demand in Likely Scenario

        3.2.3. Demand in Conservative Scenario

    3.3. Opportunity Map Analysis

    3.4. Product Life Cycle Analysis

    3.5. Supply Chain Analysis

        3.5.1. Supply Side Participants and their Roles

            3.5.1.1. Producers

            3.5.1.2. Mid-Level Participants (Traders/ Agents/ Brokers)

            3.5.1.3. Wholesalers and Distributors

        3.5.2. Value Added and Value Created at Node in the Supply Chain

        3.5.3. List of Raw Material Suppliers

        3.5.4. List of Existing and Potential Buyer’s

    3.6. Investment Feasibility Matrix

    3.7. Value Chain Analysis

        3.7.1. Profit Margin Analysis

        3.7.2. Wholesalers and Distributors

        3.7.3. Retailers

    3.8. PESTLE and Porter’s Analysis

    3.9. Regulatory Landscape

        3.9.1. By Key Regions

        3.9.2. By Key Countries

    3.10. Regional Parent Market Outlook

    3.11. Production and Consumption Statistics

    3.12. Import and Export Statistics

4. Global Analysis 2018 to 2022 and Forecast, 2023 to 2033

    4.1. Historical Market Size Value (US$ Million) & Volume (Tons) Analysis, 2018 to 2022

    4.2. Current and Future Market Size Value (US$ Million) & Volume (Tons) Projections, 2023 to 2033

        4.2.1. Y-o-Y Growth Trend Analysis

        4.2.2. Absolute $ Opportunity Analysis

5. Global Analysis 2018 to 2022 and Forecast 2023 to 2033, By Type

    5.1. Introduction / Key Findings

    5.2. Historical Market Size Value (US$ Million) & Volume (Tons) Analysis By Type, 2018 to 2022

    5.3. Current and Future Market Size Value (US$ Million) & Volume (Tons) Analysis and Forecast By Type, 2023 to 2033

        5.3.1. Modified Starch

        5.3.2. Native Starch

    5.4. Y-o-Y Growth Trend Analysis By Type, 2018 to 2022

    5.5. Absolute $ Opportunity Analysis By Type, 2023 to 2033

6. Global Analysis 2018 to 2022 and Forecast 2023 to 2033, By Source

    6.1. Introduction / Key Findings

    6.2. Historical Market Size Value (US$ Million) & Volume (Tons) Analysis By Source, 2018 to 2022

    6.3. Current and Future Market Size Value (US$ Million) & Volume (Tons) Analysis and Forecast By Source, 2023 to 2033

        6.3.1. Maize

        6.3.2. Wheat

        6.3.3. Potatoes

        6.3.4. Other

    6.4. Y-o-Y Growth Trend Analysis By Source, 2018 to 2022

    6.5. Absolute $ Opportunity Analysis By Source, 2023 to 2033

7. Global Analysis 2018 to 2022 and Forecast 2023 to 2033, By Application

    7.1. Introduction / Key Findings

    7.2. Historical Market Size Value (US$ Million) & Volume (Tons) Analysis By Application, 2018 to 2022

    7.3. Current and Future Market Size Value (US$ Million) & Volume (Tons) Analysis and Forecast By Application, 2023 to 2033

        7.3.1. Animal Feed

        7.3.2. Bakery and Confectionery

        7.3.3. Beverage

        7.3.4. Cosmetics

    7.4. Y-o-Y Growth Trend Analysis By Application, 2018 to 2022

    7.5. Absolute $ Opportunity Analysis By Application, 2023 to 2033

8. Global Analysis 2018 to 2022 and Forecast 2023 to 2033, By Sales Channel

    8.1. Introduction / Key Findings

    8.2. Historical Market Size Value (US$ Million) & Volume (Tons) Analysis By Sales Channel, 2018 to 2022

    8.3. Current and Future Market Size Value (US$ Million) & Volume (Tons) Analysis and Forecast By Sales Channel, 2023 to 2033

        8.3.1. Offline Sales

            8.3.1.1. Supermarkets/Hypermarkets

            8.3.1.2. Departmental Stores

            8.3.1.3. Convenience Store

            8.3.1.4. Other Sales Channel

        8.3.2. Online Sales

            8.3.2.1. Company Website

            8.3.2.2. E-commerce Platform

    8.4. Y-o-Y Growth Trend Analysis By Sales Channel, 2018 to 2022

    8.5. Absolute $ Opportunity Analysis By Sales Channel, 2023 to 2033

9. Global Analysis 2018 to 2022 and Forecast 2023 to 2033, By Region

    9.1. Introduction

    9.2. Historical Market Size Value (US$ Million) & Volume (Tons) Analysis By Region, 2018 to 2022

    9.3. Current Market Size Value (US$ Million) & Volume (Tons) Analysis and Forecast By Region, 2023 to 2033

        9.3.1. North America

        9.3.2. Latin America

        9.3.3. Western Europe

        9.3.4. Eastern Europe

        9.3.5. South Asia and Pacific

        9.3.6. East Asia

        9.3.7. Middle East and Africa

    9.4. Market Attractiveness Analysis By Region

10. North America Analysis 2018 to 2022 and Forecast 2023 to 2033, By Country

    10.1. Historical Market Size Value (US$ Million) & Volume (Tons) Trend Analysis By Market Taxonomy, 2018 to 2022

    10.2. Market Size Value (US$ Million) & Volume (Tons) Forecast By Market Taxonomy, 2023 to 2033

        10.2.1. By Country

            10.2.1.1. USA

            10.2.1.2. Canada

        10.2.2. By Type

        10.2.3. By Source

        10.2.4. By Application

        10.2.5. By Sales Channel

    10.3. Market Attractiveness Analysis

        10.3.1. By Country

        10.3.2. By Type

        10.3.3. By Source

        10.3.4. By Application

        10.3.5. By Sales Channel

    10.4. Key Takeaways

11. Latin America Analysis 2018 to 2022 and Forecast 2023 to 2033, By Country

    11.1. Historical Market Size Value (US$ Million) & Volume (Tons) Trend Analysis By Market Taxonomy, 2018 to 2022

    11.2. Market Size Value (US$ Million) & Volume (Tons) Forecast By Market Taxonomy, 2023 to 2033

        11.2.1. By Country

            11.2.1.1. Brazil

            11.2.1.2. Mexico

            11.2.1.3. Rest of Latin America

        11.2.2. By Type

        11.2.3. By Source

        11.2.4. By Application

        11.2.5. By Sales Channel

    11.3. Market Attractiveness Analysis

        11.3.1. By Country

        11.3.2. By Type

        11.3.3. By Source

        11.3.4. By Application

        11.3.5. By Sales Channel

    11.4. Key Takeaways

12. Western Europe Analysis 2018 to 2022 and Forecast 2023 to 2033, By Country

    12.1. Historical Market Size Value (US$ Million) & Volume (Tons) Trend Analysis By Market Taxonomy, 2018 to 2022

    12.2. Market Size Value (US$ Million) & Volume (Tons) Forecast By Market Taxonomy, 2023 to 2033

        12.2.1. By Country

            12.2.1.1. Germany

            12.2.1.2. UK

            12.2.1.3. France

            12.2.1.4. Spain

            12.2.1.5. Italy

            12.2.1.6. Rest of Western Europe

        12.2.2. By Type

        12.2.3. By Source

        12.2.4. By Application

        12.2.5. By Sales Channel

    12.3. Market Attractiveness Analysis

        12.3.1. By Country

        12.3.2. By Type

        12.3.3. By Source

        12.3.4. By Application

        12.3.5. By Sales Channel

    12.4. Key Takeaways

13. Eastern Europe Analysis 2018 to 2022 and Forecast 2023 to 2033, By Country

    13.1. Historical Market Size Value (US$ Million) & Volume (Tons) Trend Analysis By Market Taxonomy, 2018 to 2022

    13.2. Market Size Value (US$ Million) & Volume (Tons) Forecast By Market Taxonomy, 2023 to 2033

        13.2.1. By Country

            13.2.1.1. Poland

            13.2.1.2. Russia

            13.2.1.3. Czech Republic

            13.2.1.4. Romania

            13.2.1.5. Rest of Eastern Europe

        13.2.2. By Type

        13.2.3. By Source

        13.2.4. By Application

        13.2.5. By Sales Channel

    13.3. Market Attractiveness Analysis

        13.3.1. By Country

        13.3.2. By Type

        13.3.3. By Source

        13.3.4. By Application

        13.3.5. By Sales Channel

    13.4. Key Takeaways

14. South Asia and Pacific Analysis 2018 to 2022 and Forecast 2023 to 2033, By Country

    14.1. Historical Market Size Value (US$ Million) & Volume (Tons) Trend Analysis By Market Taxonomy, 2018 to 2022

    14.2. Market Size Value (US$ Million) & Volume (Tons) Forecast By Market Taxonomy, 2023 to 2033

        14.2.1. By Country

            14.2.1.1. India

            14.2.1.2. Bangladesh

            14.2.1.3. Australia

            14.2.1.4. New Zealand

            14.2.1.5. Rest of South Asia and Pacific

        14.2.2. By Type

        14.2.3. By Source

        14.2.4. By Application

        14.2.5. By Sales Channel

    14.3. Market Attractiveness Analysis

        14.3.1. By Country

        14.3.2. By Type

        14.3.3. By Source

        14.3.4. By Application

        14.3.5. By Sales Channel

    14.4. Key Takeaways

15. East Asia Analysis 2018 to 2022 and Forecast 2023 to 2033, By Country

    15.1. Historical Market Size Value (US$ Million) & Volume (Tons) Trend Analysis By Market Taxonomy, 2018 to 2022

    15.2. Market Size Value (US$ Million) & Volume (Tons) Forecast By Market Taxonomy, 2023 to 2033

        15.2.1. By Country

            15.2.1.1. China

            15.2.1.2. Japan

            15.2.1.3. South Korea

        15.2.2. By Type

        15.2.3. By Source

        15.2.4. By Application

        15.2.5. By Sales Channel

    15.3. Market Attractiveness Analysis

        15.3.1. By Country

        15.3.2. By Type

        15.3.3. By Source

        15.3.4. By Application

        15.3.5. By Sales Channel

    15.4. Key Takeaways

16. Middle East and Africa Analysis 2018 to 2022 and Forecast 2023 to 2033, By Country

    16.1. Historical Market Size Value (US$ Million) & Volume (Tons) Trend Analysis By Market Taxonomy, 2018 to 2022

    16.2. Market Size Value (US$ Million) & Volume (Tons) Forecast By Market Taxonomy, 2023 to 2033

        16.2.1. By Country

            16.2.1.1. GCC Countries

            16.2.1.2. South Africa

            16.2.1.3. Israel

            16.2.1.4. Rest of MEA

        16.2.2. By Type

        16.2.3. By Source

        16.2.4. By Application

        16.2.5. By Sales Channel

    16.3. Market Attractiveness Analysis

        16.3.1. By Country

        16.3.2. By Type

        16.3.3. By Source

        16.3.4. By Application

        16.3.5. By Sales Channel

    16.4. Key Takeaways

17. Key Countries Analysis

    17.1. USA

        17.1.1. Pricing Analysis

        17.1.2. Market Share Analysis, 2022

            17.1.2.1. By Type

            17.1.2.2. By Source

            17.1.2.3. By Application

            17.1.2.4. By Sales Channel

    17.2. Canada

        17.2.1. Pricing Analysis

        17.2.2. Market Share Analysis, 2022

            17.2.2.1. By Type

            17.2.2.2. By Source

            17.2.2.3. By Application

            17.2.2.4. By Sales Channel

    17.3. Brazil

        17.3.1. Pricing Analysis

        17.3.2. Market Share Analysis, 2022

            17.3.2.1. By Type

            17.3.2.2. By Source

            17.3.2.3. By Application

            17.3.2.4. By Sales Channel

    17.4. Mexico

        17.4.1. Pricing Analysis

        17.4.2. Market Share Analysis, 2022

            17.4.2.1. By Type

            17.4.2.2. By Source

            17.4.2.3. By Application

            17.4.2.4. By Sales Channel

    17.5. Germany

        17.5.1. Pricing Analysis

        17.5.2. Market Share Analysis, 2022

            17.5.2.1. By Type

            17.5.2.2. By Source

            17.5.2.3. By Application

            17.5.2.4. By Sales Channel

    17.6. UK

        17.6.1. Pricing Analysis

        17.6.2. Market Share Analysis, 2022

            17.6.2.1. By Type

            17.6.2.2. By Source

            17.6.2.3. By Application

            17.6.2.4. By Sales Channel

    17.7. France

        17.7.1. Pricing Analysis

        17.7.2. Market Share Analysis, 2022

            17.7.2.1. By Type

            17.7.2.2. By Source

            17.7.2.3. By Application

            17.7.2.4. By Sales Channel

    17.8. Spain

        17.8.1. Pricing Analysis

        17.8.2. Market Share Analysis, 2022

            17.8.2.1. By Type

            17.8.2.2. By Source

            17.8.2.3. By Application

            17.8.2.4. By Sales Channel

    17.9. Italy

        17.9.1. Pricing Analysis

        17.9.2. Market Share Analysis, 2022

            17.9.2.1. By Type

            17.9.2.2. By Source

            17.9.2.3. By Application

            17.9.2.4. By Sales Channel

    17.10. Poland

        17.10.1. Pricing Analysis

        17.10.2. Market Share Analysis, 2022

            17.10.2.1. By Type

            17.10.2.2. By Source

            17.10.2.3. By Application

            17.10.2.4. By Sales Channel

    17.11. Russia

        17.11.1. Pricing Analysis

        17.11.2. Market Share Analysis, 2022

            17.11.2.1. By Type

            17.11.2.2. By Source

            17.11.2.3. By Application

            17.11.2.4. By Sales Channel

    17.12. Czech Republic

        17.12.1. Pricing Analysis

        17.12.2. Market Share Analysis, 2022

            17.12.2.1. By Type

            17.12.2.2. By Source

            17.12.2.3. By Application

            17.12.2.4. By Sales Channel

    17.13. Romania

        17.13.1. Pricing Analysis

        17.13.2. Market Share Analysis, 2022

            17.13.2.1. By Type

            17.13.2.2. By Source

            17.13.2.3. By Application

            17.13.2.4. By Sales Channel

    17.14. India

        17.14.1. Pricing Analysis

        17.14.2. Market Share Analysis, 2022

            17.14.2.1. By Type

            17.14.2.2. By Source

            17.14.2.3. By Application

            17.14.2.4. By Sales Channel

    17.15. Bangladesh

        17.15.1. Pricing Analysis

        17.15.2. Market Share Analysis, 2022

            17.15.2.1. By Type

            17.15.2.2. By Source

            17.15.2.3. By Application

            17.15.2.4. By Sales Channel

    17.16. Australia

        17.16.1. Pricing Analysis

        17.16.2. Market Share Analysis, 2022

            17.16.2.1. By Type

            17.16.2.2. By Source

            17.16.2.3. By Application

            17.16.2.4. By Sales Channel

    17.17. New Zealand

        17.17.1. Pricing Analysis

        17.17.2. Market Share Analysis, 2022

            17.17.2.1. By Type

            17.17.2.2. By Source

            17.17.2.3. By Application

            17.17.2.4. By Sales Channel

    17.18. China

        17.18.1. Pricing Analysis

        17.18.2. Market Share Analysis, 2022

            17.18.2.1. By Type

            17.18.2.2. By Source

            17.18.2.3. By Application

            17.18.2.4. By Sales Channel

    17.19. Japan

        17.19.1. Pricing Analysis

        17.19.2. Market Share Analysis, 2022

            17.19.2.1. By Type

            17.19.2.2. By Source

            17.19.2.3. By Application

            17.19.2.4. By Sales Channel

    17.20. South Korea

        17.20.1. Pricing Analysis

        17.20.2. Market Share Analysis, 2022

            17.20.2.1. By Type

            17.20.2.2. By Source

            17.20.2.3. By Application

            17.20.2.4. By Sales Channel

    17.21. GCC Countries

        17.21.1. Pricing Analysis

        17.21.2. Market Share Analysis, 2022

            17.21.2.1. By Type

            17.21.2.2. By Source

            17.21.2.3. By Application

            17.21.2.4. By Sales Channel

    17.22. South Africa

        17.22.1. Pricing Analysis

        17.22.2. Market Share Analysis, 2022

            17.22.2.1. By Type

            17.22.2.2. By Source

            17.22.2.3. By Application

            17.22.2.4. By Sales Channel

    17.23. Israel

        17.23.1. Pricing Analysis

        17.23.2. Market Share Analysis, 2022

            17.23.2.1. By Type

            17.23.2.2. By Source

            17.23.2.3. By Application

            17.23.2.4. By Sales Channel

18. Market Structure Analysis

    18.1. Competition Dashboard

    18.2. Competition Benchmarking

    18.3. Market Share Analysis of Top Players

        18.3.1. By Regional

        18.3.2. By Type

        18.3.3. By Source

        18.3.4. By Application

        18.3.5. By Sales Channel

19. Competition Analysis

    19.1. Competition Deep Dive

        19.1.1. ADM - Archer Daniels Midland

            19.1.1.1. Overview

            19.1.1.2. Product Portfolio

            19.1.1.3. Profitability by Market Segments

            19.1.1.4. Sales Footprint

            19.1.1.5. Strategy Overview

                19.1.1.5.1. Marketing Strategy

                19.1.1.5.2. Product Strategy

                19.1.1.5.3. Channel Strategy

        19.1.2. The Agrana Group

            19.1.2.1. Overview

            19.1.2.2. Product Portfolio

            19.1.2.3. Profitability by Market Segments

            19.1.2.4. Sales Footprint

            19.1.2.5. Strategy Overview

                19.1.2.5.1. Marketing Strategy

                19.1.2.5.2. Product Strategy

                19.1.2.5.3. Channel Strategy

        19.1.3. BENEO

            19.1.3.1. Overview

            19.1.3.2. Product Portfolio

            19.1.3.3. Profitability by Market Segments

            19.1.3.4. Sales Footprint

            19.1.3.5. Strategy Overview

                19.1.3.5.1. Marketing Strategy

                19.1.3.5.2. Product Strategy

                19.1.3.5.3. Channel Strategy

        19.1.4. Roquette Fereres SA

            19.1.4.1. Overview

            19.1.4.2. Product Portfolio

            19.1.4.3. Profitability by Market Segments

            19.1.4.4. Sales Footprint

            19.1.4.5. Strategy Overview

                19.1.4.5.1. Marketing Strategy

                19.1.4.5.2. Product Strategy

                19.1.4.5.3. Channel Strategy

        19.1.5. Grain Processing Corporation

            19.1.5.1. Overview

            19.1.5.2. Product Portfolio

            19.1.5.3. Profitability by Market Segments

            19.1.5.4. Sales Footprint

            19.1.5.5. Strategy Overview

                19.1.5.5.1. Marketing Strategy

                19.1.5.5.2. Product Strategy

                19.1.5.5.3. Channel Strategy

        19.1.6. Royal Avebe U.A

            19.1.6.1. Overview

            19.1.6.2. Product Portfolio

            19.1.6.3. Profitability by Market Segments

            19.1.6.4. Sales Footprint

            19.1.6.5. Strategy Overview

                19.1.6.5.1. Marketing Strategy

                19.1.6.5.2. Product Strategy

                19.1.6.5.3. Channel Strategy

        19.1.7. National Starch Food Innovation

            19.1.7.1. Overview

            19.1.7.2. Product Portfolio

            19.1.7.3. Profitability by Market Segments

            19.1.7.4. Sales Footprint

            19.1.7.5. Strategy Overview

                19.1.7.5.1. Marketing Strategy

                19.1.7.5.2. Product Strategy

                19.1.7.5.3. Channel Strategy

        19.1.8. Cargill Incorporated

            19.1.8.1. Overview

            19.1.8.2. Product Portfolio

            19.1.8.3. Profitability by Market Segments

            19.1.8.4. Sales Footprint

            19.1.8.5. Strategy Overview

                19.1.8.5.1. Marketing Strategy

                19.1.8.5.2. Product Strategy

                19.1.8.5.3. Channel Strategy

        19.1.9. Ingredion Inc.

            19.1.9.1. Overview

            19.1.9.2. Product Portfolio

            19.1.9.3. Profitability by Market Segments

            19.1.9.4. Sales Footprint

            19.1.9.5. Strategy Overview

                19.1.9.5.1. Marketing Strategy

                19.1.9.5.2. Product Strategy

                19.1.9.5.3. Channel Strategy

        19.1.10. Emsland Group

            19.1.10.1. Overview

            19.1.10.2. Product Portfolio

            19.1.10.3. Profitability by Market Segments

            19.1.10.4. Sales Footprint

            19.1.10.5. Strategy Overview

                19.1.10.5.1. Marketing Strategy

                19.1.10.5.2. Product Strategy

                19.1.10.5.3. Channel Strategy

20. Assumptions & Acronyms Used

21. Research Methodology

Don't pay for what you don't need

Customize your report by selecting specific countries or regions and save 30%!

List of Tables

Table 1: Global Value (US$ Million) Forecast by Region, 2018 to 2033

Table 2: Global Volume (Tons) Forecast by Region, 2018 to 2033

Table 3: Global Value (US$ Million) Forecast by Type, 2018 to 2033

Table 4: Global Volume (Tons) Forecast by Type, 2018 to 2033

Table 5: Global Value (US$ Million) Forecast by Source, 2018 to 2033

Table 6: Global Volume (Tons) Forecast by Source, 2018 to 2033

Table 7: Global Value (US$ Million) Forecast by Application, 2018 to 2033

Table 8: Global Volume (Tons) Forecast by Application, 2018 to 2033

Table 9: Global Value (US$ Million) Forecast by Sales Channel, 2018 to 2033

Table 10: Global Volume (Tons) Forecast by Sales Channel, 2018 to 2033

Table 11: North America Value (US$ Million) Forecast by Country, 2018 to 2033

Table 12: North America Volume (Tons) Forecast by Country, 2018 to 2033

Table 13: North America Value (US$ Million) Forecast by Type, 2018 to 2033

Table 14: North America Volume (Tons) Forecast by Type, 2018 to 2033

Table 15: North America Value (US$ Million) Forecast by Source, 2018 to 2033

Table 16: North America Volume (Tons) Forecast by Source, 2018 to 2033

Table 17: North America Value (US$ Million) Forecast by Application, 2018 to 2033

Table 18: North America Volume (Tons) Forecast by Application, 2018 to 2033

Table 19: North America Value (US$ Million) Forecast by Sales Channel, 2018 to 2033

Table 20: North America Volume (Tons) Forecast by Sales Channel, 2018 to 2033

Table 21: Latin America Value (US$ Million) Forecast by Country, 2018 to 2033

Table 22: Latin America Volume (Tons) Forecast by Country, 2018 to 2033

Table 23: Latin America Value (US$ Million) Forecast by Type, 2018 to 2033

Table 24: Latin America Volume (Tons) Forecast by Type, 2018 to 2033

Table 25: Latin America Value (US$ Million) Forecast by Source, 2018 to 2033

Table 26: Latin America Volume (Tons) Forecast by Source, 2018 to 2033

Table 27: Latin America Value (US$ Million) Forecast by Application, 2018 to 2033

Table 28: Latin America Volume (Tons) Forecast by Application, 2018 to 2033

Table 29: Latin America Value (US$ Million) Forecast by Sales Channel, 2018 to 2033

Table 30: Latin America Volume (Tons) Forecast by Sales Channel, 2018 to 2033

Table 31: Western Europe Value (US$ Million) Forecast by Country, 2018 to 2033

Table 32: Western Europe Volume (Tons) Forecast by Country, 2018 to 2033

Table 33: Western Europe Value (US$ Million) Forecast by Type, 2018 to 2033

Table 34: Western Europe Volume (Tons) Forecast by Type, 2018 to 2033

Table 35: Western Europe Value (US$ Million) Forecast by Source, 2018 to 2033

Table 36: Western Europe Volume (Tons) Forecast by Source, 2018 to 2033

Table 37: Western Europe Value (US$ Million) Forecast by Application, 2018 to 2033

Table 38: Western Europe Volume (Tons) Forecast by Application, 2018 to 2033

Table 39: Western Europe Value (US$ Million) Forecast by Sales Channel, 2018 to 2033

Table 40: Western Europe Volume (Tons) Forecast by Sales Channel, 2018 to 2033

Table 41: Eastern Europe Value (US$ Million) Forecast by Country, 2018 to 2033

Table 42: Eastern Europe Volume (Tons) Forecast by Country, 2018 to 2033

Table 43: Eastern Europe Value (US$ Million) Forecast by Type, 2018 to 2033

Table 44: Eastern Europe Volume (Tons) Forecast by Type, 2018 to 2033

Table 45: Eastern Europe Value (US$ Million) Forecast by Source, 2018 to 2033

Table 46: Eastern Europe Volume (Tons) Forecast by Source, 2018 to 2033

Table 47: Eastern Europe Value (US$ Million) Forecast by Application, 2018 to 2033

Table 48: Eastern Europe Volume (Tons) Forecast by Application, 2018 to 2033

Table 49: Eastern Europe Value (US$ Million) Forecast by Sales Channel, 2018 to 2033

Table 50: Eastern Europe Volume (Tons) Forecast by Sales Channel, 2018 to 2033

Table 51: South Asia and Pacific Value (US$ Million) Forecast by Country, 2018 to 2033

Table 52: South Asia and Pacific Volume (Tons) Forecast by Country, 2018 to 2033

Table 53: South Asia and Pacific Value (US$ Million) Forecast by Type, 2018 to 2033

Table 54: South Asia and Pacific Volume (Tons) Forecast by Type, 2018 to 2033

Table 55: South Asia and Pacific Value (US$ Million) Forecast by Source, 2018 to 2033

Table 56: South Asia and Pacific Volume (Tons) Forecast by Source, 2018 to 2033

Table 57: South Asia and Pacific Value (US$ Million) Forecast by Application, 2018 to 2033

Table 58: South Asia and Pacific Volume (Tons) Forecast by Application, 2018 to 2033

Table 59: South Asia and Pacific Value (US$ Million) Forecast by Sales Channel, 2018 to 2033

Table 60: South Asia and Pacific Volume (Tons) Forecast by Sales Channel, 2018 to 2033

Table 61: East Asia Value (US$ Million) Forecast by Country, 2018 to 2033

Table 62: East Asia Volume (Tons) Forecast by Country, 2018 to 2033

Table 63: East Asia Value (US$ Million) Forecast by Type, 2018 to 2033

Table 64: East Asia Volume (Tons) Forecast by Type, 2018 to 2033

Table 65: East Asia Value (US$ Million) Forecast by Source, 2018 to 2033

Table 66: East Asia Volume (Tons) Forecast by Source, 2018 to 2033

Table 67: East Asia Value (US$ Million) Forecast by Application, 2018 to 2033

Table 68: East Asia Volume (Tons) Forecast by Application, 2018 to 2033

Table 69: East Asia Value (US$ Million) Forecast by Sales Channel, 2018 to 2033

Table 70: East Asia Volume (Tons) Forecast by Sales Channel, 2018 to 2033

Table 71: Middle East and Africa Value (US$ Million) Forecast by Country, 2018 to 2033

Table 72: Middle East and Africa Volume (Tons) Forecast by Country, 2018 to 2033

Table 73: Middle East and Africa Value (US$ Million) Forecast by Type, 2018 to 2033

Table 74: Middle East and Africa Volume (Tons) Forecast by Type, 2018 to 2033

Table 75: Middle East and Africa Value (US$ Million) Forecast by Source, 2018 to 2033

Table 76: Middle East and Africa Volume (Tons) Forecast by Source, 2018 to 2033

Table 77: Middle East and Africa Value (US$ Million) Forecast by Application, 2018 to 2033

Table 78: Middle East and Africa Volume (Tons) Forecast by Application, 2018 to 2033

Table 79: Middle East and Africa Value (US$ Million) Forecast by Sales Channel, 2018 to 2033

Table 80: Middle East and Africa Volume (Tons) Forecast by Sales Channel, 2018 to 2033
Nandini Roy Choudhury

Principal Consultant

Talk to Analyst

Find your sweet spots for generating winning opportunities in this market.

List of Charts

Figure 1: Global Value (US$ Million) by Type, 2023 to 2033

Figure 2: Global Value (US$ Million) by Source, 2023 to 2033

Figure 3: Global Value (US$ Million) by Application, 2023 to 2033

Figure 4: Global Value (US$ Million) by Sales Channel, 2023 to 2033

Figure 5: Global Value (US$ Million) by Region, 2023 to 2033

Figure 6: Global Value (US$ Million) Analysis by Region, 2018 to 2033

Figure 7: Global Volume (Tons) Analysis by Region, 2018 to 2033

Figure 8: Global Value Share (%) and BPS Analysis by Region, 2023 to 2033

Figure 9: Global Y-o-Y Growth (%) Projections by Region, 2023 to 2033

Figure 10: Global Value (US$ Million) Analysis by Type, 2018 to 2033

Figure 11: Global Volume (Tons) Analysis by Type, 2018 to 2033

Figure 12: Global Value Share (%) and BPS Analysis by Type, 2023 to 2033

Figure 13: Global Y-o-Y Growth (%) Projections by Type, 2023 to 2033

Figure 14: Global Value (US$ Million) Analysis by Source, 2018 to 2033

Figure 15: Global Volume (Tons) Analysis by Source, 2018 to 2033

Figure 16: Global Value Share (%) and BPS Analysis by Source, 2023 to 2033

Figure 17: Global Y-o-Y Growth (%) Projections by Source, 2023 to 2033

Figure 18: Global Value (US$ Million) Analysis by Application, 2018 to 2033

Figure 19: Global Volume (Tons) Analysis by Application, 2018 to 2033

Figure 20: Global Value Share (%) and BPS Analysis by Application, 2023 to 2033

Figure 21: Global Y-o-Y Growth (%) Projections by Application, 2023 to 2033

Figure 22: Global Value (US$ Million) Analysis by Sales Channel, 2018 to 2033

Figure 23: Global Volume (Tons) Analysis by Sales Channel, 2018 to 2033

Figure 24: Global Value Share (%) and BPS Analysis by Sales Channel, 2023 to 2033

Figure 25: Global Y-o-Y Growth (%) Projections by Sales Channel, 2023 to 2033

Figure 26: Global Attractiveness by Type, 2023 to 2033

Figure 27: Global Attractiveness by Source, 2023 to 2033

Figure 28: Global Attractiveness by Application, 2023 to 2033

Figure 29: Global Attractiveness by Sales Channel, 2023 to 2033

Figure 30: Global Attractiveness by Region, 2023 to 2033

Figure 31: North America Value (US$ Million) by Type, 2023 to 2033

Figure 32: North America Value (US$ Million) by Source, 2023 to 2033

Figure 33: North America Value (US$ Million) by Application, 2023 to 2033

Figure 34: North America Value (US$ Million) by Sales Channel, 2023 to 2033

Figure 35: North America Value (US$ Million) by Country, 2023 to 2033

Figure 36: North America Value (US$ Million) Analysis by Country, 2018 to 2033

Figure 37: North America Volume (Tons) Analysis by Country, 2018 to 2033

Figure 38: North America Value Share (%) and BPS Analysis by Country, 2023 to 2033

Figure 39: North America Y-o-Y Growth (%) Projections by Country, 2023 to 2033

Figure 40: North America Value (US$ Million) Analysis by Type, 2018 to 2033

Figure 41: North America Volume (Tons) Analysis by Type, 2018 to 2033

Figure 42: North America Value Share (%) and BPS Analysis by Type, 2023 to 2033

Figure 43: North America Y-o-Y Growth (%) Projections by Type, 2023 to 2033

Figure 44: North America Value (US$ Million) Analysis by Source, 2018 to 2033

Figure 45: North America Volume (Tons) Analysis by Source, 2018 to 2033

Figure 46: North America Value Share (%) and BPS Analysis by Source, 2023 to 2033

Figure 47: North America Y-o-Y Growth (%) Projections by Source, 2023 to 2033

Figure 48: North America Value (US$ Million) Analysis by Application, 2018 to 2033

Figure 49: North America Volume (Tons) Analysis by Application, 2018 to 2033

Figure 50: North America Value Share (%) and BPS Analysis by Application, 2023 to 2033

Figure 51: North America Y-o-Y Growth (%) Projections by Application, 2023 to 2033

Figure 52: North America Value (US$ Million) Analysis by Sales Channel, 2018 to 2033

Figure 53: North America Volume (Tons) Analysis by Sales Channel, 2018 to 2033

Figure 54: North America Value Share (%) and BPS Analysis by Sales Channel, 2023 to 2033

Figure 55: North America Y-o-Y Growth (%) Projections by Sales Channel, 2023 to 2033

Figure 56: North America Attractiveness by Type, 2023 to 2033

Figure 57: North America Attractiveness by Source, 2023 to 2033

Figure 58: North America Attractiveness by Application, 2023 to 2033

Figure 59: North America Attractiveness by Sales Channel, 2023 to 2033

Figure 60: North America Attractiveness by Country, 2023 to 2033

Figure 61: Latin America Value (US$ Million) by Type, 2023 to 2033

Figure 62: Latin America Value (US$ Million) by Source, 2023 to 2033

Figure 63: Latin America Value (US$ Million) by Application, 2023 to 2033

Figure 64: Latin America Value (US$ Million) by Sales Channel, 2023 to 2033

Figure 65: Latin America Value (US$ Million) by Country, 2023 to 2033

Figure 66: Latin America Value (US$ Million) Analysis by Country, 2018 to 2033

Figure 67: Latin America Volume (Tons) Analysis by Country, 2018 to 2033

Figure 68: Latin America Value Share (%) and BPS Analysis by Country, 2023 to 2033

Figure 69: Latin America Y-o-Y Growth (%) Projections by Country, 2023 to 2033

Figure 70: Latin America Value (US$ Million) Analysis by Type, 2018 to 2033

Figure 71: Latin America Volume (Tons) Analysis by Type, 2018 to 2033

Figure 72: Latin America Value Share (%) and BPS Analysis by Type, 2023 to 2033

Figure 73: Latin America Y-o-Y Growth (%) Projections by Type, 2023 to 2033

Figure 74: Latin America Value (US$ Million) Analysis by Source, 2018 to 2033

Figure 75: Latin America Volume (Tons) Analysis by Source, 2018 to 2033

Figure 76: Latin America Value Share (%) and BPS Analysis by Source, 2023 to 2033

Figure 77: Latin America Y-o-Y Growth (%) Projections by Source, 2023 to 2033

Figure 78: Latin America Value (US$ Million) Analysis by Application, 2018 to 2033

Figure 79: Latin America Volume (Tons) Analysis by Application, 2018 to 2033

Figure 80: Latin America Value Share (%) and BPS Analysis by Application, 2023 to 2033

Figure 81: Latin America Y-o-Y Growth (%) Projections by Application, 2023 to 2033

Figure 82: Latin America Value (US$ Million) Analysis by Sales Channel, 2018 to 2033

Figure 83: Latin America Volume (Tons) Analysis by Sales Channel, 2018 to 2033

Figure 84: Latin America Value Share (%) and BPS Analysis by Sales Channel, 2023 to 2033

Figure 85: Latin America Y-o-Y Growth (%) Projections by Sales Channel, 2023 to 2033

Figure 86: Latin America Attractiveness by Type, 2023 to 2033

Figure 87: Latin America Attractiveness by Source, 2023 to 2033

Figure 88: Latin America Attractiveness by Application, 2023 to 2033

Figure 89: Latin America Attractiveness by Sales Channel, 2023 to 2033

Figure 90: Latin America Attractiveness by Country, 2023 to 2033

Figure 91: Western Europe Value (US$ Million) by Type, 2023 to 2033

Figure 92: Western Europe Value (US$ Million) by Source, 2023 to 2033

Figure 93: Western Europe Value (US$ Million) by Application, 2023 to 2033

Figure 94: Western Europe Value (US$ Million) by Sales Channel, 2023 to 2033

Figure 95: Western Europe Value (US$ Million) by Country, 2023 to 2033

Figure 96: Western Europe Value (US$ Million) Analysis by Country, 2018 to 2033

Figure 97: Western Europe Volume (Tons) Analysis by Country, 2018 to 2033

Figure 98: Western Europe Value Share (%) and BPS Analysis by Country, 2023 to 2033

Figure 99: Western Europe Y-o-Y Growth (%) Projections by Country, 2023 to 2033

Figure 100: Western Europe Value (US$ Million) Analysis by Type, 2018 to 2033

Figure 101: Western Europe Volume (Tons) Analysis by Type, 2018 to 2033

Figure 102: Western Europe Value Share (%) and BPS Analysis by Type, 2023 to 2033

Figure 103: Western Europe Y-o-Y Growth (%) Projections by Type, 2023 to 2033

Figure 104: Western Europe Value (US$ Million) Analysis by Source, 2018 to 2033

Figure 105: Western Europe Volume (Tons) Analysis by Source, 2018 to 2033

Figure 106: Western Europe Value Share (%) and BPS Analysis by Source, 2023 to 2033

Figure 107: Western Europe Y-o-Y Growth (%) Projections by Source, 2023 to 2033

Figure 108: Western Europe Value (US$ Million) Analysis by Application, 2018 to 2033

Figure 109: Western Europe Volume (Tons) Analysis by Application, 2018 to 2033

Figure 110: Western Europe Value Share (%) and BPS Analysis by Application, 2023 to 2033

Figure 111: Western Europe Y-o-Y Growth (%) Projections by Application, 2023 to 2033

Figure 112: Western Europe Value (US$ Million) Analysis by Sales Channel, 2018 to 2033

Figure 113: Western Europe Volume (Tons) Analysis by Sales Channel, 2018 to 2033

Figure 114: Western Europe Value Share (%) and BPS Analysis by Sales Channel, 2023 to 2033

Figure 115: Western Europe Y-o-Y Growth (%) Projections by Sales Channel, 2023 to 2033

Figure 116: Western Europe Attractiveness by Type, 2023 to 2033

Figure 117: Western Europe Attractiveness by Source, 2023 to 2033

Figure 118: Western Europe Attractiveness by Application, 2023 to 2033

Figure 119: Western Europe Attractiveness by Sales Channel, 2023 to 2033

Figure 120: Western Europe Attractiveness by Country, 2023 to 2033

Figure 121: Eastern Europe Value (US$ Million) by Type, 2023 to 2033

Figure 122: Eastern Europe Value (US$ Million) by Source, 2023 to 2033

Figure 123: Eastern Europe Value (US$ Million) by Application, 2023 to 2033

Figure 124: Eastern Europe Value (US$ Million) by Sales Channel, 2023 to 2033

Figure 125: Eastern Europe Value (US$ Million) by Country, 2023 to 2033

Figure 126: Eastern Europe Value (US$ Million) Analysis by Country, 2018 to 2033

Figure 127: Eastern Europe Volume (Tons) Analysis by Country, 2018 to 2033

Figure 128: Eastern Europe Value Share (%) and BPS Analysis by Country, 2023 to 2033

Figure 129: Eastern Europe Y-o-Y Growth (%) Projections by Country, 2023 to 2033

Figure 130: Eastern Europe Value (US$ Million) Analysis by Type, 2018 to 2033

Figure 131: Eastern Europe Volume (Tons) Analysis by Type, 2018 to 2033

Figure 132: Eastern Europe Value Share (%) and BPS Analysis by Type, 2023 to 2033

Figure 133: Eastern Europe Y-o-Y Growth (%) Projections by Type, 2023 to 2033

Figure 134: Eastern Europe Value (US$ Million) Analysis by Source, 2018 to 2033

Figure 135: Eastern Europe Volume (Tons) Analysis by Source, 2018 to 2033

Figure 136: Eastern Europe Value Share (%) and BPS Analysis by Source, 2023 to 2033

Figure 137: Eastern Europe Y-o-Y Growth (%) Projections by Source, 2023 to 2033

Figure 138: Eastern Europe Value (US$ Million) Analysis by Application, 2018 to 2033

Figure 139: Eastern Europe Volume (Tons) Analysis by Application, 2018 to 2033

Figure 140: Eastern Europe Value Share (%) and BPS Analysis by Application, 2023 to 2033

Figure 141: Eastern Europe Y-o-Y Growth (%) Projections by Application, 2023 to 2033

Figure 142: Eastern Europe Value (US$ Million) Analysis by Sales Channel, 2018 to 2033

Figure 143: Eastern Europe Volume (Tons) Analysis by Sales Channel, 2018 to 2033

Figure 144: Eastern Europe Value Share (%) and BPS Analysis by Sales Channel, 2023 to 2033

Figure 145: Eastern Europe Y-o-Y Growth (%) Projections by Sales Channel, 2023 to 2033

Figure 146: Eastern Europe Attractiveness by Type, 2023 to 2033

Figure 147: Eastern Europe Attractiveness by Source, 2023 to 2033

Figure 148: Eastern Europe Attractiveness by Application, 2023 to 2033

Figure 149: Eastern Europe Attractiveness by Sales Channel, 2023 to 2033

Figure 150: Eastern Europe Attractiveness by Country, 2023 to 2033

Figure 151: South Asia and Pacific Value (US$ Million) by Type, 2023 to 2033

Figure 152: South Asia and Pacific Value (US$ Million) by Source, 2023 to 2033

Figure 153: South Asia and Pacific Value (US$ Million) by Application, 2023 to 2033

Figure 154: South Asia and Pacific Value (US$ Million) by Sales Channel, 2023 to 2033

Figure 155: South Asia and Pacific Value (US$ Million) by Country, 2023 to 2033

Figure 156: South Asia and Pacific Value (US$ Million) Analysis by Country, 2018 to 2033

Figure 157: South Asia and Pacific Volume (Tons) Analysis by Country, 2018 to 2033

Figure 158: South Asia and Pacific Value Share (%) and BPS Analysis by Country, 2023 to 2033

Figure 159: South Asia and Pacific Y-o-Y Growth (%) Projections by Country, 2023 to 2033

Figure 160: South Asia and Pacific Value (US$ Million) Analysis by Type, 2018 to 2033

Figure 161: South Asia and Pacific Volume (Tons) Analysis by Type, 2018 to 2033

Figure 162: South Asia and Pacific Value Share (%) and BPS Analysis by Type, 2023 to 2033

Figure 163: South Asia and Pacific Y-o-Y Growth (%) Projections by Type, 2023 to 2033

Figure 164: South Asia and Pacific Value (US$ Million) Analysis by Source, 2018 to 2033

Figure 165: South Asia and Pacific Volume (Tons) Analysis by Source, 2018 to 2033

Figure 166: South Asia and Pacific Value Share (%) and BPS Analysis by Source, 2023 to 2033

Figure 167: South Asia and Pacific Y-o-Y Growth (%) Projections by Source, 2023 to 2033

Figure 168: South Asia and Pacific Value (US$ Million) Analysis by Application, 2018 to 2033

Figure 169: South Asia and Pacific Volume (Tons) Analysis by Application, 2018 to 2033

Figure 170: South Asia and Pacific Value Share (%) and BPS Analysis by Application, 2023 to 2033

Figure 171: South Asia and Pacific Y-o-Y Growth (%) Projections by Application, 2023 to 2033

Figure 172: South Asia and Pacific Value (US$ Million) Analysis by Sales Channel, 2018 to 2033

Figure 173: South Asia and Pacific Volume (Tons) Analysis by Sales Channel, 2018 to 2033

Figure 174: South Asia and Pacific Value Share (%) and BPS Analysis by Sales Channel, 2023 to 2033

Figure 175: South Asia and Pacific Y-o-Y Growth (%) Projections by Sales Channel, 2023 to 2033

Figure 176: South Asia and Pacific Attractiveness by Type, 2023 to 2033

Figure 177: South Asia and Pacific Attractiveness by Source, 2023 to 2033

Figure 178: South Asia and Pacific Attractiveness by Application, 2023 to 2033

Figure 179: South Asia and Pacific Attractiveness by Sales Channel, 2023 to 2033

Figure 180: South Asia and Pacific Attractiveness by Country, 2023 to 2033

Figure 181: East Asia Value (US$ Million) by Type, 2023 to 2033

Figure 182: East Asia Value (US$ Million) by Source, 2023 to 2033

Figure 183: East Asia Value (US$ Million) by Application, 2023 to 2033

Figure 184: East Asia Value (US$ Million) by Sales Channel, 2023 to 2033

Figure 185: East Asia Value (US$ Million) by Country, 2023 to 2033

Figure 186: East Asia Value (US$ Million) Analysis by Country, 2018 to 2033

Figure 187: East Asia Volume (Tons) Analysis by Country, 2018 to 2033

Figure 188: East Asia Value Share (%) and BPS Analysis by Country, 2023 to 2033

Figure 189: East Asia Y-o-Y Growth (%) Projections by Country, 2023 to 2033

Figure 190: East Asia Value (US$ Million) Analysis by Type, 2018 to 2033

Figure 191: East Asia Volume (Tons) Analysis by Type, 2018 to 2033

Figure 192: East Asia Value Share (%) and BPS Analysis by Type, 2023 to 2033

Figure 193: East Asia Y-o-Y Growth (%) Projections by Type, 2023 to 2033

Figure 194: East Asia Value (US$ Million) Analysis by Source, 2018 to 2033

Figure 195: East Asia Volume (Tons) Analysis by Source, 2018 to 2033

Figure 196: East Asia Value Share (%) and BPS Analysis by Source, 2023 to 2033

Figure 197: East Asia Y-o-Y Growth (%) Projections by Source, 2023 to 2033

Figure 198: East Asia Value (US$ Million) Analysis by Application, 2018 to 2033

Figure 199: East Asia Volume (Tons) Analysis by Application, 2018 to 2033

Figure 200: East Asia Value Share (%) and BPS Analysis by Application, 2023 to 2033

Figure 201: East Asia Y-o-Y Growth (%) Projections by Application, 2023 to 2033

Figure 202: East Asia Value (US$ Million) Analysis by Sales Channel, 2018 to 2033

Figure 203: East Asia Volume (Tons) Analysis by Sales Channel, 2018 to 2033

Figure 204: East Asia Value Share (%) and BPS Analysis by Sales Channel, 2023 to 2033

Figure 205: East Asia Y-o-Y Growth (%) Projections by Sales Channel, 2023 to 2033

Figure 206: East Asia Attractiveness by Type, 2023 to 2033

Figure 207: East Asia Attractiveness by Source, 2023 to 2033

Figure 208: East Asia Attractiveness by Application, 2023 to 2033

Figure 209: East Asia Attractiveness by Sales Channel, 2023 to 2033

Figure 210: East Asia Attractiveness by Country, 2023 to 2033

Figure 211: Middle East and Africa Value (US$ Million) by Type, 2023 to 2033

Figure 212: Middle East and Africa Value (US$ Million) by Source, 2023 to 2033

Figure 213: Middle East and Africa Value (US$ Million) by Application, 2023 to 2033

Figure 214: Middle East and Africa Value (US$ Million) by Sales Channel, 2023 to 2033

Figure 215: Middle East and Africa Value (US$ Million) by Country, 2023 to 2033

Figure 216: Middle East and Africa Value (US$ Million) Analysis by Country, 2018 to 2033

Figure 217: Middle East and Africa Volume (Tons) Analysis by Country, 2018 to 2033

Figure 218: Middle East and Africa Value Share (%) and BPS Analysis by Country, 2023 to 2033

Figure 219: Middle East and Africa Y-o-Y Growth (%) Projections by Country, 2023 to 2033

Figure 220: Middle East and Africa Value (US$ Million) Analysis by Type, 2018 to 2033

Figure 221: Middle East and Africa Volume (Tons) Analysis by Type, 2018 to 2033

Figure 222: Middle East and Africa Value Share (%) and BPS Analysis by Type, 2023 to 2033

Figure 223: Middle East and Africa Y-o-Y Growth (%) Projections by Type, 2023 to 2033

Figure 224: Middle East and Africa Value (US$ Million) Analysis by Source, 2018 to 2033

Figure 225: Middle East and Africa Volume (Tons) Analysis by Source, 2018 to 2033

Figure 226: Middle East and Africa Value Share (%) and BPS Analysis by Source, 2023 to 2033

Figure 227: Middle East and Africa Y-o-Y Growth (%) Projections by Source, 2023 to 2033

Figure 228: Middle East and Africa Value (US$ Million) Analysis by Application, 2018 to 2033

Figure 229: Middle East and Africa Volume (Tons) Analysis by Application, 2018 to 2033

Figure 230: Middle East and Africa Value Share (%) and BPS Analysis by Application, 2023 to 2033

Figure 231: Middle East and Africa Y-o-Y Growth (%) Projections by Application, 2023 to 2033

Figure 232: Middle East and Africa Value (US$ Million) Analysis by Sales Channel, 2018 to 2033

Figure 233: Middle East and Africa Volume (Tons) Analysis by Sales Channel, 2018 to 2033

Figure 234: Middle East and Africa Value Share (%) and BPS Analysis by Sales Channel, 2023 to 2033

Figure 235: Middle East and Africa Y-o-Y Growth (%) Projections by Sales Channel, 2023 to 2033

Figure 236: Middle East and Africa Attractiveness by Type, 2023 to 2033

Figure 237: Middle East and Africa Attractiveness by Source, 2023 to 2033

Figure 238: Middle East and Africa Attractiveness by Application, 2023 to 2033

Figure 239: Middle East and Africa Attractiveness by Sales Channel, 2023 to 2033

Figure 240: Middle East and Africa Attractiveness by Country, 2023 to 2033

Recommendations

Food and Beverage

Food Additive Market

Published : January 2024

Food and Beverage

Bakery Ingredient Market

Published : October 2023

Explore Food and Beverage Insights

View Reports