The food certification market is projected to grow from USD 12.2 billion in 2025 to USD 32.8 billion by 2035, registering a strong CAGR of 10.4%. Growth is driven by rising global demand for verified food safety systems, expanding international trade requirements, and increasing retailer-mandated certifications across supply chains. Food processors, exporters, and large retailers now rely on certification as a compliance, risk-reduction, and brand-protection mechanism. ISO 22000 remains the leading certification type with a 33.0% share, reflecting its global recognition, ease of integration with existing management systems, and universal applicability across food categories.
Meat & poultry products represent the largest application segment at 36.0%, supported by the sector’s high microbiological risk, strict regulatory oversight, and export-driven need for third-party verification. Dairy, beverages, bakery, and packaged foods also show rising adoption as traceability, allergen control, and hygiene compliance become central to food safety programs. Technology advancements—including blockchain traceability, digital audits, and real-time monitoring—are accelerating certification efficiency and adoption across multi-site food operations.
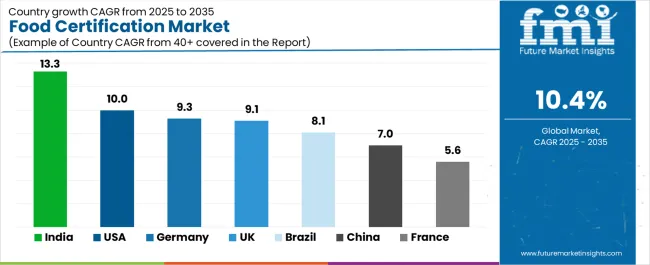
Regionally, India leads growth at 13.3% CAGR, driven by export expansion and rapid modernization of processing facilities. The USA (10.0%), Germany (9.3%), and the UK (9.1%) maintain strong demand due to stringent regulatory environments and retailer requirements. China and Brazil show steady adoption linked to export competitiveness and domestic food quality reforms. Market leadership remains consolidated among global certifiers such as SGS, Intertek, Bureau Veritas, Eurofins, and DEKRA, which differentiate through audit quality, global reach, and multi-standard certification portfolios.
Demand growth is also driven by a surge in foodborne illness concerns, stricter international food safety standards, and the globalization of supply chains. As food travels longer distances and passes through multiple intermediaries, the risk of contamination, adulteration, and fraud increases significantly. Certification systems such as ISO 22000, HACCP, BRCGS, FSSC, HALAL, KOSHER, and organic standards help companies establish uniform quality frameworks and enable international buyers to trust unfamiliar suppliers. Many economies, particularly in Asia and the Middle East, are strengthening national food control systems, which further accelerates adoption across domestic producers seeking compliance for both local and export markets.
E-commerce growth adds another layer of complexity, with consumers ordering a wider range of perishable and specialty foods directly from producers. This expansion heightens the need for storage, handling, and transport certifications that ensure cold chain integrity and minimize risk during last-mile delivery. Meanwhile, the rise of plant-based foods, nutraceuticals, functional beverages, and clean-label products is creating new certification needs related to organic validation, GMO-free claims, allergen control, and nutritional authenticity. Companies are increasingly relying on certification agencies to validate claims that influence consumer purchasing decisions.
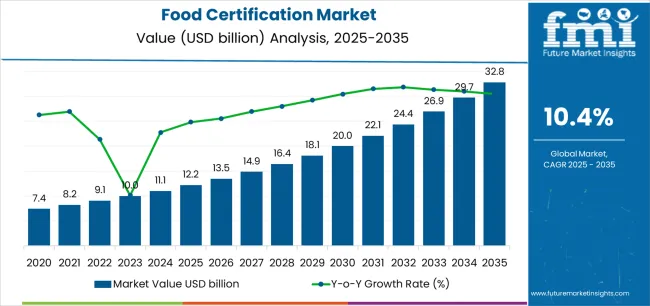
The Food Certification market demonstrates distinct growth phases with varying market characteristics and competitive dynamics. Between 2025 and 2030, the market progresses through its compliance adoption phase, expanding from USD 12.2 billion to USD 20.0 billion with steady annual increments averaging 10.4% growth. This period showcases the transition from basic food safety standards to advanced certification platforms with enhanced traceability capabilities and integrated audit workflow systems becoming mainstream features.
The 2025 to 2030 phase adds USD 7.8 billion to market value, representing 37.9% of total decade expansion. Market maturation factors include standardization of international food safety protocols, declining certification costs for food businesses, and increasing consumer awareness of food safety certifications, reaching 92-95% recognition in developed markets.
Competitive landscape evolution during this period features established certification bodies like SGS and Intertek expanding their food safety portfolios while new entrants focus on specialized audit technologies and enhanced digital verification capabilities.
From 2030 to 2035, market dynamics shift toward advanced integration and multi-standard deployment, with growth accelerating from USD 20.0 billion to USD 32.8 billion, adding USD 12.8 billion or 62.1% of total expansion.
This phase transition logic centers on comprehensive certification platforms, integration with supply chain management systems, and deployment across diverse food industry specialties, becoming standard rather than specialized applications. The competitive environment matures with focus shifting from basic compliance capability to comprehensive food safety ecosystems and integration with automated monitoring and quality management platforms.
The market demonstrates strong fundamentals with ISO 22000 capturing a dominant share through comprehensive food safety management features and cost-effective implementation capabilities. Meat & Poultry Products applications drive primary demand, supported by increasing food processor spending on safety compliance tools and quality assurance systems.
Geographic expansion remains concentrated in developed markets with established regulatory infrastructure, while emerging economies show accelerating adoption rates driven by food export requirements and rising food safety budgets.
At-a-Glance Metrics
| Metric | Value |
|---|---|
| Market Value (2025) | USD 12.2 billion |
| Market Forecast (2035) | USD 32.8 billion |
| Growth Rate | 10.4% CAGR |
| Leading Certification Type | ISO 22000 |
| Primary Application | Meat & Poultry Products |
The global food certification market is expanding rapidly, driven by regulatory transformation, international trade requirements, retailer mandates, consumer awareness, technology adoption, and supply chain complexity. Regulatory frameworks such as the USA FSMA, EU General Food Law, and China’s Food Safety Law have shifted food safety from reactive to preventive, mandating documented systems where certification provides compliance assurance and regulatory goodwill.
In international trade, certification has become a passport for market access, with schemes like BRC, IFS, HACCP, and FSSC 22000 required for entry into key export markets. Retailers including Walmart, Tesco, and Carrefour mandate GFSI-benchmarked certifications, cascading requirements through suppliers and distributors.
Rising consumer concern over safety and authenticity elevates certifications like organic, halal, kosher, and non-GMO from compliance tools to marketing assets enabling premium pricing and brand protection. Technology further enhances certification value, with blockchain, IoT, AI, and digital audits enabling real-time traceability and efficiency.
Certification also supports ESG and sustainability reporting, broadening its role beyond safety. However, adoption is constrained by high costs, complexity of overlapping schemes, documentation burdens, and audit quality variation, particularly challenging for SMEs. Despite these headwinds, certification is evolving into strategic infrastructure for food businesses, underpinning trust, trade, and competitiveness.
The food certification market represents a transformative growth opportunity, expanding from USD 12.2 billion in 2025 to USD 32.8 billion by 2035 at a 10.4% CAGR. As food systems worldwide prioritize safety assurance, regulatory compliance, and supply chain transparency, certification programs have evolved from optional credentials to mission-critical requirements, enabling market access, reducing liability exposure, and supporting operational excellence across meat processing, dairy production, packaged food manufacturing, and beverage operations.
The convergence of stricter food safety regulations, increasing retailer certification requirements, consumer safety awareness maturation, and international trade standardization creates unprecedented adoption momentum. Advanced certification schemes offering comprehensive coverage, seamless audit integration, and regulatory acceptance will capture premium market positioning, while geographic expansion into emerging food markets and scalable certification deployment will drive volume leadership. Government food safety modernization programs and international harmonization initiatives provide structural support.
The Food Certification market exhibits remarkable diversity across multiple segmentation dimensions, each reflecting distinct market dynamics, customer requirements, and competitive landscapes. Understanding these segments provides critical insights into market evolution, growth opportunities, and strategic positioning for certification bodies, food businesses, and technology providers.
The food certification landscape covers a wide spectrum, ranging from management system standards like ISO 22000 and FSSC 22000 to retailer-driven schemes such as BRC and IFS, which are essential for European retail market access. HACCP remains foundational for hazard control, while Global GAP addresses farm-level practices. Specialty certifications including Organic, Kosher, and Halal serve niche consumer demands while also signaling quality to broader markets. Together, these schemes illustrate the progression from basic safety to integrated, market-driven certifications.
Certification adoption varies significantly across food applications, with meat and poultry products and infant food leading due to their high-risk nature, regulatory scrutiny, and zero-tolerance for safety failures. Dairy products, beverages, and bakery & confectionery sectors face challenges such as contamination control, allergen management, and process integrity. Processed and packaged foods represent diverse certification needs driven by product complexity and retailer requirements. Across categories, certification provides structured risk management, brand protection, and market access, making it essential for both industrial and consumer-facing producers.
Certification penetration differs by geography, with developed markets like North America and Europe showing dense adoption, often with multiple schemes per facility. These regions reflect regulatory maturity, consumer awareness, and retailer-driven requirements. Emerging economies in Asia-Pacific, Latin America, and the Middle East & Africa demonstrate rapid growth, fueled by export ambitions and food safety modernization programs. Export-oriented producers in Brazil, India, and Southeast Asia are increasingly adopting international certifications, transforming certification into a strategic necessity for global trade participation and competitiveness.
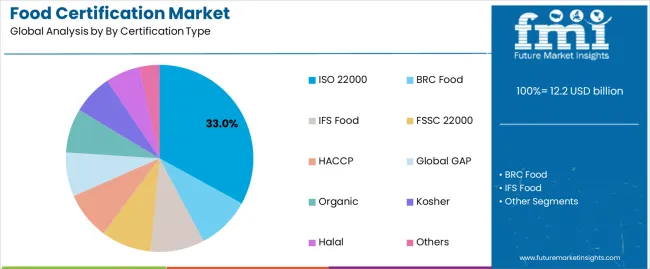
Market Position: ISO 22000 commands the leading position in the Food Certification market with approximately 33.0% market share through comprehensive food safety management system features, including hazard analysis integration, prerequisite program requirements, and systematic approach to food safety that enable food businesses to deploy internationally recognized certification across diverse operational environments without significant regulatory complications. The standard's development by the International Organization for Standardization ensures broad stakeholder input and global recognition, creating universal acceptance across markets, regulatory jurisdictions, and supply chain partners.
Value Drivers: The segment benefits from food business preference for internationally harmonized standards that provide global market access without requiring multiple certifications or redundant audit protocols. ISO 22000 design features enable deployment across entire food chains, from primary production through processing to distribution, where systematic safety management and regulatory compliance represent critical operational requirements. The standard's structure aligns with ISO 9001 quality management systems, enabling integrated implementation that leverages existing quality infrastructure while adding food safety specificity. This integration efficiency reduces implementation costs and complexity compared to standalone food safety programs.
Competitive Advantages: ISO 22000 differentiates through established international recognition spanning all regions and market sectors, proven compliance effectiveness demonstrated through two decades of implementation across thousands of facilities, and integration capabilities with quality systems (ISO 9001), environmental management (ISO 14001), and occupational health and safety (ISO 45001) that enhance safety effectiveness while maintaining cost-effective operational profiles suitable for food businesses of all sizes.
Certification bodies worldwide offer ISO 22000 audits, creating competitive marketplace that controls costs and ensures availability across remote locations and specialized sectors. This extensive certification infrastructure contrasts with some proprietary schemes where certification body selection is limited, potentially creating availability constraints or monopolistic pricing. The competition among ISO 22000 certification providers benefits food businesses through competitive pricing, scheduling flexibility, and service quality pressure that maintains audit professionalism.
Key market characteristics:
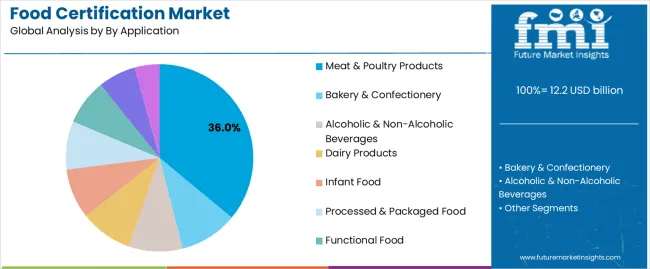
Market Context: Meat & Poultry Products applications dominate the Food Certification market with approximately 36.0% market share due to critical food safety requirements and increasing focus on pathogen control, traceability systems, and regulatory compliance applications that optimize food safety while maintaining processing effectiveness.
Appeal Factors: Meat processors prioritize certification credibility, audit rigor, and regulatory acceptance that enables market access to major retailers and international markets. The segment benefits from substantial food safety budgets and compliance investments that emphasize comprehensive certification acquisition for reduced liability exposure and enhanced consumer confidence.
Growth Drivers: Foodborne illness prevention programs incorporate meat certification as essential components for pathogen control and safety assurance applications. Simultaneously, increasing retailer requirements are driving demand for third-party certifications that meet food safety standards and minimize supply chain risks.
Market Challenges: Certification costs and operational burden may limit adoption among smaller meat processors or in certain regional markets with less developed food safety infrastructure.
Application dynamics include:
Growth Accelerators: Regulatory enforcement drives primary adoption as certification systems provide compliance documentation that enables market access without regulatory penalties, supporting operational decision-making and safety missions that require systematic hazard management. The demand for export market access accelerates market expansion as food exporters seek internationally recognized certifications that meet import country requirements while maintaining operational effectiveness during complex international trade procedures and customs clearance scenarios. Food safety incidents worldwide create sustained demand for third-party certification that complements internal quality systems and provides independent verification in complex food supply chains.
Growth Inhibitors: Certification cost challenges vary across food businesses regarding the implementation of comprehensive standards and annual audit fees, which may limit operational flexibility and market penetration in regions with smaller food processors. Documentation burden persists regarding record-keeping requirements and audit preparation that may reduce efficiency with resource-constrained operations, limited technical staff, or complex multi-site operations that strain compliance capabilities. Market fragmentation across multiple certification schemes creates confusion among food businesses regarding optimal certification selection and recognition across different markets.
Market Evolution Patterns: Adoption accelerates in export-oriented and retail supply sectors where market access justifies certification costs, with geographic concentration in developed markets transitioning toward mainstream adoption in emerging economies driven by food safety modernization and international trade development. Technology development focuses on digital audit platforms, blockchain traceability integration, and remote verification capabilities that optimize compliance workflow and operational effectiveness. The market could face disruption if regulatory harmonization significantly reduces certification diversity or if major retailers develop proprietary standards that bypass third-party certification requirements.
| Country | CAGR (2025-2035) |
|---|---|
| India | 13.3% |
| USA | 10% |
| Germany | 9.3% |
| UK | 9.1% |
| Brazil | 8.1% |
| China | 7% |
| France | 5.6% |
The food certification market demonstrates varied regional dynamics with Growth Leaders including India (13.3% CAGR) and USA (10.0% CAGR) driving expansion through food safety modernization and export market development.
Steady Performers encompass Germany (9.3% CAGR), UK (9.1% CAGR), and Brazil (8.1% CAGR), benefiting from established food industries and regulatory compliance maturation. Mature Markets feature China (7.0% CAGR) and France (5.6% CAGR), where established certification infrastructure and comprehensive regulatory frameworks support consistent growth patterns.
Regional synthesis reveals South Asian markets leading growth through food export expansion and safety infrastructure development, while European countries maintain steady expansion supported by regulatory evolution and EU food safety harmonization requirements. North American markets show robust growth driven by food safety modernization and retailer certification requirements.
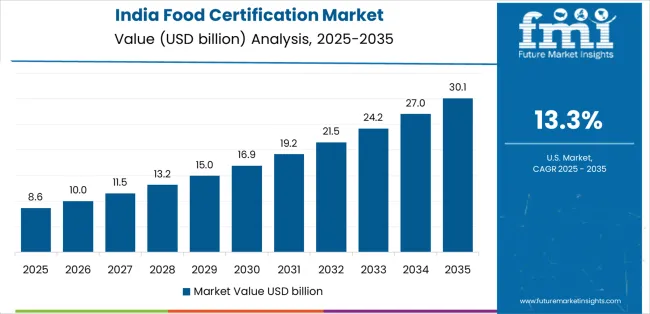
India establishes market leadership through aggressive food export promotion programs and comprehensive food safety infrastructure development, integrating internationally recognized certifications as essential components for accessing European, Middle Eastern, and North American markets.
The country's 13.3% CAGR through 2035 reflects government initiatives promoting food safety excellence through Food Safety and Standards Authority of India (FSSAI) programs and export promotion schemes that mandate certification for food businesses. Growth concentrates in major food processing clusters, including Maharashtra, Gujarat, and Tamil Nadu, where food manufacturers pursue certifications to access international markets and organized retail channels.
Indian food businesses are implementing comprehensive certification programs that combine international standards like ISO 22000 and FSSC 22000 with domestic compliance, creating market opportunities for certification bodies offering cost-effective audit services and technical support. Distribution channels through industry associations, government export promotion agencies, and consultant networks expand market access, while government subsidies for certification costs support adoption across diverse food processing segments.
Strategic Market Indicators:
The USA market emphasizes comprehensive food safety certification aligned with FDA Food Safety Modernization Act (FSMA) requirements, with food businesses implementing certifications that demonstrate preventive control capabilities and supply chain verification.
The country is projected to show a 10.0% CAGR through 2035, driven by regulatory enforcement expansion and retailer certification requirements that mandate third-party audits for supplier qualification. American food manufacturers prioritize certifications recognized by major retailers including Walmart, Costco, and major supermarket chains, creating demand for GFSI-recognized schemes like SQF, BRC, and FSSC 22000.
Technology deployment channels include major food safety consulting firms, certification bodies with national coverage, and industry association programs supporting certification implementation. Integration capabilities with food safety software platforms and supply chain management systems expand market appeal across diverse food sectors seeking operational efficiency and regulatory compliance benefits.
Performance Metrics:
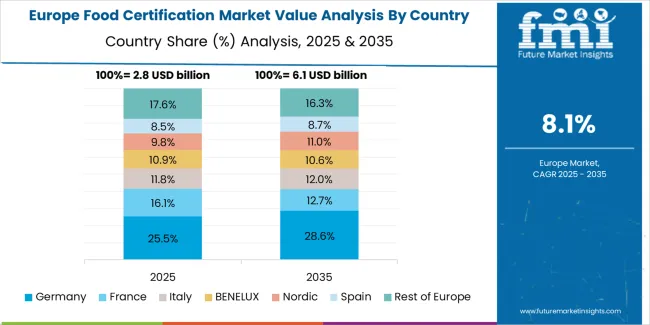
Germany's advanced food industry demonstrates sophisticated certification deployment with documented safety effectiveness across food manufacturing and retail supply chains through integration with existing quality management and regulatory compliance systems. The country leverages engineering precision and systematic approaches to maintain a 9.3% CAGR through 2035.
Food manufacturing centers, including Bavaria, North Rhine-Westphalia, and Baden-Württemberg, showcase comprehensive certification coverage where multiple standards integrate with food safety culture and operational excellence to optimize compliance effectiveness and supply chain credibility.
German food businesses prioritize IFS Food certification given its European retail recognition, while also implementing ISO 22000 and organic certifications based on market positioning. The market benefits from established food technology infrastructure and willingness to invest in comprehensive certification that provides long-term brand protection and regulatory compliance assurance.
Market Intelligence Brief:
In London, Manchester, and major food manufacturing regions, British food producers implement BRC Food certification to meet retailer supplier requirements and support product listing with major supermarket chains including Tesco, Sainsbury's, and ASDA.
The UK market is expected to demonstrate sustained growth with a 9.1% CAGR through 2035, driven by stringent retailer standards and food safety regulatory modernization that emphasize third-party certification for supply chain assurance. British food facilities prioritize certifications that provide efficient audit consolidation while maintaining compliance with UK food safety regulations, particularly important given post-Brexit regulatory framework development.
Market expansion benefits from established certification infrastructure and industry familiarity with third-party audit requirements, creating sustained demand across the UK's diverse food sectors where retailer market access and export capability represent critical requirements. The regulatory framework supports certification adoption through official recognition of GFSI schemes and alignment between regulatory inspection and third-party audit protocols.
Strategic Market Indicators:
Brazil's market expansion benefits from diverse agricultural production and food processing including beef, poultry, sugar, coffee, and fruit products that increasingly target international markets requiring certification. The country maintains an 8.1% CAGR through 2035, driven by export market opportunities and increasing domestic retailer requirements for supplier certification.
Market dynamics focus on export-enabling certifications that balance international recognition with cost-effectiveness for Brazilian food producers. Growing organized retail creates sustained demand for certified suppliers in domestic markets alongside traditional export market drivers.
Strategic Market Considerations:
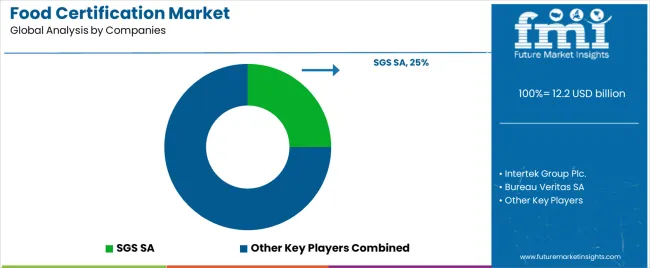
The food certification market features 10–15 players with moderate concentration, where the top three companies collectively hold around 48–54% of global market share, driven by strong auditing capabilities, global accreditation networks, and long-standing relationships with food manufacturers, retailers, and regulatory bodies. The leading company, SGS SA, commands 25% market share, supported by its extensive testing, inspection, and certification infrastructure across more than 100 countries. Competition centers on audit expertise, certification scope, global coverage, turnaround speed, and regulatory credibility rather than price alone.
Market leaders such as SGS SA, Intertek Group Plc., and Bureau Veritas SA maintain dominant positions through comprehensive portfolios covering ISO standards, HACCP, GMP, GlobalG.A.P., BRCGS, FSSC 22000, and organic certifications. Their strengths lie in multisite auditing capabilities, digital audit platforms, strong regulatory alignment, and the ability to support multinational food companies with harmonized global programs.
Challenger companies including Eurofins Scientific SE, DEKRA SE, and NSF International focus on specialized food testing and certification solutions, emphasizing microbiological testing, allergen verification, and tailored certification programs for niche food categories.
Additional competition arises from regional and specialized players such as LRQA, TÜV SÜD, DNV, ALS Limited, AsureQuality, and SAI Global, which strengthen their market presence with localized expertise, strong ties to domestic regulatory frameworks, and flexible certification services tailored to regional food producers.
| Item | Value |
|---|---|
| Quantitative Units | USD 12.2 billion |
| Certification Type | ISO 22000, BRC Food, IFS Food, FSSC 22000, HACCP, Global GAP, Organic, Kosher, Halal, Others |
| Application | Meat & Poultry Products, Bakery & Confectionery, Alcoholic & Non-Alcoholic Beverages, Dairy Products, Infant Food, Processed & Packaged Food, Functional Food, Seafood, Others |
| Regions Covered | North America, Europe, Asia Pacific (South Asia, East Asia, Oceania), Latin America, Middle East & Africa |
| Countries Covered | USA, India, Germany, UK, Brazil, China, France, and 25+ additional countries |
| Key Companies Profiled | SGS SA, Intertek Group Plc., Bureau Veritas SA, Eurofins Scientific SE, DEKRA SE, NSF International, LRQA, TÜV SÜD, DNV, ALS Limited, AsureQuality, and SAI Global |
| Additional Attributes | Dollar sales by certification type and application categories, regional certification density across North America, Europe, and Asia Pacific, competitive landscape with global and regional certification bodies, food business preferences for scheme recognition and audit quality, integration with regulatory compliance and supply chain management, innovations in digital audit platforms and blockchain traceability, and development of harmonized standards with enhanced verification capabilities. |
The global food certification market is estimated to be valued at USD 12.2 billion in 2025.
The market size for the food certification market is projected to reach USD 32.8 billion by 2035.
The food certification market is expected to grow at a 10.4% CAGR between 2025 and 2035.
The key product types in food certification market are iso 22000, brc food, ifs food, fssc 22000, haccp, global gap, organic, kosher, halal and others.
In terms of by application, meat & poultry products segment to command 36.0% share in the food certification market in 2025.


Our Research Products

The "Full Research Suite" delivers actionable market intel, deep dives on markets or technologies, so clients act faster, cut risk, and unlock growth.

The Leaderboard benchmarks and ranks top vendors, classifying them as Established Leaders, Leading Challengers, or Disruptors & Challengers.

Locates where complements amplify value and substitutes erode it, forecasting net impact by horizon

We deliver granular, decision-grade intel: market sizing, 5-year forecasts, pricing, adoption, usage, revenue, and operational KPIs—plus competitor tracking, regulation, and value chains—across 60 countries broadly.

Spot the shifts before they hit your P&L. We track inflection points, adoption curves, pricing moves, and ecosystem plays to show where demand is heading, why it is changing, and what to do next across high-growth markets and disruptive tech

Real-time reads of user behavior. We track shifting priorities, perceptions of today’s and next-gen services, and provider experience, then pace how fast tech moves from trial to adoption, blending buyer, consumer, and channel inputs with social signals (#WhySwitch, #UX).

Partner with our analyst team to build a custom report designed around your business priorities. From analysing market trends to assessing competitors or crafting bespoke datasets, we tailor insights to your needs.
Supplier Intelligence
Discovery & Profiling
Capacity & Footprint
Performance & Risk
Compliance & Governance
Commercial Readiness
Who Supplies Whom
Scorecards & Shortlists
Playbooks & Docs
Category Intelligence
Definition & Scope
Demand & Use Cases
Cost Drivers
Market Structure
Supply Chain Map
Trade & Policy
Operating Norms
Deliverables
Buyer Intelligence
Account Basics
Spend & Scope
Procurement Model
Vendor Requirements
Terms & Policies
Entry Strategy
Pain Points & Triggers
Outputs
Pricing Analysis
Benchmarks
Trends
Should-Cost
Indexation
Landed Cost
Commercial Terms
Deliverables
Brand Analysis
Positioning & Value Prop
Share & Presence
Customer Evidence
Go-to-Market
Digital & Reputation
Compliance & Trust
KPIs & Gaps
Outputs
Full Research Suite comprises of:
Market outlook & trends analysis
Interviews & case studies
Strategic recommendations
Vendor profiles & capabilities analysis
5-year forecasts
8 regions and 60+ country-level data splits
Market segment data splits
12 months of continuous data updates
DELIVERED AS:
PDF EXCEL ONLINE
Food & Beverage OEE Software Market Size and Share Forecast Outlook 2025 to 2035
Food Grade Crosslinked Polyvinylpolypyrrolidone (PVPP) Market Size and Share Forecast Outlook 2025 to 2035
Food Grade Cassia Gum Powder Market Size and Share Forecast Outlook 2025 to 2035
Food Grade Dry Film Lubricant Market Size and Share Forecast Outlook 2025 to 2035
Foodservice Equipment Market Analysis - Size, Share, and Forecast Outlook 2025 to 2035
Food Basket Market Forecast and Outlook 2025 to 2035
Food Grade Tremella Polysaccharide Market Size and Share Forecast Outlook 2025 to 2035
Food Sorting Machine Market Size and Share Forecast Outlook 2025 to 2035
Foodservice Paper Bag Market Size and Share Forecast Outlook 2025 to 2035
Food Stabilizers Market Size and Share Forecast Outlook 2025 to 2035
Food Packaging Film Market Size and Share Forecast Outlook 2025 to 2035
Food Tray Market Size and Share Forecast Outlook 2025 to 2035
Food & Beverage Industrial Disinfection and Cleaning Market Size and Share Forecast Outlook 2025 to 2035
Food Technology Market Size and Share Forecast Outlook 2025 to 2035
Food Tourism Sector Market Size and Share Forecast Outlook 2025 to 2035
Food Processing Boiler Market Size and Share Forecast Outlook 2025 to 2035
Food Packaging Machines Market Size and Share Forecast Outlook 2025 to 2035
Food Minerals Market Size and Share Forecast Outlook 2025 to 2035
Food And Beverage Chemicals Market Size and Share Forecast Outlook 2025 to 2035
Food and Beverage Industry Software Market Size and Share Forecast Outlook 2025 to 2035

Thank you!
You will receive an email from our Business Development Manager. Please be sure to check your SPAM/JUNK folder too.
Chat With
MaRIA