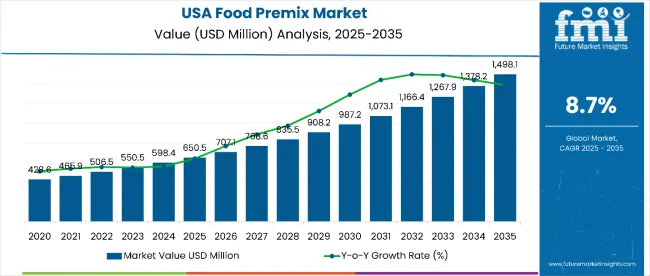
The USA food premix market is estimated to be valued at USD 650.5 million in 2025 and is projected to reach USD 1,498.1 million by 2035, registering a CAGR of 8.7% over the forecast period. The USA food premix market is projected to add an absolute dollar opportunity of 847.6 million over the forecast period.

| Metric | Value |
|---|---|
| USA Food Premix Market Estimated Value in (2025E) | USD 650.5 million |
| USA Food Premix Market Forecast Value in (2035F) | USD 1498.1 million |
| Forecast CAGR (2025 to 2035) | 8.7% |
This reflects 2.13 times growth at a compound annual growth rate of 8.7%. The market’s evolution is expected to be shaped by rising demand for fortified foods, increasing health consciousness, and expanding applications in dietary supplements and functional nutrition.
By 2030, the market is likely to reach approximately USD 1,050 million, accounting for USD 330 million in incremental value over the first half of the decade. The remaining USD 480 million is expected during the second half, suggesting a moderately back-loaded growth pattern. Product adoption is gaining traction due to food premixes’ convenience, cost-effectiveness, and ability to address micronutrient deficiencies through fortification programs.
Companies such as Glanbia plc, Prinova, and Archer Daniels Midland Company are advancing their competitive positions through investment in customized formulation technologies and plant-based alternatives. Health-focused consumer preferences are supporting expansion into sports nutrition, baby food, and pharmaceutical OTC applications. Market performance is expected to remain anchored in regulatory compliance, ingredient quality, and innovative formulation capabilities.
The USA food premix market holds approximately 52% of the North American food premix market, driven by the country's well-established food processing industry, strong regulatory framework, and advanced nutritional awareness among consumers. It accounts for around 38% of the global functional food ingredients market, supported by its leadership in dietary supplements, sports nutrition, and infant formula applications.
The market contributes nearly 44% to the USA fortified foods market, particularly for bread, cereals, and dairy product fortification. It holds close to 31% of the USA nutraceutical ingredients market, where food premixes are valued for their standardized nutrient delivery and quality consistency. The share in the USA specialty food ingredients market reaches about 29%, reflecting its critical role in addressing micronutrient deficiencies and supporting preventive healthcare.
The market is undergoing structural change driven by rising demand for clean-label and plant-based formulations. Advanced manufacturing methods, including spray-drying, encapsulation, and micro-encapsulation technologies, have enhanced product stability and bioavailability.
Manufacturers are introducing organic, non-GMO, and allergen-free formulations tailored for specific demographic groups including infants, elderly, and athletes, expanding their role beyond traditional fortification applications. Strategic collaborations between ingredient suppliers and food manufacturers have accelerated innovation in functional foods. Direct-to-consumer channels and e-commerce platforms have widened market access for specialized premix products.
The market is segmented by form, ingredient type, application, and function. By form, it includes powder and liquid. Based on ingredient type, the market is divided into vitamins, minerals, amino acids, and nucleotides. Based on application, the segmentation covers food & beverages (medical nutrition, fortified dairy & beverages, bakery products, sports nutrition), dietary supplements, early life nutrition/baby food, pharma OTC drugs, and nutritional improvement programs.
In terms of function, the market addresses bone health, immunity, digestion, energy, heart health, weight management, vision health, and brain health & memory applications.

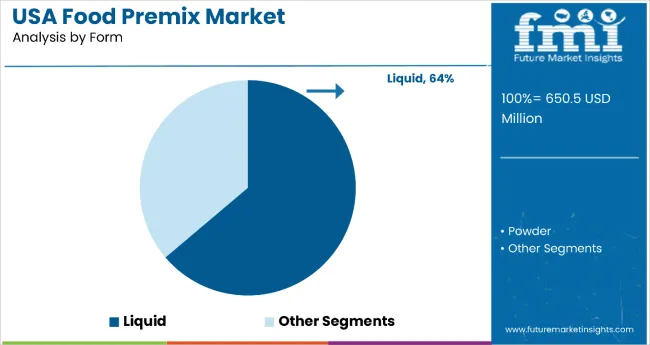
The liquid form segment leads the form category with 64% of the market share, driven by its superior solubility, ease of integration in manufacturing lines, and faster absorption in end-use applications. Liquid food premixes are increasingly used in beverage fortification, clinical nutrition, and functional shots, where uniform dispersion and bioavailability are critical.
Manufacturers value liquid formats for their ability to deliver multiple nutrients in a single dose, simplify blending operations, and reduce processing time. The format also supports innovation in ready-to-drink formulations and customizable health solutions.
As demand for convenient, on-the-go nutrition products and high-performance beverages continues to rise, liquid premixes are gaining preference in both retail and institutional sectors. Ongoing advancements in emulsion stability, flavor masking, and nutrient retention are further accelerating the segment’s growth trajectory.

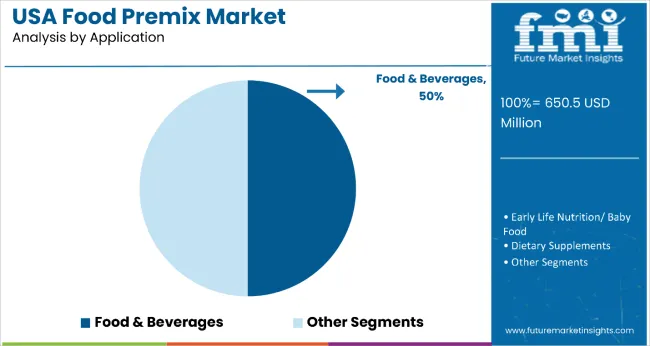
The food & beverages segment dominates the application category with 50% of the market share, fueled by rising consumer demand for functional foods and fortified beverages that support immunity, energy, and overall wellness. Food premixes are widely used in dairy products, snacks, meal replacements, and RTD beverages to deliver consistent nutrient profiles and enhance product value.
Manufacturers leverage premixes to streamline formulation, meet regulatory standards, and ensure accurate micronutrient dosing across large-scale production. The application’s versatility spans both health-centric and indulgent product categories, including plant-based beverages, flavored milk, and nutrient-enriched snacks.
As consumers increasingly seek food options with added health benefits, food and beverage applications of premixes are expected to see continued expansion. This trend is supported by clean-label movement, lifestyle-driven nutrition preferences, and growing interest in preventive dietary solutions.
Food premixes’ ability to provide precise, standardized nutrient fortification while simplifying manufacturing processes makes them highly attractive to food manufacturers seeking to meet FDA nutritional labeling requirements and consumer health demands.
Growing awareness of micronutrient deficiencies and the rising prevalence of lifestyle-related diseases are further propelling adoption, especially in dietary supplements, functional foods, and infant nutrition applications. Increasing consumer preference for convenient, nutritionally enhanced products and government initiatives supporting food fortification are also enhancing market penetration.
As food manufacturers seek cost-effective solutions to improve nutritional profiles while maintaining taste and shelf stability, the market outlook remains favorable. With expanding applications in sports nutrition, medical nutrition, and plant-based alternatives, along with growing consumer willingness to pay premium prices for health-focused products, food premixes are well-positioned to capture sustained demand across diverse food and beverage categories.
From 2025 to 2035, health-conscious consumers are expected to adopt fortified foods and dietary supplements containing standardized premix formulations to address micronutrient deficiencies and support preventive healthcare goals. This shift positions food premix manufacturers offering high-quality, science-based formulations as key beneficiaries of the growing functional foods and wellness trends.
Rising Micronutrient Deficiency Awareness Drives USA Food Premix Market Growth
The growing recognition of widespread micronutrient deficiencies among the USA population has been identified as the primary catalyst for growth in the USA food premix market. In 2024, health authorities highlighted that approximately 70% of elderly Americans have vitamin D deficiency, while 90% have suboptimal vitamin D levels, leading food manufacturers and supplement companies to increase fortification efforts using standardized premix formulations.
These developments indicate that evidence-based nutritional intervention, rather than marketing trends, is fueling market expansion. Manufacturers providing scientifically formulated, regulatory-compliant premixes with demonstrated bioavailability are therefore well-positioned to capture growing demand from health-focused consumers and institutional buyers.
Plant-Based Formulation Innovation Creates Market Opportunities
In 2024, food premix manufacturers began developing sophisticated plant-based alternatives to address the growing vegan consumer segment and allergen concerns associated with traditional animal-derived ingredients. Companies like Prinova launched new plant premixes for dairy alternatives, while others developed fungal and algae-based vitamin sources to replace conventional synthetic vitamins.
These implementations demonstrate that when sustainable sourcing practices are combined with maintained nutritional efficacy, both market accessibility and consumer acceptance are significantly enhanced. Manufacturers that invest in plant-based formulation capabilities and clean-label positioning are positioned to capture expanding opportunities in the rapidly growing plant-based food and supplement markets.

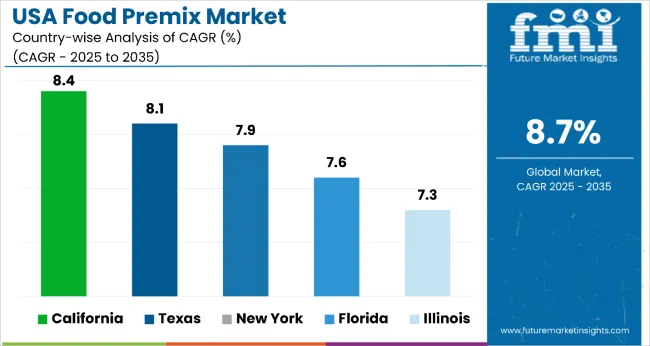
| State | CAGR |
|---|---|
| California | 8.4% |
| Texas | 8.1% |
| New York | 7.9% |
| Florida | 7.6% |
| Illinois | 7.3% |
The USA food premix market is projected to grow at a CAGR of 7.8% between 2025 and 2035. California leads with 8.4%, exceeding the national average by 0.6 percentage points, fueled by its dominant food manufacturing sector and health-forward innovation ecosystem. Texas follows at 8.1% (+0.3 pp), driven by its strong food processing base, sports nutrition culture, and Hispanic demographic influence.
New York posts a 7.9% CAGR (+0.1 pp), supported by its premium food market, diverse consumer base, and established nutraceutical industry. Florida records 7.6% (-0.2 pp), reflecting rising demand from its aging population and tourism-driven wellness sector. Illinois rounds out the top five with 7.3% (-0.5 pp), leveraging its ingredient processing hub and central logistics advantage.
The revenue from food premixes in California is forecast to grow at a CAGR of 8.4% from 2025 to 2035, the highest among USA states. Growth is driven by the state's 6,569 food manufacturing establishments and its innovation-driven consumer market, especially in functional beverages and health-focused products.
California's wellness-focused culture, along with demand for clean label and organic formulations, is increasing adoption of advanced premix solutions. Beverage innovation and nutraceutical applications remain key to expansion.
Key Statistics:
The USA food premix market in Texas is set to grow at a CAGR of 8.1% between 2025 and 2035, fueled by a robust food processing base and culturally diverse nutrition preferences. With 2,898 food manufacturing facilities and a large Hispanic population, Texas leads in demand for dietary supplements and ethnic nutrition blends. Innovation in sports nutrition and family-focused premixes is shaping market expansion.
Key Statistics:
The food premix market in New York is expected to expand at a CAGR of 7.9% from 2025 to 2035. Growth is attributed to a well-established supplement industry, high-value nutrition demand, and demographic diversity in cities like New York City and Buffalo. The state's food tech ecosystem supports innovation in age-specific and condition-focused premix formulations.
Key Statistics:
Florida’s food premix market is projected to grow at a CAGR of 7.6% from 2025 to 2035. The state’s large elderly population and booming tourism sector are increasing demand for wellness-oriented and on-the-go fortified foods. Hospitality-focused consumption and functional supplement applications are expanding, especially in cognitive and bone health premixes.
Key Statistics:
The Illinois food premix market is anticipated to grow at a CAGR of 7.3% between 2025 and 2035. Positioned as a food ingredient and distribution hub, the state benefits from centralized logistics and food tech R&D capabilities. Chicago leads innovation in scalable premix formulations for wellness and clinical nutrition.
Key Statistics:
The USA food premix market is moderately consolidated, led by Glanbia plc with a 14.2% market share. The company holds a dominant position through its integrated nutritional solutions portfolio, advanced manufacturing capabilities, and strong customer relationships across multiple food industry segments.
Leading player status is held by Glanbia plc. Key players include Prinova, Archer Daniels Midland Company, Cargill Incorporated, General Mills, Watson Inc., Austrade Inc., Farbest Brands, Danone, Bunge Limited, Fenchem Biotek Ltd., Corbion N.V., Jubilant Life Sciences, SternVitamin GmbH, and LycoRed Ltd., each offering specialized premix formulations including vitamin, mineral, and functional ingredient blends, supported by regulatory expertise, quality certifications, and customization capabilities.
Emerging players are entering through innovative formulations and specialized applications, though established suppliers maintain advantages through regulatory compliance and scale economies. Market demand is driven by rising health consciousness, micronutrient deficiency awareness, food fortification requirements, and expanding applications in functional foods and dietary supplements.
Key Developments in USA Food Premix Market
Manufacturers are advancing plant-based formulations, customized nutrition solutions, and enhanced bioavailability technologies for improved nutritional outcomes and market differentiation. Leading players are investing in regulatory science, quality assurance programs, and sustainable sourcing initiatives to meet growing demand from health-conscious consumers, food manufacturers, and institutional nutrition programs.
| Item | Value |
|---|---|
| Quantitative Units | USD 650.5 million |
| Form | Powder and Liquid |
| Ingredient Type | Vitamins, Minerals, Amino Acids, and Nucleotides |
| Application | Dietary Supplements, Food & Beverages, Early Life Nutrition/Baby Food, Pharma OTC Drugs, and Nutritional Improvement Programs |
| Function | Bone Health, Immunity, Digestion, Energy, Heart Health, Weight Management, Vision Health, and Brain Health & Memory |
| States Covered | California, Texas, New York, Florida, Illinois |
| Key Companies Profiled | Glanbia plc, Prinova, Archer Daniels Midland Company, Cargill Incorporated, General Mills, Watson Inc., Austrade Inc., Farbest Brands, Danone, Bunge Limited, Fenchem Biotek Ltd., Corbion N.V., Jubilant Life Sciences, SternVitamin GmbH, LycoRed Ltd. |
| Additional Attributes | Dollar sales by form and application sector, growing usage in dietary supplements and fortified food applications for health-conscious consumers, stable demand in infant nutrition and pharmaceutical applications, innovations in plant-based formulations and bioavailability enhancement improve efficacy, sustainability, and market accessibility |
The USA food premix market is estimated to be valued at USD 650.5 million in 2025.
The market size for the USA food premix market is projected to reach USD 1498.1 million by 2035.
The USA food premix market is expected to grow at a 8.7% CAGR between 2025 and 2035.
The key form types in USA food premix market are powder and liquid formulations.
In terms of application, food and beverages segment to command 50% share in the USA food premix market in 2025.


Full Research Suite comprises of:
Market outlook & trends analysis
Interviews & case studies
Strategic recommendations
Vendor profiles & capabilities analysis
5-year forecasts
8 regions and 60+ country-level data splits
Market segment data splits
12 months of continuous data updates
DELIVERED AS:
PDF EXCEL ONLINE
Food & Beverage OEE Software Market Size and Share Forecast Outlook 2025 to 2035
Food Grade Cassia Gum Powder Market Size and Share Forecast Outlook 2025 to 2035
Food Grade Dry Film Lubricant Market Size and Share Forecast Outlook 2025 to 2035
Foodservice Equipment Market Analysis - Size, Share, and Forecast Outlook 2025 to 2035
Food Basket Market Forecast and Outlook 2025 to 2035
Food Grade Tremella Polysaccharide Market Size and Share Forecast Outlook 2025 to 2035
Foodservice Paper Bag Market Size and Share Forecast Outlook 2025 to 2035
Food Stabilizers Market Size and Share Forecast Outlook 2025 to 2035
Food Certification Market Size and Share Forecast Outlook 2025 to 2035
Food Tray Market Size and Share Forecast Outlook 2025 to 2035
Food Technology Market Size and Share Forecast Outlook 2025 to 2035
Food Tourism Sector Market Size and Share Forecast Outlook 2025 to 2035
Food And Beverage Chemicals Market Size and Share Forecast Outlook 2025 to 2035
Food Antioxidant Market Size and Share Forecast Outlook 2025 to 2035
Food Emulsifiers Market Analysis - Size, Share, and Forecast Outlook 2025 to 2035
Food Grade Solvent Market Analysis - Size and Share Forecast Outlook 2025 to 2035
Food Dietary Fibers Market Size and Share Forecast Outlook 2025 to 2035
Food Traceability Market Size and Share Forecast Outlook 2025 to 2035
Food Processor Market Size and Share Forecast Outlook 2025 to 2035
Food Flavor Enhancer Market Size and Share Forecast Outlook 2025 to 2035

Thank you!
You will receive an email from our Business Development Manager. Please be sure to check your SPAM/JUNK folder too.
Chat With
MaRIA