Reports

- Global Locations -

Headquarters

Future Market Insights, Inc.

Christiana Corporate, 200
Continental Drive, Suite 401,
Newark, Delaware - 19713,
United States

T: +1-845-579-5705

Americas

Future Market Insights, Inc.

616 Corporate Way, Suite 2-9018,
Valley Cottage, NY 10989, United States

T: +1-347-918-3531

MEA

Future Market Insights

1602-6 Jumeirah Bay X2 Tower, Plot No: JLT-PH2-X2A,
Jumeirah Lakes Towers, Dubai,
United Arab Emirates

Europe

Future Market Insights

3rd Floor, 207 Regent Street,
W1B 3HH London
United Kingdom

T: + 44 (0) 20 8123 9659
D: +44 (0) 20 3287 4268

Asia Pacific

Future Market Insights

IndiaLand Global Tech Park, Unit UG-1, Behind Grand HighStreet, Phase 1, Hinjawadi, MH, Pune – 411057, India

Food Tourism Sector Market Outlook (2023 to 2033)

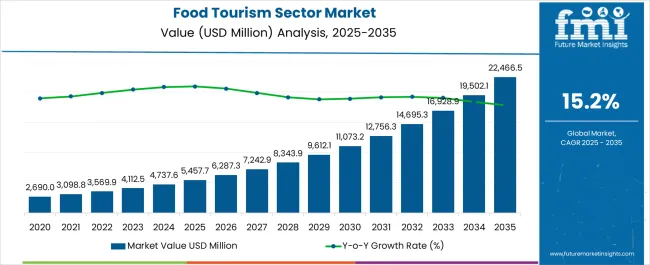
The food tourism market is expected to be US$ 999,033.40 million in 2023 and US$ 4,112,489.40 million by 2033. The food tourism sector industry is to develop at a CAGR of 15.20% from 2023 to 2033.

With increased demand from travelers seeking unique culinary experiences, the food tourism sector is witnessing a strong market outlook. Consumers increasingly appreciate authentic local cuisine and are eager to visit new places to satisfy their gastronomic interests.

This trend has increased the number of food-focused travel firms, culinary tours, cooking workshops, and food festivals. Social media platforms and online reviews have helped to promote food tourism by allowing travelers to share their experiences and recommendations.

As more destinations see the economic potential of their local culinary offerings and engage in infrastructure and marketing initiatives to attract food-loving tourists, the food tourism sector industry may continue to grow.

Food Tourism Sector Industry (From 2018 to 2022)

Market HCAGR (From 2018 to 2022) 13.60%
Market Size - 2018 US$ 519,829.40 million
Market Size - 2022 US$ 865,713.50 million

Food Tourism Sector Industry (From 2023 to 2033)

Market CAGR (From 2023 to 2033) 15.20%
Market Size - 2023 US$ 999,033.40 million
Market Size - 2033 US$ 4,112,489.40 million

Don't pay for what you don't need

Customize your report by selecting specific countries or regions and save 30%!

Historical Comparison for Food Tourism Sector Market between From 2018 to 2022 and From 2023 to 2033

During the projection period, the food tourism sector is expected to grow significantly. Food tourism adds a new dimension to the tourism business, allowing it to expand tremendously. The primary goal of the food tourism sector has been to promote the regional characteristics of various tourist destinations and attract a bigger number of tourists to these destinations.

Currently, the industry attracts 5382.3 million tourists every year, a figure that is anticipated to rise dramatically in the next years. The governments of many countries are attempting to encourage tourism in their own countries by advertising and marketing their regional cuisine; this is projected to significantly increase the food tourism sector business. As a result, the outlook for the food tourism sector appears to be bright.

An Increase in Home Cooked Food and Meal Sharing Would Boost the Food Tourism Sector

The primary motive of choosing destinations for tourism has not been the food, but it does remain the secondary and one of the most important factors while planning a travel. There has been an increasing trend among tourists to taste the local cuisine.

This has made options like home-cooked food and meal sharing very popular. The tourists are excited to share meals with the local families, and the tour operators have also started offering these options in their tour packages. This is expected to help boost the food tourism sector market.

Ronak Shah
Ronak Shah

Principal Consultant

Talk to Analyst

Find your sweet spots for generating winning opportunities in this market.

Cooking Classes Are Rising in Popularity Among the Tourists

While food tourism has primarily been about exploring different tastes and developing a sensory experience at different destinations, recently it has also become a way for tourists to immerse themselves into the local culture and learn more about the place they are visiting.

The most popular way of this has been local cooking classes; these classes offer tourists special cooking lessons, the person conducting the classes is most often a local person who has deep knowledge about the local cuisine and can impart it to the tourists. These classes have immensely helped in boosting the food tourism sector market.

Comparative View of Adjacent Food Tourism Sector Business

Food Tourism Sector Market:

Attributes Food Tourism Sector Market
CAGR (From 2023 to 2033) 15.20%
Market Value (2023) US$ 999,033.40 million
Growth Factor Authentic experiences drive food tourism growth.
Opportunity Social media promotes culinary destinations.
Key Trends Food festivals attract diverse tourists.

Medical Tourism Market:

Attributes Medical Tourism Market
CAGR (From 2023 to 2033) 13%
Market Value (2023) US$ 13.28 billion
Growth Factor Cosmetic and dental treatments popular in medical tourism.
Opportunity Emerging markets offer quality care at competitive prices.
Key Trends Medical tourism combines treatment with leisure activities.

Wellness Tourism Market:

Attributes Wellness Tourism Market
CAGR (From 2023 to 2033) 7.2%
Market Value (2023) US$ 987.51 billion
Growth Factor Well-being focus drives wellness tourism growth.
Opportunity Retreats and spas attract relaxation seekers.
Key Trends Adventure and nature blend with wellness experiences.

Get the data you need at a Fraction of the cost

Personalize your report by choosing insights you need
and save 40%!

Country - Wise Insights

What makes North America an attractive destination for food enthusiasts?

Attribute Details
North America Market Share - 2023 22.30%
United States Market Share - 2023 18.30%
Australia Market Share - 2023 2.30%

The food tourism sector in North America is experiencing significant growth and has become a thriving food tourism sector industry. With its diverse culinary offerings and rich gastronomic traditions, the region attracts food enthusiasts from around the world. From food festivals and farmers markets to farm-to-table experiences and culinary tours, North America offers a wide range of options for tourists seeking immersive food experiences.

The food tourism sector market has witnessed an increase in food-focused itineraries, cooking classes, and food-themed events, catering to the growing demand for culinary adventures. This booming sector has not only stimulated local economies but has also fostered cultural exchange and appreciation for diverse cuisines across the continent.

How is the dynamic cuisine and hospitality of locals driving the sector in India?

Attribute Details
Japan Market Share - 2023 4.90%
China Market CAGR (From 2023 to 2033) 16.30%
India Market CAGR (From 2023 to 2033) 18.30%

Artistic presentation and variety of spices make Indian cuisine widely popular.

India's food tourism sector industry is anticipated to expand the fastest due to the country's abundance of traditional groceries. Additionally, curry, spices, and diverse Indian foods are always viewed as works of art. Foreign tourists are drawn to Indian cuisine by this art.

The desire to learn more about Indian lifestyle, culture, and customs is another major factor driving the development of the food tourism sector of the country. Over the forecast period, this is anticipated to escalate the food tourism sector market.

What is driving the food tourism market in Japan?

Presence of high-quality restaurants and popularity of traditional Japanese cuisine is boosting the market in Japan

The food tourism market in Japan has grown rapidly due to the exquisite delicacies that originate in the country. Japan’s cuisine is famously known as Washoku, which helps in attracting consumers from around the globe, and is based upon traditional rice-based food items and miso soup. Tokyo, a city in Japan boasts of being the city with the highest number of Michelin stars restaurants in the world.

This along with the rising popularity of Japanese pop culture across the globe has risen the interest of people to try and explore traditional Japanese cuisine, boosting the food tourism sector market growth. The hospitality of the Japanese citizens and the wide variety of alcoholic beverages offered in Japan spur the food tourism sector industry ahead.

How are government initiatives boosting the food tourism sector in France?

Attribute Details
Europe Market Share - 2023 29.40%
Germany Market Share - 2023 8.40%
United Kingdom Market CAGR (From 2023 to 2033) 10.50%

Efforts to preserve the essence of French cuisine are being made by the government.

The government of France has started taking initiatives to improve the image of their tourism sector which has gained an image of arrogance. French cuisine has been popular worldwide due to the concept of ‘Fait Maison’ which translates to ‘Homemade’.

The essence of French pastries, artisanal cheese, and other food items depends on the freshness and the experience of eating them as soon as they are cooked. This essence is getting lost in today’s fast-paced food industry where frozen packaged food items are getting more popular day by day. The French government has introduced measures to preserve this important feature of their food tourism industry, urging the business and restaurants involved in the sector to preserve the quality of their food offerings.

This move is expected to keep the France food tourism sector lively and inflowing with consumers from around the world. The France food tourism industry is expected to grow at a steady rate, and contribute a healthy amount of revenue to the global food tourism sector market.

Category - Wise Insights

Which is the most preferred activity in the food tourism sector?

Category Activity type
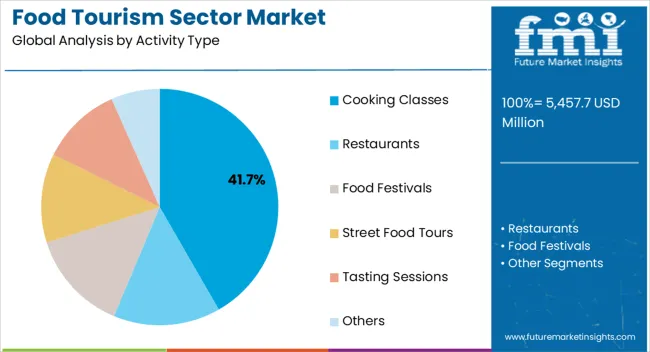
Leading Segment Restaurants
Market Share 58.40%

Restaurants and food festivals remain the top preferred activities in the food tourism market

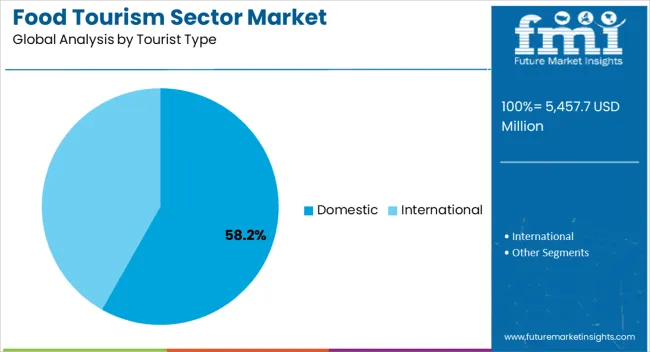
Restaurants remain one of the prominent categories based on the activity type in the food tourism sector. The majority of food tourism occurs as people travel to try out new restaurants and different cuisines. This is due to food tourism prominently occurring on a domestic scale, where people like to explore cuisine near to them and have a relaxing experience.

Food festivals are one of the most prominent categories, where food festivals like the Pizzafest held in Naples, Italy and the Oktoberfest held in Germany attract millions of tourists to their attractions. This category boosts the international food tourism sector substantially.

What type of booking channel is the most prominent channel in the food tourism sector?

Category Booking Channel
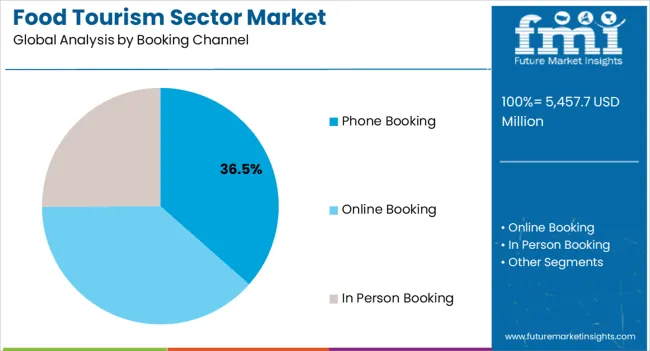
Leading Segment Online Booking
Market Share 40.20%

Online booking channel leads the booking channels segment in the food tourism sector

The emergence of digitalization has affected the food tourism industry positively. The presence of different apps for bookings of restaurants, food festivals, cooking classes, etc. has made it easier for consumers to book their tours, while also providing them with a wide range of options. This has made online booking channels the leading booking channel in the food tourism sector.

Which Tour type is more popular?

Package traveler is the most popular tour type in the food tourism sector

The presence of reputed and experienced tour operators in the sector has improved the ease of traveling. The firms offer lucrative packages, ranging in prices, destinations, cuisine type, etc., and offer comprehensive end-to-end services to the consumer. This has helped the packaged traveler category become the most prominent tour type in the food tourism sector.
How can Manufacturers Scale their Businesses in the Food Tourism Sector Market?

  • Develop unique culinary experiences and partnerships with local food vendors.
  • Leverage social media platforms to promote food tourism offerings and engage with potential customers.
  • Expand distribution channels by supplying local gourmet shops, hotels, and restaurants with food tourism products.
  • Collaborate with tourism boards and travel agencies to include food tourism experiences in travel packages.
  • Offer customizable food tours and tasting menus to cater to diverse preferences and dietary restrictions.
  • Invest in marketing campaigns targeting food enthusiasts and tourists interested in culinary experiences.
  • Collaborate with tourism boards and travel agencies to include food tourism experiences in travel packages.
  • Offer customizable food tours and tasting menus to cater to diverse preferences and dietary restrictions.
  • Maintain high-quality standards and focus on delivering exceptional customer service to generate positive word-of-mouth.
  • Establish strategic alliances with popular food bloggers, influencers, and food-related media outlets for increased exposure.

Competitive Landscape

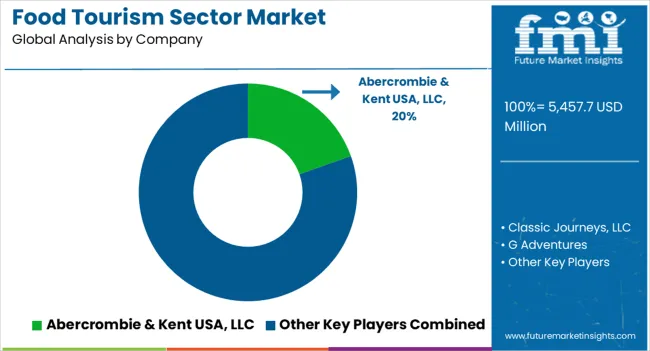
The presence of important companies in the domestic safety locker industry has resulted in vendor competition. Limited branded and worldwide companies dominate the total food tourism sector market. The food tourism market players focus on aesthetic appeal, product technology, and add-on features that provide additional safety to differentiate their products from the competition.

The food tourism sector market players are likely to benefit from growing industrial expenditure, new infrastructure development, and growth in culinary tourism in the region. To acquire a competitive advantage, the players are increasing mergers and acquisitions. Due to improved infrastructure, the food tourism industry is expected to see an increase in rising sales.

Key Players

  • Abercrombie & Kent USA, LLC
  • Classic Journeys, LLC
  • G Adventures
  • Greaves Travel Ltd
  • India Food Tour
  • ITC Travel Group Limited
  • The FTC4Lobe Group
  • Topdeck Travel [Flight, Centre (Uk) Limited)]
  • The Travel Corporation
  • Gourmeton Tour Culinary Adventures
  • International Culinary Tours
  • Butterfield & Robinson Inc.

Latest Advancements:

Company India Culinary Tour
Strategy Personalized Culinary Adventures by India Culinary Tour
Details India culinary Tour, a company that provides culinary tours in India, has customised alternatives for travellers and allows them to choose from a variety of items.
Company WijnSpijs
Strategy Unveiling the Dutch Culinary Delights through Exquisite Gourmet Experiences
Details WijnSpijs is a new food tourism company in the Netherlands. The company organises gourmet experiences for guests all throughout the country using two unique smartphone apps: one for clients and one for eateries.

Key Segments

By Activity Type:

  • Cooking Classes
  • Restaurants
  • Food Festivals
  • Street Food Tours
  • Tasting Sessions
  • Others

By Booking Channel:

  • Phone Booking
  • Online Booking
  • In Person Booking

By Tourist Type:

  • Domestic
  • International

By Tour Type:

  • Independent Traveler
  • Package Traveler
  • Tour Group

By Consumer Orientation:

  • Men
  • Women

By Age Group:

  • 15-25 Years
  • 26-35 Years
  • 36-45 Years
  • 46-55 Years
  • 66-75 Years

Frequently Asked Questions

What are the Current Trends Driving the Food Tourism Sector Market?

The popularity of food and beverage festivals and demand for authentic and immersive gastronomic adventures.

How the Market Performed in the Past?

The market recorded a growth of 13.60% from 2018 to 2022.

Which Segment Leads the Food Tourism Sector Market?

Culinary tours and food-focused travel experiences are leading segments in the market.

How Big is the Food Tourism Sector Market in 2023?

The market is estimated to be around US$ 999,033.40 million in 2023.

What Region is an Attractive Destination for Food Enthusiast?

North America is attracting tourist, with a CAGR of 22.30% through 2033.

Table of Content

1. Executive Summary

    1.1. Global Market Outlook

    1.2. Demand-side Trends

    1.3. Supply-side Trends

    1.4. Technology Roadmap Analysis

    1.5. Analysis and Recommendations

2. Market Overview

    2.1. Market Coverage / Taxonomy

    2.2. Market Definition / Scope / Limitations

3. Market Background

    3.1. Market Dynamics

        3.1.1. Drivers

        3.1.2. Restraints

        3.1.3. Opportunity

        3.1.4. Trends

    3.2. Scenario Forecast

        3.2.1. Demand in Optimistic Scenario

        3.2.2. Demand in Likely Scenario

        3.2.3. Demand in Conservative Scenario

    3.3. Opportunity Map Analysis

    3.4. Investment Feasibility Matrix

    3.5. PESTLE and Porter’s Analysis

    3.6. Regulatory Landscape

        3.6.1. By Key Regions

        3.6.2. By Key Countries

    3.7. Regional Parent Market Outlook

4. Global Market Analysis 2018 to 2022 and Forecast, 2023 to 2033

    4.1. Historical Market Size Value (US$ Million) Analysis, 2018 to 2022

    4.2. Current and Future Market Size Value (US$ Million) Projections, 2023 to 2033

        4.2.1. Y-o-Y Growth Trend Analysis

        4.2.2. Absolute $ Opportunity Analysis

5. Global Market Analysis 2018 to 2022 and Forecast 2023 to 2033, By Activity Type

    5.1. Introduction / Key Findings

    5.2. Historical Market Size Value (US$ Million) Analysis By Activity Type, 2018 to 2022

    5.3. Current and Future Market Size Value (US$ Million) Analysis and Forecast By Activity Type, 2023 to 2033

        5.3.1. Cooking Classes

        5.3.2. Restaurants

        5.3.3. Food Festivals

        5.3.4. Street Food Tours

        5.3.5. Tasting Sessions

        5.3.6. Others

    5.4. Y-o-Y Growth Trend Analysis By Activity Type, 2018 to 2022

    5.5. Absolute $ Opportunity Analysis By Activity Type, 2023 to 2033

6. Global Market Analysis 2018 to 2022 and Forecast 2023 to 2033, By Booking Channel

    6.1. Introduction / Key Findings

    6.2. Historical Market Size Value (US$ Million) Analysis By Booking Channel, 2018 to 2022

    6.3. Current and Future Market Size Value (US$ Million) Analysis and Forecast By Booking Channel, 2023 to 2033

        6.3.1. Phone Booking

        6.3.2. Online Booking

        6.3.3. In Person Booking

    6.4. Y-o-Y Growth Trend Analysis By Booking Channel, 2018 to 2022

    6.5. Absolute $ Opportunity Analysis By Booking Channel, 2023 to 2033

7. Global Market Analysis 2018 to 2022 and Forecast 2023 to 2033, By Tourist Type

    7.1. Introduction / Key Findings

    7.2. Historical Market Size Value (US$ Million) Analysis by Tourist Type, 2018 to 2022

    7.3. Current and Future Market Size Value (US$ Million) Analysis and Forecast by Tourist Type, 2023 to 2033

        7.3.1. Domestic

        7.3.2. International

    7.4. Y-o-Y Growth Trend Analysis by Tourist Type, 2018 to 2022

    7.5. Absolute $ Opportunity Analysis by Tourist Type, 2023 to 2033

8. Global Market Analysis 2018 to 2022 and Forecast 2023 to 2033, By Tour Type

    8.1. Introduction / Key Findings

    8.2. Historical Market Size Value (US$ Million) Analysis By Tour Type, 2018 to 2022

    8.3. Current and Future Market Size Value (US$ Million) Analysis and Forecast By Tour Type, 2023 to 2033

        8.3.1. Independent Traveler

        8.3.2. Package Traveler

        8.3.3. Tour Group

    8.4. Y-o-Y Growth Trend Analysis By Tour Type, 2018 to 2022

    8.5. Absolute $ Opportunity Analysis By Tour Type, 2023 to 2033

9. Global Market Analysis 2018 to 2022 and Forecast 2023 to 2033, By Consumer Orientation

    9.1. Introduction / Key Findings

    9.2. Historical Market Size Value (US$ Million) Analysis By Consumer Orientation, 2018 to 2022

    9.3. Current and Future Market Size Value (US$ Million) Analysis and Forecast By Consumer Orientation, 2023 to 2033

        9.3.1. Men

        9.3.2. Women

    9.4. Y-o-Y Growth Trend Analysis By Consumer Orientation, 2018 to 2022

    9.5. Absolute $ Opportunity Analysis By Consumer Orientation, 2023 to 2033

10. Global Market Analysis 2018 to 2022 and Forecast 2023 to 2033, By Age Group

    10.1. Introduction / Key Findings

    10.2. Historical Market Size Value (US$ Million) Analysis By Age Group, 2018 to 2022

    10.3. Current and Future Market Size Value (US$ Million) Analysis and Forecast By Age Group, 2023 to 2033

        10.3.1. 15-25 Years

        10.3.2. 26-35 Years

        10.3.3. 36-45 Years

        10.3.4. 46-55 Years

        10.3.5. 66-75 Years

    10.4. Y-o-Y Growth Trend Analysis By Age Group, 2018 to 2022

    10.5. Absolute $ Opportunity Analysis By Age Group, 2023 to 2033

11. Global Market Analysis 2018 to 2022 and Forecast 2023 to 2033, By Region

    11.1. Introduction

    11.2. Historical Market Size Value (US$ Million) Analysis By Region, 2018 to 2022

    11.3. Current Market Size Value (US$ Million) Analysis and Forecast By Region, 2023 to 2033

        11.3.1. North America

        11.3.2. Latin America

        11.3.3. Western Europe

        11.3.4. Eastern Europe

        11.3.5. South Asia and Pacific

        11.3.6. East Asia

        11.3.7. Middle East and Africa

    11.4. Market Attractiveness Analysis By Region

12. North America Market Analysis 2018 to 2022 and Forecast 2023 to 2033, By Country

    12.1. Historical Market Size Value (US$ Million) Trend Analysis By Market Taxonomy, 2018 to 2022

    12.2. Market Size Value (US$ Million) Forecast By Market Taxonomy, 2023 to 2033

        12.2.1. By Country

            12.2.1.1. The USA

            12.2.1.2. Canada

        12.2.2. By Activity Type

        12.2.3. By Booking Channel

        12.2.4. By Tourist Type

        12.2.5. By Tour Type

        12.2.6. By Consumer Orientation

        12.2.7. By Age Group

    12.3. Market Attractiveness Analysis

        12.3.1. By Country

        12.3.2. By Activity Type

        12.3.3. By Booking Channel

        12.3.4. By Tourist Type

        12.3.5. By Tour Type

        12.3.6. By Consumer Orientation

        12.3.7. By Age Group

    12.4. Key Takeaways

13. Latin America Market Analysis 2018 to 2022 and Forecast 2023 to 2033, By Country

    13.1. Historical Market Size Value (US$ Million) Trend Analysis By Market Taxonomy, 2018 to 2022

    13.2. Market Size Value (US$ Million) Forecast By Market Taxonomy, 2023 to 2033

        13.2.1. By Country

            13.2.1.1. Brazil

            13.2.1.2. Mexico

            13.2.1.3. Rest of Latin America

        13.2.2. By Activity Type

        13.2.3. By Booking Channel

        13.2.4. By Tourist Type

        13.2.5. By Tour Type

        13.2.6. By Consumer Orientation

        13.2.7. By Age Group

    13.3. Market Attractiveness Analysis

        13.3.1. By Country

        13.3.2. By Activity Type

        13.3.3. By Booking Channel

        13.3.4. By Tourist Type

        13.3.5. By Tour Type

        13.3.6. By Consumer Orientation

        13.3.7. By Age Group

    13.4. Key Takeaways

14. Western Europe Market Analysis 2018 to 2022 and Forecast 2023 to 2033, By Country

    14.1. Historical Market Size Value (US$ Million) Trend Analysis By Market Taxonomy, 2018 to 2022

    14.2. Market Size Value (US$ Million) Forecast By Market Taxonomy, 2023 to 2033

        14.2.1. By Country

            14.2.1.1. Germany

            14.2.1.2. United Kingdom

            14.2.1.3. France

            14.2.1.4. Spain

            14.2.1.5. Italy

            14.2.1.6. Rest of Western Europe

        14.2.2. By Activity Type

        14.2.3. By Booking Channel

        14.2.4. By Tourist Type

        14.2.5. By Tour Type

        14.2.6. By Consumer Orientation

        14.2.7. By Age Group

    14.3. Market Attractiveness Analysis

        14.3.1. By Country

        14.3.2. By Activity Type

        14.3.3. By Booking Channel

        14.3.4. By Tourist Type

        14.3.5. By Tour Type

        14.3.6. By Consumer Orientation

        14.3.7. By Age Group

    14.4. Key Takeaways

15. Eastern Europe Market Analysis 2018 to 2022 and Forecast 2023 to 2033, By Country

    15.1. Historical Market Size Value (US$ Million) Trend Analysis By Market Taxonomy, 2018 to 2022

    15.2. Market Size Value (US$ Million) Forecast By Market Taxonomy, 2023 to 2033

        15.2.1. By Country

            15.2.1.1. Poland

            15.2.1.2. Russia

            15.2.1.3. Czech Republic

            15.2.1.4. Romania

            15.2.1.5. Rest of Eastern Europe

        15.2.2. By Activity Type

        15.2.3. By Booking Channel

        15.2.4. By Tourist Type

        15.2.5. By Tour Type

        15.2.6. By Consumer Orientation

        15.2.7. By Age Group

    15.3. Market Attractiveness Analysis

        15.3.1. By Country

        15.3.2. By Activity Type

        15.3.3. By Booking Channel

        15.3.4. By Tourist Type

        15.3.5. By Tour Type

        15.3.6. By Consumer Orientation

        15.3.7. By Age Group

    15.4. Key Takeaways

16. South Asia and Pacific Market Analysis 2018 to 2022 and Forecast 2023 to 2033, By Country

    16.1. Historical Market Size Value (US$ Million) Trend Analysis By Market Taxonomy, 2018 to 2022

    16.2. Market Size Value (US$ Million) Forecast By Market Taxonomy, 2023 to 2033

        16.2.1. By Country

            16.2.1.1. India

            16.2.1.2. Bangladesh

            16.2.1.3. Australia

            16.2.1.4. New Zealand

            16.2.1.5. Rest of South Asia and Pacific

        16.2.2. By Activity Type

        16.2.3. By Booking Channel

        16.2.4. By Tourist Type

        16.2.5. By Tour Type

        16.2.6. By Consumer Orientation

        16.2.7. By Age Group

    16.3. Market Attractiveness Analysis

        16.3.1. By Country

        16.3.2. By Activity Type

        16.3.3. By Booking Channel

        16.3.4. By Tourist Type

        16.3.5. By Tour Type

        16.3.6. By Consumer Orientation

        16.3.7. By Age Group

    16.4. Key Takeaways

17. East Asia Market Analysis 2018 to 2022 and Forecast 2023 to 2033, By Country

    17.1. Historical Market Size Value (US$ Million) Trend Analysis By Market Taxonomy, 2018 to 2022

    17.2. Market Size Value (US$ Million) Forecast By Market Taxonomy, 2023 to 2033

        17.2.1. By Country

            17.2.1.1. China

            17.2.1.2. Japan

            17.2.1.3. South Korea

        17.2.2. By Activity Type

        17.2.3. By Booking Channel

        17.2.4. By Tourist Type

        17.2.5. By Tour Type

        17.2.6. By Consumer Orientation

        17.2.7. By Age Group

    17.3. Market Attractiveness Analysis

        17.3.1. By Country

        17.3.2. By Activity Type

        17.3.3. By Booking Channel

        17.3.4. By Tourist Type

        17.3.5. By Tour Type

        17.3.6. By Consumer Orientation

        17.3.7. By Age Group

    17.4. Key Takeaways

18. Middle East and Africa Market Analysis 2018 to 2022 and Forecast 2023 to 2033, By Country

    18.1. Historical Market Size Value (US$ Million) Trend Analysis By Market Taxonomy, 2018 to 2022

    18.2. Market Size Value (US$ Million) Forecast By Market Taxonomy, 2023 to 2033

        18.2.1. By Country

            18.2.1.1. GCC Countries

            18.2.1.2. South Africa

            18.2.1.3. Israel

            18.2.1.4. Rest of MEA

        18.2.2. By Activity Type

        18.2.3. By Booking Channel

        18.2.4. By Tourist Type

        18.2.5. By Tour Type

        18.2.6. By Consumer Orientation

        18.2.7. By Age Group

    18.3. Market Attractiveness Analysis

        18.3.1. By Country

        18.3.2. By Activity Type

        18.3.3. By Booking Channel

        18.3.4. By Tourist Type

        18.3.5. By Tour Type

        18.3.6. By Consumer Orientation

        18.3.7. By Age Group

    18.4. Key Takeaways

19. Key Countries Market Analysis

    19.1. USA

        19.1.1. Pricing Analysis

        19.1.2. Market Share Analysis, 2022

            19.1.2.1. By Activity Type

            19.1.2.2. By Booking Channel

            19.1.2.3. By Tourist Type

            19.1.2.4. By Tour Type

            19.1.2.5. By Consumer Orientation

            19.1.2.6. By Age Group

    19.2. Canada

        19.2.1. Pricing Analysis

        19.2.2. Market Share Analysis, 2022

            19.2.2.1. By Activity Type

            19.2.2.2. By Booking Channel

            19.2.2.3. By Tourist Type

            19.2.2.4. By Tour Type

            19.2.2.5. By Consumer Orientation

            19.2.2.6. By Age Group

    19.3. Brazil

        19.3.1. Pricing Analysis

        19.3.2. Market Share Analysis, 2022

            19.3.2.1. By Activity Type

            19.3.2.2. By Booking Channel

            19.3.2.3. By Tourist Type

            19.3.2.4. By Tour Type

            19.3.2.5. By Consumer Orientation

            19.3.2.6. By Age Group

    19.4. Mexico

        19.4.1. Pricing Analysis

        19.4.2. Market Share Analysis, 2022

            19.4.2.1. By Activity Type

            19.4.2.2. By Booking Channel

            19.4.2.3. By Tourist Type

            19.4.2.4. By Tour Type

            19.4.2.5. By Consumer Orientation

            19.4.2.6. By Age Group

    19.5. Germany

        19.5.1. Pricing Analysis

        19.5.2. Market Share Analysis, 2022

            19.5.2.1. By Activity Type

            19.5.2.2. By Booking Channel

            19.5.2.3. By Tourist Type

            19.5.2.4. By Tour Type

            19.5.2.5. By Consumer Orientation

            19.5.2.6. By Age Group

    19.6. United Kingdom

        19.6.1. Pricing Analysis

        19.6.2. Market Share Analysis, 2022

            19.6.2.1. By Activity Type

            19.6.2.2. By Booking Channel

            19.6.2.3. By Tourist Type

            19.6.2.4. By Tour Type

            19.6.2.5. By Consumer Orientation

            19.6.2.6. By Age Group

    19.7. France

        19.7.1. Pricing Analysis

        19.7.2. Market Share Analysis, 2022

            19.7.2.1. By Activity Type

            19.7.2.2. By Booking Channel

            19.7.2.3. By Tourist Type

            19.7.2.4. By Tour Type

            19.7.2.5. By Consumer Orientation

            19.7.2.6. By Age Group

    19.8. Spain

        19.8.1. Pricing Analysis

        19.8.2. Market Share Analysis, 2022

            19.8.2.1. By Activity Type

            19.8.2.2. By Booking Channel

            19.8.2.3. By Tourist Type

            19.8.2.4. By Tour Type

            19.8.2.5. By Consumer Orientation

            19.8.2.6. By Age Group

    19.9. Italy

        19.9.1. Pricing Analysis

        19.9.2. Market Share Analysis, 2022

            19.9.2.1. By Activity Type

            19.9.2.2. By Booking Channel

            19.9.2.3. By Tourist Type

            19.9.2.4. By Tour Type

            19.9.2.5. By Consumer Orientation

            19.9.2.6. By Age Group

    19.10. Poland

        19.10.1. Pricing Analysis

        19.10.2. Market Share Analysis, 2022

            19.10.2.1. By Activity Type

            19.10.2.2. By Booking Channel

            19.10.2.3. By Tourist Type

            19.10.2.4. By Tour Type

            19.10.2.5. By Consumer Orientation

            19.10.2.6. By Age Group

    19.11. Russia

        19.11.1. Pricing Analysis

        19.11.2. Market Share Analysis, 2022

            19.11.2.1. By Activity Type

            19.11.2.2. By Booking Channel

            19.11.2.3. By Tourist Type

            19.11.2.4. By Tour Type

            19.11.2.5. By Consumer Orientation

            19.11.2.6. By Age Group

    19.12. Czech Republic

        19.12.1. Pricing Analysis

        19.12.2. Market Share Analysis, 2022

            19.12.2.1. By Activity Type

            19.12.2.2. By Booking Channel

            19.12.2.3. By Tourist Type

            19.12.2.4. By Tour Type

            19.12.2.5. By Consumer Orientation

            19.12.2.6. By Age Group

    19.13. Romania

        19.13.1. Pricing Analysis

        19.13.2. Market Share Analysis, 2022

            19.13.2.1. By Activity Type

            19.13.2.2. By Booking Channel

            19.13.2.3. By Tourist Type

            19.13.2.4. By Tour Type

            19.13.2.5. By Consumer Orientation

            19.13.2.6. By Age Group

    19.14. India

        19.14.1. Pricing Analysis

        19.14.2. Market Share Analysis, 2022

            19.14.2.1. By Activity Type

            19.14.2.2. By Booking Channel

            19.14.2.3. By Tourist Type

            19.14.2.4. By Tour Type

            19.14.2.5. By Consumer Orientation

            19.14.2.6. By Age Group

    19.15. Bangladesh

        19.15.1. Pricing Analysis

        19.15.2. Market Share Analysis, 2022

            19.15.2.1. By Activity Type

            19.15.2.2. By Booking Channel

            19.15.2.3. By Tourist Type

            19.15.2.4. By Tour Type

            19.15.2.5. By Consumer Orientation

            19.15.2.6. By Age Group

    19.16. Australia

        19.16.1. Pricing Analysis

        19.16.2. Market Share Analysis, 2022

            19.16.2.1. By Activity Type

            19.16.2.2. By Booking Channel

            19.16.2.3. By Tourist Type

            19.16.2.4. By Tour Type

            19.16.2.5. By Consumer Orientation

            19.16.2.6. By Age Group

    19.17. New Zealand

        19.17.1. Pricing Analysis

        19.17.2. Market Share Analysis, 2022

            19.17.2.1. By Activity Type

            19.17.2.2. By Booking Channel

            19.17.2.3. By Tourist Type

            19.17.2.4. By Tour Type

            19.17.2.5. By Consumer Orientation

            19.17.2.6. By Age Group

    19.18. China

        19.18.1. Pricing Analysis

        19.18.2. Market Share Analysis, 2022

            19.18.2.1. By Activity Type

            19.18.2.2. By Booking Channel

            19.18.2.3. By Tourist Type

            19.18.2.4. By Tour Type

            19.18.2.5. By Consumer Orientation

            19.18.2.6. By Age Group

    19.19. Japan

        19.19.1. Pricing Analysis

        19.19.2. Market Share Analysis, 2022

            19.19.2.1. By Activity Type

            19.19.2.2. By Booking Channel

            19.19.2.3. By Tourist Type

            19.19.2.4. By Tour Type

            19.19.2.5. By Consumer Orientation

            19.19.2.6. By Age Group

    19.20. South Korea

        19.20.1. Pricing Analysis

        19.20.2. Market Share Analysis, 2022

            19.20.2.1. By Activity Type

            19.20.2.2. By Booking Channel

            19.20.2.3. By Tourist Type

            19.20.2.4. By Tour Type

            19.20.2.5. By Consumer Orientation

            19.20.2.6. By Age Group

    19.21. GCC Countries

        19.21.1. Pricing Analysis

        19.21.2. Market Share Analysis, 2022

            19.21.2.1. By Activity Type

            19.21.2.2. By Booking Channel

            19.21.2.3. By Tourist Type

            19.21.2.4. By Tour Type

            19.21.2.5. By Consumer Orientation

            19.21.2.6. By Age Group

    19.22. South Africa

        19.22.1. Pricing Analysis

        19.22.2. Market Share Analysis, 2022

            19.22.2.1. By Activity Type

            19.22.2.2. By Booking Channel

            19.22.2.3. By Tourist Type

            19.22.2.4. By Tour Type

            19.22.2.5. By Consumer Orientation

            19.22.2.6. By Age Group

    19.23. Israel

        19.23.1. Pricing Analysis

        19.23.2. Market Share Analysis, 2022

            19.23.2.1. By Activity Type

            19.23.2.2. By Booking Channel

            19.23.2.3. By Tourist Type

            19.23.2.4. By Tour Type

            19.23.2.5. By Consumer Orientation

            19.23.2.6. By Age Group

20. Market Structure Analysis

    20.1. Competition Dashboard

    20.2. Competition Benchmarking

    20.3. Market Share Analysis of Top Players

        20.3.1. By Regional

        20.3.2. By Activity Type

        20.3.3. By Booking Channel

        20.3.4. By Tourist Type

        20.3.5. By Tour Type

        20.3.6. By Consumer Orientation

        20.3.7. By Age Group

21. Competition Analysis

    21.1. Competition Deep Dive

        21.1.1. Abercrombie & Kent USA, LLC

            21.1.1.1. Overview

            21.1.1.2. Product Portfolio

            21.1.1.3. Profitability by Market Segments

            21.1.1.4. Sales Footprint

            21.1.1.5. Strategy Overview

                21.1.1.5.1. Marketing Strategy

        21.1.2. Classic Journeys, LLC

            21.1.2.1. Overview

            21.1.2.2. Product Portfolio

            21.1.2.3. Profitability by Market Segments

            21.1.2.4. Sales Footprint

            21.1.2.5. Strategy Overview

                21.1.2.5.1. Marketing Strategy

        21.1.3. G Adventures

            21.1.3.1. Overview

            21.1.3.2. Product Portfolio

            21.1.3.3. Profitability by Market Segments

            21.1.3.4. Sales Footprint

            21.1.3.5. Strategy Overview

                21.1.3.5.1. Marketing Strategy

        21.1.4. Greaves Travel Ltd

            21.1.4.1. Overview

            21.1.4.2. Product Portfolio

            21.1.4.3. Profitability by Market Segments

            21.1.4.4. Sales Footprint

            21.1.4.5. Strategy Overview

                21.1.4.5.1. Marketing Strategy

        21.1.5. India Food Tour

            21.1.5.1. Overview

            21.1.5.2. Product Portfolio

            21.1.5.3. Profitability by Market Segments

            21.1.5.4. Sales Footprint

            21.1.5.5. Strategy Overview

                21.1.5.5.1. Marketing Strategy

        21.1.6. ITC Travel Group Limited

            21.1.6.1. Overview

            21.1.6.2. Product Portfolio

            21.1.6.3. Profitability by Market Segments

            21.1.6.4. Sales Footprint

            21.1.6.5. Strategy Overview

                21.1.6.5.1. Marketing Strategy

        21.1.7. The FTC4Lobe Group

            21.1.7.1. Overview

            21.1.7.2. Product Portfolio

            21.1.7.3. Profitability by Market Segments

            21.1.7.4. Sales Footprint

            21.1.7.5. Strategy Overview

                21.1.7.5.1. Marketing Strategy

        21.1.8. Topdeck Travel [Flight, Centre (Uk) Limited)]

            21.1.8.1. Overview

            21.1.8.2. Product Portfolio

            21.1.8.3. Profitability by Market Segments

            21.1.8.4. Sales Footprint

            21.1.8.5. Strategy Overview

                21.1.8.5.1. Marketing Strategy

        21.1.9. The Travel Corporation

            21.1.9.1. Overview

            21.1.9.2. Product Portfolio

            21.1.9.3. Profitability by Market Segments

            21.1.9.4. Sales Footprint

            21.1.9.5. Strategy Overview

                21.1.9.5.1. Marketing Strategy

        21.1.10. Gourmeton Tour Culinary Adventures

            21.1.10.1. Overview

            21.1.10.2. Product Portfolio

            21.1.10.3. Profitability by Market Segments

            21.1.10.4. Sales Footprint

            21.1.10.5. Strategy Overview

                21.1.10.5.1. Marketing Strategy

        21.1.11. International Culinary Tours

            21.1.11.1. Overview

            21.1.11.2. Product Portfolio

            21.1.11.3. Profitability by Market Segments

            21.1.11.4. Sales Footprint

            21.1.11.5. Strategy Overview

                21.1.11.5.1. Marketing Strategy

        21.1.12. Butterfield & Robinson Inc.

            21.1.12.1. Overview

            21.1.12.2. Product Portfolio

            21.1.12.3. Profitability by Market Segments

            21.1.12.4. Sales Footprint

            21.1.12.5. Strategy Overview

                21.1.12.5.1. Marketing Strategy

22. Assumptions & Acronyms Used

23. Research Methodology

Don't pay for what you don't need

Customize your report by selecting specific countries or regions and save 30%!

List of Tables

Table 1: Global Market Value (US$ Million) Forecast by Region, 2018 to 2033

Table 2: Global Market Value (US$ Million) Forecast by Activity Type, 2018 to 2033

Table 3: Global Market Value (US$ Million) Forecast by Booking Channel, 2018 to 2033

Table 4: Global Market Value (US$ Million) Forecast by Tourist Type, 2018 to 2033

Table 5: Global Market Value (US$ Million) Forecast by Tour Type, 2018 to 2033

Table 6: Global Market Value (US$ Million) Forecast by Consumer Orientation, 2018 to 2033

Table 7: Global Market Value (US$ Million) Forecast by Age Group, 2018 to 2033

Table 8: North America Market Value (US$ Million) Forecast by Country, 2018 to 2033

Table 9: North America Market Value (US$ Million) Forecast by Activity Type, 2018 to 2033

Table 10: North America Market Value (US$ Million) Forecast by Booking Channel, 2018 to 2033

Table 11: North America Market Value (US$ Million) Forecast by Tourist Type, 2018 to 2033

Table 12: North America Market Value (US$ Million) Forecast by Tour Type, 2018 to 2033

Table 13: North America Market Value (US$ Million) Forecast by Consumer Orientation, 2018 to 2033

Table 14: North America Market Value (US$ Million) Forecast by Age Group, 2018 to 2033

Table 15: Latin America Market Value (US$ Million) Forecast by Country, 2018 to 2033

Table 16: Latin America Market Value (US$ Million) Forecast by Activity Type, 2018 to 2033

Table 17: Latin America Market Value (US$ Million) Forecast by Booking Channel, 2018 to 2033

Table 18: Latin America Market Value (US$ Million) Forecast by Tourist Type, 2018 to 2033

Table 19: Latin America Market Value (US$ Million) Forecast by Tour Type, 2018 to 2033

Table 20: Latin America Market Value (US$ Million) Forecast by Consumer Orientation, 2018 to 2033

Table 21: Latin America Market Value (US$ Million) Forecast by Age Group, 2018 to 2033

Table 22: Western Europe Market Value (US$ Million) Forecast by Country, 2018 to 2033

Table 23: Western Europe Market Value (US$ Million) Forecast by Activity Type, 2018 to 2033

Table 24: Western Europe Market Value (US$ Million) Forecast by Booking Channel, 2018 to 2033

Table 25: Western Europe Market Value (US$ Million) Forecast by Tourist Type, 2018 to 2033

Table 26: Western Europe Market Value (US$ Million) Forecast by Tour Type, 2018 to 2033

Table 27: Western Europe Market Value (US$ Million) Forecast by Consumer Orientation, 2018 to 2033

Table 28: Western Europe Market Value (US$ Million) Forecast by Age Group, 2018 to 2033

Table 29: Eastern Europe Market Value (US$ Million) Forecast by Country, 2018 to 2033

Table 30: Eastern Europe Market Value (US$ Million) Forecast by Activity Type, 2018 to 2033

Table 31: Eastern Europe Market Value (US$ Million) Forecast by Booking Channel, 2018 to 2033

Table 32: Eastern Europe Market Value (US$ Million) Forecast by Tourist Type, 2018 to 2033

Table 33: Eastern Europe Market Value (US$ Million) Forecast by Tour Type, 2018 to 2033

Table 34: Eastern Europe Market Value (US$ Million) Forecast by Consumer Orientation, 2018 to 2033

Table 35: Eastern Europe Market Value (US$ Million) Forecast by Age Group, 2018 to 2033

Table 36: South Asia and Pacific Market Value (US$ Million) Forecast by Country, 2018 to 2033

Table 37: South Asia and Pacific Market Value (US$ Million) Forecast by Activity Type, 2018 to 2033

Table 38: South Asia and Pacific Market Value (US$ Million) Forecast by Booking Channel, 2018 to 2033

Table 39: South Asia and Pacific Market Value (US$ Million) Forecast by Tourist Type, 2018 to 2033

Table 40: South Asia and Pacific Market Value (US$ Million) Forecast by Tour Type, 2018 to 2033

Table 41: South Asia and Pacific Market Value (US$ Million) Forecast by Consumer Orientation, 2018 to 2033

Table 42: South Asia and Pacific Market Value (US$ Million) Forecast by Age Group, 2018 to 2033

Table 43: East Asia Market Value (US$ Million) Forecast by Country, 2018 to 2033

Table 44: East Asia Market Value (US$ Million) Forecast by Activity Type, 2018 to 2033

Table 45: East Asia Market Value (US$ Million) Forecast by Booking Channel, 2018 to 2033

Table 46: East Asia Market Value (US$ Million) Forecast by Tourist Type, 2018 to 2033

Table 47: East Asia Market Value (US$ Million) Forecast by Tour Type, 2018 to 2033

Table 48: East Asia Market Value (US$ Million) Forecast by Consumer Orientation, 2018 to 2033

Table 49: East Asia Market Value (US$ Million) Forecast by Age Group, 2018 to 2033

Table 50: Middle East and Africa Market Value (US$ Million) Forecast by Country, 2018 to 2033

Table 51: Middle East and Africa Market Value (US$ Million) Forecast by Activity Type, 2018 to 2033

Table 52: Middle East and Africa Market Value (US$ Million) Forecast by Booking Channel, 2018 to 2033

Table 53: Middle East and Africa Market Value (US$ Million) Forecast by Tourist Type, 2018 to 2033

Table 54: Middle East and Africa Market Value (US$ Million) Forecast by Tour Type, 2018 to 2033

Table 55: Middle East and Africa Market Value (US$ Million) Forecast by Consumer Orientation, 2018 to 2033

Table 56: Middle East and Africa Market Value (US$ Million) Forecast by Age Group, 2018 to 2033
Ronak Shah
Ronak Shah

Principal Consultant

Talk to Analyst

Find your sweet spots for generating winning opportunities in this market.

List of Charts

Figure 1: Global Market Value (US$ Million) by Activity Type, 2023 to 2033

Figure 2: Global Market Value (US$ Million) by Booking Channel, 2023 to 2033

Figure 3: Global Market Value (US$ Million) by Tourist Type, 2023 to 2033

Figure 4: Global Market Value (US$ Million) by Tour Type, 2023 to 2033

Figure 5: Global Market Value (US$ Million) by Consumer Orientation, 2023 to 2033

Figure 6: Global Market Value (US$ Million) by Age Group, 2023 to 2033

Figure 7: Global Market Value (US$ Million) by Region, 2023 to 2033

Figure 8: Global Market Value (US$ Million) Analysis by Region, 2018 to 2033

Figure 9: Global Market Value Share (%) and BPS Analysis by Region, 2023 to 2033

Figure 10: Global Market Y-o-Y Growth (%) Projections by Region, 2023 to 2033

Figure 11: Global Market Value (US$ Million) Analysis by Activity Type, 2018 to 2033

Figure 12: Global Market Value Share (%) and BPS Analysis by Activity Type, 2023 to 2033

Figure 13: Global Market Y-o-Y Growth (%) Projections by Activity Type, 2023 to 2033

Figure 14: Global Market Value (US$ Million) Analysis by Booking Channel, 2018 to 2033

Figure 15: Global Market Value Share (%) and BPS Analysis by Booking Channel, 2023 to 2033

Figure 16: Global Market Y-o-Y Growth (%) Projections by Booking Channel, 2023 to 2033

Figure 17: Global Market Value (US$ Million) Analysis by Tourist Type, 2018 to 2033

Figure 18: Global Market Value Share (%) and BPS Analysis by Tourist Type, 2023 to 2033

Figure 19: Global Market Y-o-Y Growth (%) Projections by Tourist Type, 2023 to 2033

Figure 20: Global Market Value (US$ Million) Analysis by Tour Type, 2018 to 2033

Figure 21: Global Market Value Share (%) and BPS Analysis by Tour Type, 2023 to 2033

Figure 22: Global Market Y-o-Y Growth (%) Projections by Tour Type, 2023 to 2033

Figure 23: Global Market Value (US$ Million) Analysis by Consumer Orientation, 2018 to 2033

Figure 24: Global Market Value Share (%) and BPS Analysis by Consumer Orientation, 2023 to 2033

Figure 25: Global Market Y-o-Y Growth (%) Projections by Consumer Orientation, 2023 to 2033

Figure 26: Global Market Value (US$ Million) Analysis by Age Group, 2018 to 2033

Figure 27: Global Market Value Share (%) and BPS Analysis by Age Group, 2023 to 2033

Figure 28: Global Market Y-o-Y Growth (%) Projections by Age Group, 2023 to 2033

Figure 29: Global Market Attractiveness by Activity Type, 2023 to 2033

Figure 30: Global Market Attractiveness by Booking Channel, 2023 to 2033

Figure 31: Global Market Attractiveness by Tourist Type, 2023 to 2033

Figure 32: Global Market Attractiveness by Tour Type, 2023 to 2033

Figure 33: Global Market Attractiveness by Consumer Orientation, 2023 to 2033

Figure 34: Global Market Attractiveness by Age Group, 2023 to 2033

Figure 35: Global Market Attractiveness by Region, 2023 to 2033

Figure 36: North America Market Value (US$ Million) by Activity Type, 2023 to 2033

Figure 37: North America Market Value (US$ Million) by Booking Channel, 2023 to 2033

Figure 38: North America Market Value (US$ Million) by Tourist Type, 2023 to 2033

Figure 39: North America Market Value (US$ Million) by Tour Type, 2023 to 2033

Figure 40: North America Market Value (US$ Million) by Consumer Orientation, 2023 to 2033

Figure 41: North America Market Value (US$ Million) by Age Group, 2023 to 2033

Figure 42: North America Market Value (US$ Million) by Country, 2023 to 2033

Figure 43: North America Market Value (US$ Million) Analysis by Country, 2018 to 2033

Figure 44: North America Market Value Share (%) and BPS Analysis by Country, 2023 to 2033

Figure 45: North America Market Y-o-Y Growth (%) Projections by Country, 2023 to 2033

Figure 46: North America Market Value (US$ Million) Analysis by Activity Type, 2018 to 2033

Figure 47: North America Market Value Share (%) and BPS Analysis by Activity Type, 2023 to 2033

Figure 48: North America Market Y-o-Y Growth (%) Projections by Activity Type, 2023 to 2033

Figure 49: North America Market Value (US$ Million) Analysis by Booking Channel, 2018 to 2033

Figure 50: North America Market Value Share (%) and BPS Analysis by Booking Channel, 2023 to 2033

Figure 51: North America Market Y-o-Y Growth (%) Projections by Booking Channel, 2023 to 2033

Figure 52: North America Market Value (US$ Million) Analysis by Tourist Type, 2018 to 2033

Figure 53: North America Market Value Share (%) and BPS Analysis by Tourist Type, 2023 to 2033

Figure 54: North America Market Y-o-Y Growth (%) Projections by Tourist Type, 2023 to 2033

Figure 55: North America Market Value (US$ Million) Analysis by Tour Type, 2018 to 2033

Figure 56: North America Market Value Share (%) and BPS Analysis by Tour Type, 2023 to 2033

Figure 57: North America Market Y-o-Y Growth (%) Projections by Tour Type, 2023 to 2033

Figure 58: North America Market Value (US$ Million) Analysis by Consumer Orientation, 2018 to 2033

Figure 59: North America Market Value Share (%) and BPS Analysis by Consumer Orientation, 2023 to 2033

Figure 60: North America Market Y-o-Y Growth (%) Projections by Consumer Orientation, 2023 to 2033

Figure 61: North America Market Value (US$ Million) Analysis by Age Group, 2018 to 2033

Figure 62: North America Market Value Share (%) and BPS Analysis by Age Group, 2023 to 2033

Figure 63: North America Market Y-o-Y Growth (%) Projections by Age Group, 2023 to 2033

Figure 64: North America Market Attractiveness by Activity Type, 2023 to 2033

Figure 65: North America Market Attractiveness by Booking Channel, 2023 to 2033

Figure 66: North America Market Attractiveness by Tourist Type, 2023 to 2033

Figure 67: North America Market Attractiveness by Tour Type, 2023 to 2033

Figure 68: North America Market Attractiveness by Consumer Orientation, 2023 to 2033

Figure 69: North America Market Attractiveness by Age Group, 2023 to 2033

Figure 70: North America Market Attractiveness by Country, 2023 to 2033

Figure 71: Latin America Market Value (US$ Million) by Activity Type, 2023 to 2033

Figure 72: Latin America Market Value (US$ Million) by Booking Channel, 2023 to 2033

Figure 73: Latin America Market Value (US$ Million) by Tourist Type, 2023 to 2033

Figure 74: Latin America Market Value (US$ Million) by Tour Type, 2023 to 2033

Figure 75: Latin America Market Value (US$ Million) by Consumer Orientation, 2023 to 2033

Figure 76: Latin America Market Value (US$ Million) by Age Group, 2023 to 2033

Figure 77: Latin America Market Value (US$ Million) by Country, 2023 to 2033

Figure 78: Latin America Market Value (US$ Million) Analysis by Country, 2018 to 2033

Figure 79: Latin America Market Value Share (%) and BPS Analysis by Country, 2023 to 2033

Figure 80: Latin America Market Y-o-Y Growth (%) Projections by Country, 2023 to 2033

Figure 81: Latin America Market Value (US$ Million) Analysis by Activity Type, 2018 to 2033

Figure 82: Latin America Market Value Share (%) and BPS Analysis by Activity Type, 2023 to 2033

Figure 83: Latin America Market Y-o-Y Growth (%) Projections by Activity Type, 2023 to 2033

Figure 84: Latin America Market Value (US$ Million) Analysis by Booking Channel, 2018 to 2033

Figure 85: Latin America Market Value Share (%) and BPS Analysis by Booking Channel, 2023 to 2033

Figure 86: Latin America Market Y-o-Y Growth (%) Projections by Booking Channel, 2023 to 2033

Figure 87: Latin America Market Value (US$ Million) Analysis by Tourist Type, 2018 to 2033

Figure 88: Latin America Market Value Share (%) and BPS Analysis by Tourist Type, 2023 to 2033

Figure 89: Latin America Market Y-o-Y Growth (%) Projections by Tourist Type, 2023 to 2033

Figure 90: Latin America Market Value (US$ Million) Analysis by Tour Type, 2018 to 2033

Figure 91: Latin America Market Value Share (%) and BPS Analysis by Tour Type, 2023 to 2033

Figure 92: Latin America Market Y-o-Y Growth (%) Projections by Tour Type, 2023 to 2033

Figure 93: Latin America Market Value (US$ Million) Analysis by Consumer Orientation, 2018 to 2033

Figure 94: Latin America Market Value Share (%) and BPS Analysis by Consumer Orientation, 2023 to 2033

Figure 95: Latin America Market Y-o-Y Growth (%) Projections by Consumer Orientation, 2023 to 2033

Figure 96: Latin America Market Value (US$ Million) Analysis by Age Group, 2018 to 2033

Figure 97: Latin America Market Value Share (%) and BPS Analysis by Age Group, 2023 to 2033

Figure 98: Latin America Market Y-o-Y Growth (%) Projections by Age Group, 2023 to 2033

Figure 99: Latin America Market Attractiveness by Activity Type, 2023 to 2033

Figure 100: Latin America Market Attractiveness by Booking Channel, 2023 to 2033

Figure 101: Latin America Market Attractiveness by Tourist Type, 2023 to 2033

Figure 102: Latin America Market Attractiveness by Tour Type, 2023 to 2033

Figure 103: Latin America Market Attractiveness by Consumer Orientation, 2023 to 2033

Figure 104: Latin America Market Attractiveness by Age Group, 2023 to 2033

Figure 105: Latin America Market Attractiveness by Country, 2023 to 2033

Figure 106: Western Europe Market Value (US$ Million) by Activity Type, 2023 to 2033

Figure 107: Western Europe Market Value (US$ Million) by Booking Channel, 2023 to 2033

Figure 108: Western Europe Market Value (US$ Million) by Tourist Type, 2023 to 2033

Figure 109: Western Europe Market Value (US$ Million) by Tour Type, 2023 to 2033

Figure 110: Western Europe Market Value (US$ Million) by Consumer Orientation, 2023 to 2033

Figure 111: Western Europe Market Value (US$ Million) by Age Group, 2023 to 2033

Figure 112: Western Europe Market Value (US$ Million) by Country, 2023 to 2033

Figure 113: Western Europe Market Value (US$ Million) Analysis by Country, 2018 to 2033

Figure 114: Western Europe Market Value Share (%) and BPS Analysis by Country, 2023 to 2033

Figure 115: Western Europe Market Y-o-Y Growth (%) Projections by Country, 2023 to 2033

Figure 116: Western Europe Market Value (US$ Million) Analysis by Activity Type, 2018 to 2033

Figure 117: Western Europe Market Value Share (%) and BPS Analysis by Activity Type, 2023 to 2033

Figure 118: Western Europe Market Y-o-Y Growth (%) Projections by Activity Type, 2023 to 2033

Figure 119: Western Europe Market Value (US$ Million) Analysis by Booking Channel, 2018 to 2033

Figure 120: Western Europe Market Value Share (%) and BPS Analysis by Booking Channel, 2023 to 2033

Figure 121: Western Europe Market Y-o-Y Growth (%) Projections by Booking Channel, 2023 to 2033

Figure 122: Western Europe Market Value (US$ Million) Analysis by Tourist Type, 2018 to 2033

Figure 123: Western Europe Market Value Share (%) and BPS Analysis by Tourist Type, 2023 to 2033

Figure 124: Western Europe Market Y-o-Y Growth (%) Projections by Tourist Type, 2023 to 2033

Figure 125: Western Europe Market Value (US$ Million) Analysis by Tour Type, 2018 to 2033

Figure 126: Western Europe Market Value Share (%) and BPS Analysis by Tour Type, 2023 to 2033

Figure 127: Western Europe Market Y-o-Y Growth (%) Projections by Tour Type, 2023 to 2033

Figure 128: Western Europe Market Value (US$ Million) Analysis by Consumer Orientation, 2018 to 2033

Figure 129: Western Europe Market Value Share (%) and BPS Analysis by Consumer Orientation, 2023 to 2033

Figure 130: Western Europe Market Y-o-Y Growth (%) Projections by Consumer Orientation, 2023 to 2033

Figure 131: Western Europe Market Value (US$ Million) Analysis by Age Group, 2018 to 2033

Figure 132: Western Europe Market Value Share (%) and BPS Analysis by Age Group, 2023 to 2033

Figure 133: Western Europe Market Y-o-Y Growth (%) Projections by Age Group, 2023 to 2033

Figure 134: Western Europe Market Attractiveness by Activity Type, 2023 to 2033

Figure 135: Western Europe Market Attractiveness by Booking Channel, 2023 to 2033

Figure 136: Western Europe Market Attractiveness by Tourist Type, 2023 to 2033

Figure 137: Western Europe Market Attractiveness by Tour Type, 2023 to 2033

Figure 138: Western Europe Market Attractiveness by Consumer Orientation, 2023 to 2033

Figure 139: Western Europe Market Attractiveness by Age Group, 2023 to 2033

Figure 140: Western Europe Market Attractiveness by Country, 2023 to 2033

Figure 141: Eastern Europe Market Value (US$ Million) by Activity Type, 2023 to 2033

Figure 142: Eastern Europe Market Value (US$ Million) by Booking Channel, 2023 to 2033

Figure 143: Eastern Europe Market Value (US$ Million) by Tourist Type, 2023 to 2033

Figure 144: Eastern Europe Market Value (US$ Million) by Tour Type, 2023 to 2033

Figure 145: Eastern Europe Market Value (US$ Million) by Consumer Orientation, 2023 to 2033

Figure 146: Eastern Europe Market Value (US$ Million) by Age Group, 2023 to 2033

Figure 147: Eastern Europe Market Value (US$ Million) by Country, 2023 to 2033

Figure 148: Eastern Europe Market Value (US$ Million) Analysis by Country, 2018 to 2033

Figure 149: Eastern Europe Market Value Share (%) and BPS Analysis by Country, 2023 to 2033

Figure 150: Eastern Europe Market Y-o-Y Growth (%) Projections by Country, 2023 to 2033

Figure 151: Eastern Europe Market Value (US$ Million) Analysis by Activity Type, 2018 to 2033

Figure 152: Eastern Europe Market Value Share (%) and BPS Analysis by Activity Type, 2023 to 2033

Figure 153: Eastern Europe Market Y-o-Y Growth (%) Projections by Activity Type, 2023 to 2033

Figure 154: Eastern Europe Market Value (US$ Million) Analysis by Booking Channel, 2018 to 2033

Figure 155: Eastern Europe Market Value Share (%) and BPS Analysis by Booking Channel, 2023 to 2033

Figure 156: Eastern Europe Market Y-o-Y Growth (%) Projections by Booking Channel, 2023 to 2033

Figure 157: Eastern Europe Market Value (US$ Million) Analysis by Tourist Type, 2018 to 2033

Figure 158: Eastern Europe Market Value Share (%) and BPS Analysis by Tourist Type, 2023 to 2033

Figure 159: Eastern Europe Market Y-o-Y Growth (%) Projections by Tourist Type, 2023 to 2033

Figure 160: Eastern Europe Market Value (US$ Million) Analysis by Tour Type, 2018 to 2033

Figure 161: Eastern Europe Market Value Share (%) and BPS Analysis by Tour Type, 2023 to 2033

Figure 162: Eastern Europe Market Y-o-Y Growth (%) Projections by Tour Type, 2023 to 2033

Figure 163: Eastern Europe Market Value (US$ Million) Analysis by Consumer Orientation, 2018 to 2033

Figure 164: Eastern Europe Market Value Share (%) and BPS Analysis by Consumer Orientation, 2023 to 2033

Figure 165: Eastern Europe Market Y-o-Y Growth (%) Projections by Consumer Orientation, 2023 to 2033

Figure 166: Eastern Europe Market Value (US$ Million) Analysis by Age Group, 2018 to 2033

Figure 167: Eastern Europe Market Value Share (%) and BPS Analysis by Age Group, 2023 to 2033

Figure 168: Eastern Europe Market Y-o-Y Growth (%) Projections by Age Group, 2023 to 2033

Figure 169: Eastern Europe Market Attractiveness by Activity Type, 2023 to 2033

Figure 170: Eastern Europe Market Attractiveness by Booking Channel, 2023 to 2033

Figure 171: Eastern Europe Market Attractiveness by Tourist Type, 2023 to 2033

Figure 172: Eastern Europe Market Attractiveness by Tour Type, 2023 to 2033

Figure 173: Eastern Europe Market Attractiveness by Consumer Orientation, 2023 to 2033

Figure 174: Eastern Europe Market Attractiveness by Age Group, 2023 to 2033

Figure 175: Eastern Europe Market Attractiveness by Country, 2023 to 2033

Figure 176: South Asia and Pacific Market Value (US$ Million) by Activity Type, 2023 to 2033

Figure 177: South Asia and Pacific Market Value (US$ Million) by Booking Channel, 2023 to 2033

Figure 178: South Asia and Pacific Market Value (US$ Million) by Tourist Type, 2023 to 2033

Figure 179: South Asia and Pacific Market Value (US$ Million) by Tour Type, 2023 to 2033

Figure 180: South Asia and Pacific Market Value (US$ Million) by Consumer Orientation, 2023 to 2033

Figure 181: South Asia and Pacific Market Value (US$ Million) by Age Group, 2023 to 2033

Figure 182: South Asia and Pacific Market Value (US$ Million) by Country, 2023 to 2033

Figure 183: South Asia and Pacific Market Value (US$ Million) Analysis by Country, 2018 to 2033

Figure 184: South Asia and Pacific Market Value Share (%) and BPS Analysis by Country, 2023 to 2033

Figure 185: South Asia and Pacific Market Y-o-Y Growth (%) Projections by Country, 2023 to 2033

Figure 186: South Asia and Pacific Market Value (US$ Million) Analysis by Activity Type, 2018 to 2033

Figure 187: South Asia and Pacific Market Value Share (%) and BPS Analysis by Activity Type, 2023 to 2033

Figure 188: South Asia and Pacific Market Y-o-Y Growth (%) Projections by Activity Type, 2023 to 2033

Figure 189: South Asia and Pacific Market Value (US$ Million) Analysis by Booking Channel, 2018 to 2033

Figure 190: South Asia and Pacific Market Value Share (%) and BPS Analysis by Booking Channel, 2023 to 2033

Figure 191: South Asia and Pacific Market Y-o-Y Growth (%) Projections by Booking Channel, 2023 to 2033

Figure 192: South Asia and Pacific Market Value (US$ Million) Analysis by Tourist Type, 2018 to 2033

Figure 193: South Asia and Pacific Market Value Share (%) and BPS Analysis by Tourist Type, 2023 to 2033

Figure 194: South Asia and Pacific Market Y-o-Y Growth (%) Projections by Tourist Type, 2023 to 2033

Figure 195: South Asia and Pacific Market Value (US$ Million) Analysis by Tour Type, 2018 to 2033

Figure 196: South Asia and Pacific Market Value Share (%) and BPS Analysis by Tour Type, 2023 to 2033

Figure 197: South Asia and Pacific Market Y-o-Y Growth (%) Projections by Tour Type, 2023 to 2033

Figure 198: South Asia and Pacific Market Value (US$ Million) Analysis by Consumer Orientation, 2018 to 2033

Figure 199: South Asia and Pacific Market Value Share (%) and BPS Analysis by Consumer Orientation, 2023 to 2033

Figure 200: South Asia and Pacific Market Y-o-Y Growth (%) Projections by Consumer Orientation, 2023 to 2033

Figure 201: South Asia and Pacific Market Value (US$ Million) Analysis by Age Group, 2018 to 2033

Figure 202: South Asia and Pacific Market Value Share (%) and BPS Analysis by Age Group, 2023 to 2033

Figure 203: South Asia and Pacific Market Y-o-Y Growth (%) Projections by Age Group, 2023 to 2033

Figure 204: South Asia and Pacific Market Attractiveness by Activity Type, 2023 to 2033

Figure 205: South Asia and Pacific Market Attractiveness by Booking Channel, 2023 to 2033

Figure 206: South Asia and Pacific Market Attractiveness by Tourist Type, 2023 to 2033

Figure 207: South Asia and Pacific Market Attractiveness by Tour Type, 2023 to 2033

Figure 208: South Asia and Pacific Market Attractiveness by Consumer Orientation, 2023 to 2033

Figure 209: South Asia and Pacific Market Attractiveness by Age Group, 2023 to 2033

Figure 210: South Asia and Pacific Market Attractiveness by Country, 2023 to 2033

Figure 211: East Asia Market Value (US$ Million) by Activity Type, 2023 to 2033

Figure 212: East Asia Market Value (US$ Million) by Booking Channel, 2023 to 2033

Figure 213: East Asia Market Value (US$ Million) by Tourist Type, 2023 to 2033

Figure 214: East Asia Market Value (US$ Million) by Tour Type, 2023 to 2033

Figure 215: East Asia Market Value (US$ Million) by Consumer Orientation, 2023 to 2033

Figure 216: East Asia Market Value (US$ Million) by Age Group, 2023 to 2033

Figure 217: East Asia Market Value (US$ Million) by Country, 2023 to 2033

Figure 218: East Asia Market Value (US$ Million) Analysis by Country, 2018 to 2033

Figure 219: East Asia Market Value Share (%) and BPS Analysis by Country, 2023 to 2033

Figure 220: East Asia Market Y-o-Y Growth (%) Projections by Country, 2023 to 2033

Figure 221: East Asia Market Value (US$ Million) Analysis by Activity Type, 2018 to 2033

Figure 222: East Asia Market Value Share (%) and BPS Analysis by Activity Type, 2023 to 2033

Figure 223: East Asia Market Y-o-Y Growth (%) Projections by Activity Type, 2023 to 2033

Figure 224: East Asia Market Value (US$ Million) Analysis by Booking Channel, 2018 to 2033

Figure 225: East Asia Market Value Share (%) and BPS Analysis by Booking Channel, 2023 to 2033

Figure 226: East Asia Market Y-o-Y Growth (%) Projections by Booking Channel, 2023 to 2033

Figure 227: East Asia Market Value (US$ Million) Analysis by Tourist Type, 2018 to 2033

Figure 228: East Asia Market Value Share (%) and BPS Analysis by Tourist Type, 2023 to 2033

Figure 229: East Asia Market Y-o-Y Growth (%) Projections by Tourist Type, 2023 to 2033

Figure 230: East Asia Market Value (US$ Million) Analysis by Tour Type, 2018 to 2033

Figure 231: East Asia Market Value Share (%) and BPS Analysis by Tour Type, 2023 to 2033

Figure 232: East Asia Market Y-o-Y Growth (%) Projections by Tour Type, 2023 to 2033

Figure 233: East Asia Market Value (US$ Million) Analysis by Consumer Orientation, 2018 to 2033

Figure 234: East Asia Market Value Share (%) and BPS Analysis by Consumer Orientation, 2023 to 2033

Figure 235: East Asia Market Y-o-Y Growth (%) Projections by Consumer Orientation, 2023 to 2033

Figure 236: East Asia Market Value (US$ Million) Analysis by Age Group, 2018 to 2033

Figure 237: East Asia Market Value Share (%) and BPS Analysis by Age Group, 2023 to 2033

Figure 238: East Asia Market Y-o-Y Growth (%) Projections by Age Group, 2023 to 2033

Figure 239: East Asia Market Attractiveness by Activity Type, 2023 to 2033

Figure 240: East Asia Market Attractiveness by Booking Channel, 2023 to 2033

Figure 241: East Asia Market Attractiveness by Tourist Type, 2023 to 2033

Figure 242: East Asia Market Attractiveness by Tour Type, 2023 to 2033

Figure 243: East Asia Market Attractiveness by Consumer Orientation, 2023 to 2033

Figure 244: East Asia Market Attractiveness by Age Group, 2023 to 2033

Figure 245: East Asia Market Attractiveness by Country, 2023 to 2033

Figure 246: Middle East and Africa Market Value (US$ Million) by Activity Type, 2023 to 2033

Figure 247: Middle East and Africa Market Value (US$ Million) by Booking Channel, 2023 to 2033

Figure 248: Middle East and Africa Market Value (US$ Million) by Tourist Type, 2023 to 2033

Figure 249: Middle East and Africa Market Value (US$ Million) by Tour Type, 2023 to 2033

Figure 250: Middle East and Africa Market Value (US$ Million) by Consumer Orientation, 2023 to 2033

Figure 251: Middle East and Africa Market Value (US$ Million) by Age Group, 2023 to 2033

Figure 252: Middle East and Africa Market Value (US$ Million) by Country, 2023 to 2033

Figure 253: Middle East and Africa Market Value (US$ Million) Analysis by Country, 2018 to 2033

Figure 254: Middle East and Africa Market Value Share (%) and BPS Analysis by Country, 2023 to 2033

Figure 255: Middle East and Africa Market Y-o-Y Growth (%) Projections by Country, 2023 to 2033

Figure 256: Middle East and Africa Market Value (US$ Million) Analysis by Activity Type, 2018 to 2033

Figure 257: Middle East and Africa Market Value Share (%) and BPS Analysis by Activity Type, 2023 to 2033

Figure 258: Middle East and Africa Market Y-o-Y Growth (%) Projections by Activity Type, 2023 to 2033

Figure 259: Middle East and Africa Market Value (US$ Million) Analysis by Booking Channel, 2018 to 2033

Figure 260: Middle East and Africa Market Value Share (%) and BPS Analysis by Booking Channel, 2023 to 2033

Figure 261: Middle East and Africa Market Y-o-Y Growth (%) Projections by Booking Channel, 2023 to 2033

Figure 262: Middle East and Africa Market Value (US$ Million) Analysis by Tourist Type, 2018 to 2033

Figure 263: Middle East and Africa Market Value Share (%) and BPS Analysis by Tourist Type, 2023 to 2033

Figure 264: Middle East and Africa Market Y-o-Y Growth (%) Projections by Tourist Type, 2023 to 2033

Figure 265: Middle East and Africa Market Value (US$ Million) Analysis by Tour Type, 2018 to 2033

Figure 266: Middle East and Africa Market Value Share (%) and BPS Analysis by Tour Type, 2023 to 2033

Figure 267: Middle East and Africa Market Y-o-Y Growth (%) Projections by Tour Type, 2023 to 2033

Figure 268: Middle East and Africa Market Value (US$ Million) Analysis by Consumer Orientation, 2018 to 2033

Figure 269: Middle East and Africa Market Value Share (%) and BPS Analysis by Consumer Orientation, 2023 to 2033

Figure 270: Middle East and Africa Market Y-o-Y Growth (%) Projections by Consumer Orientation, 2023 to 2033

Figure 271: Middle East and Africa Market Value (US$ Million) Analysis by Age Group, 2018 to 2033

Figure 272: Middle East and Africa Market Value Share (%) and BPS Analysis by Age Group, 2023 to 2033

Figure 273: Middle East and Africa Market Y-o-Y Growth (%) Projections by Age Group, 2023 to 2033

Figure 274: Middle East and Africa Market Attractiveness by Activity Type, 2023 to 2033

Figure 275: Middle East and Africa Market Attractiveness by Booking Channel, 2023 to 2033

Figure 276: Middle East and Africa Market Attractiveness by Tourist Type, 2023 to 2033

Figure 277: Middle East and Africa Market Attractiveness by Tour Type, 2023 to 2033

Figure 278: Middle East and Africa Market Attractiveness by Consumer Orientation, 2023 to 2033

Figure 279: Middle East and Africa Market Attractiveness by Age Group, 2023 to 2033

Figure 280: Middle East and Africa Market Attractiveness by Country, 2023 to 2033

Recommendations

Travel and Tourism

Culinary Tourism Market

Published : November 2023

Travel and Tourism

India Culinary Tourism Market

Published : August 2023

Explore Travel and Tourism Insights

View Reports

Food Tourism Sector Market