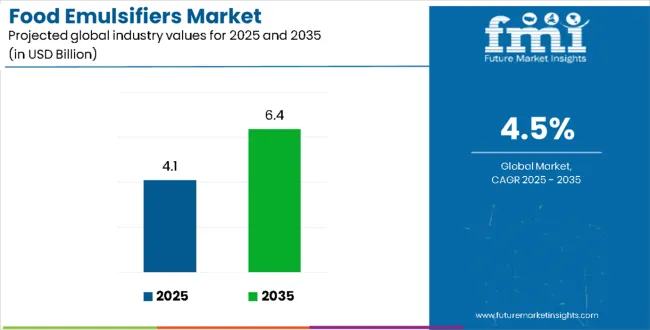
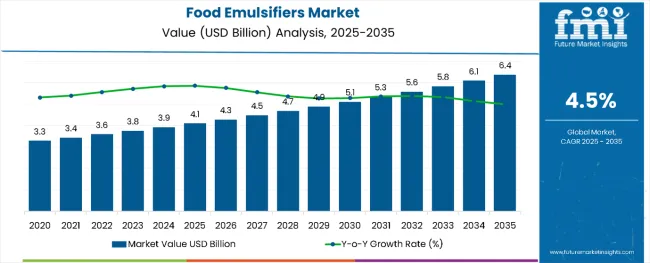
The global food emulsifiers market is valued at USD 4.1 billion in 2025 and is anticipated toreach USD 6.4 billion by 2035, recording an absolute increase of USD 2.3 billion over the forecast period. This translates into a total growth of 56.1%, with the market forecast to expand at a compound annual growth rate (CAGR) of 4.5% between 2025 and 2035. The overall market size is expected to grow by nearly 1.56X during the same period, supported by the rising demand for processed foods and increasing application across diverse food manufacturing industries.
Food Emulsifiers Market Key Takeaways
| Metric | Value |
|---|---|
| Food Emulsifiers Market Value (2025) | USD 4.1 billion |
| Food Emulsifiers Market Forecast Value (2035) | USD 6.4 billion |
| Food Emulsifiers Market Forecast CAGR | 4.5% |
Between 2025 and 2030, the food emulsifiers market is projected to expand from USD 4.1 billion to USD 5.1 billion, resulting in a value increase of USD 1.0 billion, which represents 43.5% of the total forecast growth for the decade. This phase of growth will be shaped by expanding food processing industries, growing consumer preference for convenient food products, and increasing adoption of plant-based emulsifiers. Food manufacturers are incorporating emulsifiers into various formulations to improve texture, extend shelf life, and enhance product stability across different applications.
From 2030 to 2035, the market is forecast to grow from USD 5.1 billion to USD 6.4 billion, adding another USD 1.3 billion, which constitutes 56.5% of the overall ten-year expansion. This period is expected to be characterized by expansion into emerging markets, development of specialized emulsifier variants for clean label products, and increased penetration in bakery and confectionery applications. The growing adoption of functional foods and premium food products will drive demand for high-quality emulsifiers with enhanced performance characteristics.
Between 2020 and 2025, the food emulsifiers market experienced steady expansion, driven by increasing consumption of processed foods and growing awareness of emulsifiers' functional benefits in food manufacturing. The market developed as food manufacturers recognized the importance of emulsifiers in improving product quality, consistency, and consumer appeal. Global supply chain optimization and technological advancements in emulsifier production enabled manufacturers to meet growing demand while maintaining cost effectiveness and quality standards across diverse application segments.
The food emulsifiers market's growth trajectory is further supported by technological advancements in extraction and purification processes that enhance emulsifier functionality while meeting clean label requirements. Manufacturing innovations are enabling production of natural emulsifiers with improved stability and performance characteristics, making them increasingly attractive for premium food applications. Regional market dynamics vary significantly, with developed markets focusing on natural and organic variants while emerging economies prioritize cost-effective solutions for mass market food production. The convergence of health trends, regulatory compliance, and functional performance requirements positions food emulsifiers as essential ingredients for manufacturers seeking to meet evolving consumer demands.
Market expansion is being supported by the rapid growth of the global food processing industry and increasing consumer demand for convenient, shelf-stable food products that maintain quality and taste. Food emulsifiers play crucial roles in improving texture, preventing ingredient separation, and extending product shelf life across diverse applications including bakery products, dairy items, confectionery, and processed foods. The growing complexity of food formulations and consumer expectations for consistent product quality are driving demand for specialized emulsifiers that can deliver specific functional benefits.
The expanding bakery and confectionery industries, particularly in emerging markets, are creating significant opportunities for emulsifier manufacturers to develop specialized products that improve dough handling, volume, and texture in baked goods. Additionally, the rising popularity of plant-based foods and clean label products is driving innovation in natural emulsifier development, while regulatory requirements for food safety and quality are establishing standardized usage guidelines that support market growth and product acceptance.
The market is segmented by source, product type, application, and region. By source, the market is bifurcated into plant-derived and animal-derived emulsifiers. Based on product type, the market is categorized into lecithin, derivatives of mono and di-glycerides, sorbitan esters, polyglycerol esters, stearoyl lactylates, and others. In terms of application, the market is categorized into bakeries, confectionaries, dairy products, functional foods, salads and sauces, infant formula, and others.Regionally, the market is divided into North America, Europe, East Asia, South Asia & Pacific, Latin America, and Middle East & Africa.
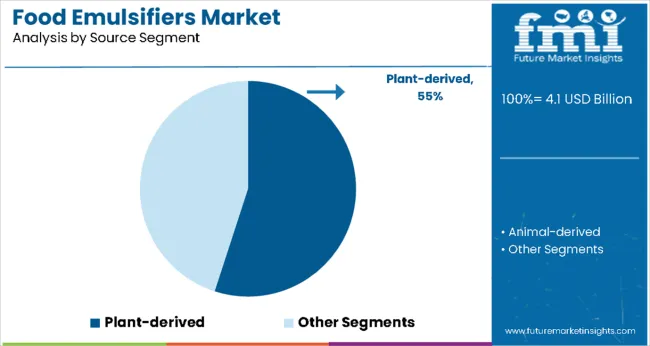
Plant-derived emulsifiers are projected to account for 55% of the food emulsifiers market in 2025. This leading share is supported by the growing consumer preference for natural and plant-based ingredients, along with increasing regulatory support for clean label products. Plant-derived emulsifiers offer excellent functionality while meeting consumer demands for sustainable and environmentally friendly food ingredients. The segment benefits from abundant raw material availability and established extraction technologies that ensure consistent quality and performance.
Plant-derived emulsifiers provide optimal functionality across diverse food applications while addressing consumer concerns about synthetic additives and animal-derived ingredients. Food manufacturers increasingly prefer plant-based variants for applications requiring natural ingredient declarations, particularly in organic and premium product segments where authenticity and sustainability are essential for consumer acceptance and market positioning.
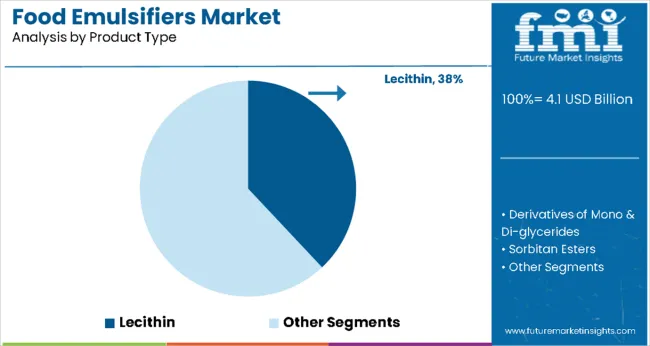
Lecithin is expected to represent 38% of food emulsifier demand in 2025. This dominant share reflects the widespread application of lecithin across multiple food categories and its excellent emulsification properties that improve product texture and stability. Lecithin serves as a versatile ingredient in chocolate production, bakery applications, and dietary supplements, offering both functional benefits and clean label appeal that aligns with consumer preferences for recognizable ingredients.
The segment benefits from well-established supply chains, diverse sourcing options including soy, sunflower, and rapeseed, and extensive research supporting its safety and efficacy. Food processors value lecithin for its ability to reduce mixing time, improve dough handling characteristics, and enhance product shelf life while maintaining cost effectiveness across various manufacturing applications.
Write-up
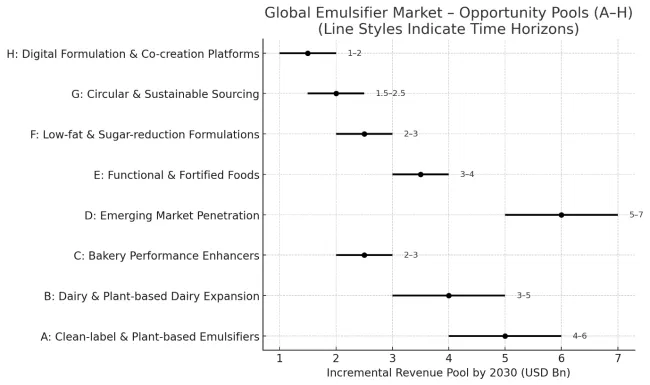
The food emulsifiers market is entering a transformative decade. Rising demand for clean labels, plant-based diets, and functional nutrition is reshaping both formulations and sourcing. Together, these growth pathways unlock USD 22-32 billion in incremental revenue by 2030.
Pathway A - Clean-label & Plant-based Emulsifiers. Natural lecithins (sunflower, oat), pea proteins, and algal extracts are replacing synthetics as consumer scrutiny on labels intensifies. This segment leads with a revenue pool of USD 4-6 billion by 2030.
Pathway B - Dairy & Plant-based Dairy. From premium ice cream textures to oat and soy milk stability, emulsifiers are indispensable. Rapid growth in plant-based dairy doubles the opportunity. Expected revenue: USD 3-5 billion.
Pathway C - Bakery Performance Enhancers. Formulated emulsifier blends enhance softness, freshness, and volume in baked goods, critical for packaged breads and pastries. Incremental pool: USD 2-3 billion.
Pathway D - Emerging Market Penetration. Asia, Latin America, and Africa are seeing surging demand for processed and convenience foods. Market expansion adds USD 5-7 billion.
Pathway E - Functional & Fortified Foods. Emulsifiers enabling stable nutritional beverages, infant formulas, and protein shakes capture a high-value niche. Revenue potential: USD 3-4 billion.
Pathway F - Low-fat & Sugar Reduction. Texture and mouthfeel retention despite calorie reduction drive demand for innovative emulsifier systems. Incremental value: USD 2-3 billion.
Pathway G - Circular & Sustainable Sourcing. By-products from oilseeds, rice, and algae are valorized into cost-effective, low-carbon emulsifiers. Sustainability tailwinds push USD 1.5-2.5 billion.
Pathway H - Digital Formulation Platforms.AI-based recipe design, co-creation with CPG brands, and digital twin modeling of food matrices represent the future. Smaller but fast-growing pool of USD 1-2 billion.
The food emulsifiers market is advancing steadily due to increasing processed food consumption and growing demand for functional ingredients that improve food quality and shelf life. However, the market faces challenges including fluctuating raw material prices, regulatory restrictions on certain synthetic emulsifiers, and consumer concerns about additive usage in food products. Clean label trends and sustainable sourcing requirements continue to influence product development and market positioning strategies.
Expansion of Clean Label and Natural Emulsifier Solutions
The growing demand for clean label products is driving development of natural emulsifier alternatives that provide similar functionality to synthetic variants while meeting consumer expectations for ingredient transparency. Food manufacturers are reformulating products to incorporate plant-derived emulsifiers that support clean label claims without compromising product quality or shelf life. These developments enable premium positioning and market differentiation in health-conscious consumer segments.
Integration of Advanced Processing Technologies
Modern emulsifier manufacturers are implementing advanced extraction and purification technologies that improve product purity, functionality, and consistency while reducing environmental impact. Enhanced processing methods enable production of specialized emulsifier blends that address specific application requirements and performance criteria. These technological improvements support expansion into new food categories and geographic markets while maintaining competitive cost structures.
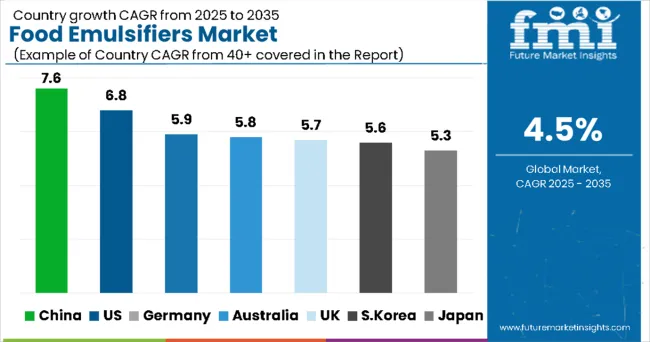
| Countries | CAGR |
|---|---|
| China | 7.6% |
| United States | 6.8% |
| Germany | 5.9% |
| Australia-New Zealand | 5.8% |
| United Kingdom | 5.7% |
| South Korea | 5.6% |
| Japan | 5.3% |
The global food emulsifiers market shows varying growth dynamics across key regions. China leads with the highest growth potential, driven by rapid expansion of food processing industries, rising urbanization, and a growing middle class, capturing a 7.6% market share. The United States follows with a 6.8% share, benefiting from technological innovation, clean label trends, and strong R&D capabilities. Germany holds a 5.9% share, emphasizing quality, sustainability, and premium product development, while Australia-New Zealand, at 5.8%, leverages agricultural integration and natural ingredient focus. The United Kingdom records a 5.7% share, fueled by premium applications and innovation in artisanal and functional foods. South Korea’s 5.6% share is supported by modernization of its food industry and export opportunities, whereas Japan, with 5.3%, focuses on product functionality, quality, and functional food trends.
The report covers an in-depth analysis of 40+ countries; seven top-performing OECD countries are highlighted below.
Revenue from food emulsifiers in China is projected to exhibit strong growth with a 7.6% market share, driven by rapid expansion of food processing industries and increasing consumer demand for packaged foods. The country's growing middle class and urbanization trends are creating demand for convenient food products that incorporate emulsifiers for improved quality and shelf life. Major food manufacturers are establishing production facilities to serve both domestic and export markets with cost-effective emulsifier solutions.
Government initiatives supporting food industry modernization and food safety regulations are encouraging investment in advanced emulsifier production technologies. The expanding bakery and confectionery sectors, along with growing dairy processing capabilities, are creating new application opportunities for emulsifier manufacturers throughout major industrial regions and metropolitan areas. Food processing industry development programs are facilitating adoption of modern emulsifier technologies that enhance product quality and manufacturing efficiency across production facilities.
Revenue from food emulsifiers in the United States is expanding with a 6.8% market share, supported by the country's advanced food processing industry and emphasis on product innovation. American manufacturers are developing specialized emulsifier formulations that address specific functional requirements while meeting clean label and regulatory compliance standards. The market benefits from extensive research and development capabilities and established supply chain networks.
Food technology companies are investing in natural emulsifier development and sustainable sourcing initiatives that align with consumer preferences for environmentally responsible products. The expanding organic food segment and growing demand for plant-based alternatives are creating opportunities for innovative emulsifier solutions that support market differentiation and premium positioning. Food technology innovation programs are advancing emulsifier development that improves functionality while meeting clean label requirements and consumer expectations for natural ingredients.
Demand for food emulsifiers in Germany is projected with a 5.9% market share, supported by the country's emphasis on food quality and technological innovation in food processing. German manufacturers are developing high-quality emulsifier products that meet stringent European food safety standards and consumer expectations for premium ingredients. The market is characterized by focus on natural and sustainable variants that align with environmental consciousness and regulatory requirements.
Food technology research and development activities are advancing emulsifier applications in specialized food segments and premium product categories. German companies are investing in sustainable production methods and innovative formulations that extend functionality while maintaining environmental responsibility and quality assurance throughout manufacturing processes. Advanced food processing technologies are enabling production of specialized emulsifier variants that meet specific application requirements across diverse food manufacturing sectors.
Demand for food emulsifiers in Australia-New Zealand is growing with a 5.8% market share, driven by the region's strong agricultural sector and emphasis on natural food ingredients. Manufacturers are developing emulsifier products that leverage local agricultural resources while meeting international quality standards for export markets. The market benefits from established dairy and agricultural industries that provide raw materials for emulsifier production.
Food processing companies are integrating emulsifiers into diverse applications including dairy products, bakery items, and specialty foods that cater to premium market segments. The growing emphasis on clean label products and natural ingredients is creating opportunities for plant-derived emulsifiers that align with consumer preferences and regulatory requirements. Agricultural sector integration initiatives are supporting development of locally sourced emulsifier products that meet quality standards while reducing supply chain dependencies.
Demand for food emulsifiers in the United Kingdom is expanding with a 5.7% market share, supported by increasing consumer interest in premium food products and innovative food formulations. British manufacturers are developing emulsifier solutions for specialized applications including artisanal bakery products, premium confectionery, and functional foods. The market is characterized by emphasis on quality and performance characteristics that appeal to discerning consumers.
Food retailers and specialty manufacturers are expanding emulsifier applications to meet growing demand for high-quality processed foods that maintain texture and freshness. The increasing prevalence of clean label requirements and consumer awareness of ingredient functionality are driving adoption of natural emulsifiers in premium food applications. Premium product development initiatives are focusing on enhancing food quality and consumer experience through specialized emulsifier applications and innovative formulations.
Revenue from food emulsifiers in South Korea is growing with a 5.6% market share, supported by the country's expanding food processing industry and increasing consumer demand for convenient food products. Korean manufacturers are developing emulsifier products that cater to local taste preferences while incorporating international quality standards. The market benefits from technological advancement and growing export opportunities.
Food processing companies are investing in modern production facilities that utilize advanced emulsifier technologies to improve product quality and manufacturing efficiency. The expanding bakery and confectionery sectors, along with growing demand for processed foods, are creating new application opportunities for specialized emulsifier solutions. Food industry modernization programs are facilitating technology adoption and quality improvements that enhance emulsifier production capabilities across manufacturing facilities.
Revenue from food emulsifiers in Japan is projected with a 5.3% market share, driven by the country's sophisticated food culture and emphasis on product quality and functionality. Japanese manufacturers are developing specialized emulsifier formulations that meet stringent quality requirements while providing enhanced performance characteristics. The market is characterized by focus on premium applications and technological innovation.
Food companies are incorporating advanced emulsifier technologies into traditional and modern food products that cater to evolving consumer preferences. The aging population and health consciousness trends are creating demand for functional food ingredients that provide nutritional benefits while maintaining taste and quality expectations. Quality assurance programs are ensuring comprehensive technical excellence and performance standards that support specialized emulsifier applications across diverse food categories.
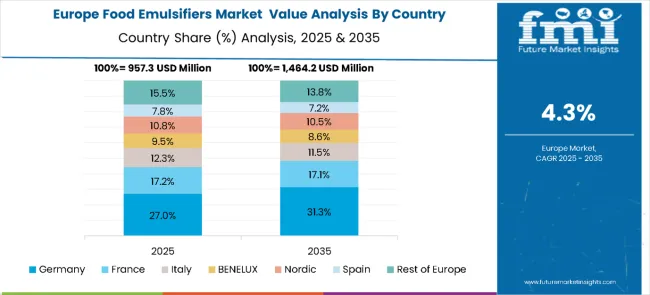
The food emulsifiers market in Europe is projected to grow from USD 957.3 million in 2025 to USD 1,464.2 million by 2035, registering a CAGR of 4.3% over the forecast period. Germany is expected to dominate with a 27.0% share in 2025, followed by France at 17.2%, reflecting strong demand in the bakery, confectionery, and processed food industries. Italy accounts for 12.3% of the market, while the BENELUX region holds 9.5% and the Nordic countries contribute 10.8%.
Spain represents 7.8%, while the Rest of Europe collectively makes up 15.5%. By 2035, Germany will further expand its lead to 31.3%, France will remain steady at 17.1%, and Italy will hold 11.5%. BENELUX and the Nordic countries are projected at 8.6% and 10.5%, respectively, while Spain will account for 7.2%, and the Rest of Europe will represent 13.8%, highlighting a gradual consolidation of demand in the region’s largest food processing markets.
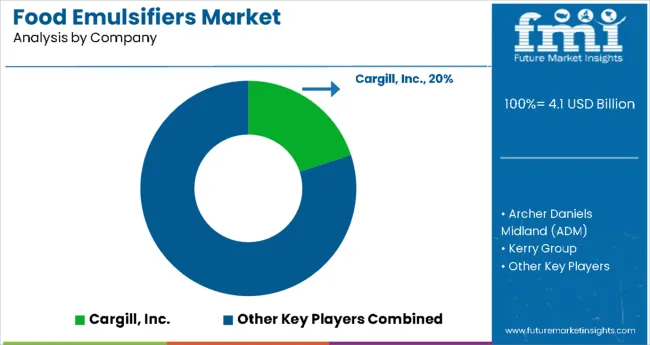
The food emulsifiers market is characterized by competition among established chemical companies, specialty ingredient manufacturers, and agricultural processing firms. Companies are investing in natural product development, sustainable sourcing, and advanced processing technologies to deliver high-quality emulsifier solutions that meet diverse application requirements and regulatory standards.
Major players focus on developing specialized emulsifier formulations, expanding production capacity, and establishing strategic partnerships with food manufacturers to strengthen market presence. Technological innovation, supply chain optimization, and geographic expansion are central to competitive positioning and market growth strategies.
Food emulsifiers are no longer just background additives; they are becoming strategic enablers of modern food innovation. Their role spans bakery, dairy, confectionery, beverages, and emerging plant-based and functional foods. As consumer demand shifts toward clean-label, allergen-free, and bio-based options, the market must navigate regulation, technology upgrades, and sustainability pressures. Coordinated efforts among governments, trade organizations, manufacturers, suppliers, and investors will determine how this category scales into the next decade.
Key Players in the Food Emulsifiers Market
| Items | Values |
|---|---|
| Quantitative Units (2025) | USD 4.1 Billion |
| Source | Plant-derived, Animal-derived |
| Product Type | Lecithin, Derivatives of Mono & Di-glycerides, Sorbitan Esters, Polyglycerol Esters, Stearoyl Lactylates, Others |
| Application | Bakeries, Confectioneries, Dairy Products, Functional Foods, Salads and Sauces, Infant Formula, Others |
| Regions Covered | North America, Europe, East Asia, South Asia & Pacific, Latin America, Middle East & Africa |
| Countr ies Covered | China, United States, Germany, Australia-New Zealand, United Kingdom, South Korea, Japan, and 40+ countries |
| Key Companies Profiled | Archer-Daniels-Midland Company, Koninklijke DSM N.V, Cargill Inc., BASF SE, Ingredion Incorporated, Kerry Group Plc., E.I. DuPont de Nemours and Company, Lonza Group AG, Puratos Group, Wilmar International Limited |
| Additional Attributes | Dollar sales by source and product type, regional demand trends across major markets, competitive landscape analysis, technological innovations in emulsifier production, regulatory compliance requirements, and emerging applications in clean label and functional food products. |
The overall market size for food emulsifiers market was USD 4.12 billion in 2025.
The food emulsifiers market is expected to reach USD 6.44 billion in 2035.
Rising demand for clean-label, plant-based ingredients, processed foods, bakery growth, texture improvement, and shelf-life extension will drive emulsifier demand.
The top 5 countries which drives the development of food emulsifiers market are USA, European Union, Japan, South Korea and UK.
Mono and Di glyceride Derivatives demand supplier to command significant share over the assessment period.


Our Research Products

The "Full Research Suite" delivers actionable market intel, deep dives on markets or technologies, so clients act faster, cut risk, and unlock growth.

The Leaderboard benchmarks and ranks top vendors, classifying them as Established Leaders, Leading Challengers, or Disruptors & Challengers.

Locates where complements amplify value and substitutes erode it, forecasting net impact by horizon

We deliver granular, decision-grade intel: market sizing, 5-year forecasts, pricing, adoption, usage, revenue, and operational KPIs—plus competitor tracking, regulation, and value chains—across 60 countries broadly.

Spot the shifts before they hit your P&L. We track inflection points, adoption curves, pricing moves, and ecosystem plays to show where demand is heading, why it is changing, and what to do next across high-growth markets and disruptive tech

Real-time reads of user behavior. We track shifting priorities, perceptions of today’s and next-gen services, and provider experience, then pace how fast tech moves from trial to adoption, blending buyer, consumer, and channel inputs with social signals (#WhySwitch, #UX).

Partner with our analyst team to build a custom report designed around your business priorities. From analysing market trends to assessing competitors or crafting bespoke datasets, we tailor insights to your needs.
Supplier Intelligence
Discovery & Profiling
Capacity & Footprint
Performance & Risk
Compliance & Governance
Commercial Readiness
Who Supplies Whom
Scorecards & Shortlists
Playbooks & Docs
Category Intelligence
Definition & Scope
Demand & Use Cases
Cost Drivers
Market Structure
Supply Chain Map
Trade & Policy
Operating Norms
Deliverables
Buyer Intelligence
Account Basics
Spend & Scope
Procurement Model
Vendor Requirements
Terms & Policies
Entry Strategy
Pain Points & Triggers
Outputs
Pricing Analysis
Benchmarks
Trends
Should-Cost
Indexation
Landed Cost
Commercial Terms
Deliverables
Brand Analysis
Positioning & Value Prop
Share & Presence
Customer Evidence
Go-to-Market
Digital & Reputation
Compliance & Trust
KPIs & Gaps
Outputs
Full Research Suite comprises of:
Market outlook & trends analysis
Interviews & case studies
Strategic recommendations
Vendor profiles & capabilities analysis
5-year forecasts
8 regions and 60+ country-level data splits
Market segment data splits
12 months of continuous data updates
DELIVERED AS:
PDF EXCEL ONLINE
Demand for Food Emulsifiers in EU Size and Share Forecast Outlook 2025 to 2035
Food & Beverage OEE Software Market Size and Share Forecast Outlook 2025 to 2035
Food Grade Crosslinked Polyvinylpolypyrrolidone (PVPP) Market Size and Share Forecast Outlook 2025 to 2035
Food Grade Cassia Gum Powder Market Size and Share Forecast Outlook 2025 to 2035
Food Grade Dry Film Lubricant Market Size and Share Forecast Outlook 2025 to 2035
Foodservice Equipment Market Analysis - Size, Share, and Forecast Outlook 2025 to 2035
Food Basket Market Forecast and Outlook 2025 to 2035
Food Grade Tremella Polysaccharide Market Size and Share Forecast Outlook 2025 to 2035
Food Sorting Machine Market Size and Share Forecast Outlook 2025 to 2035
Foodservice Paper Bag Market Size and Share Forecast Outlook 2025 to 2035
Food Stabilizers Market Size and Share Forecast Outlook 2025 to 2035
Food Packaging Film Market Size and Share Forecast Outlook 2025 to 2035
Food Certification Market Size and Share Forecast Outlook 2025 to 2035
Food Tray Market Size and Share Forecast Outlook 2025 to 2035
Food & Beverage Industrial Disinfection and Cleaning Market Size and Share Forecast Outlook 2025 to 2035
Food Technology Market Size and Share Forecast Outlook 2025 to 2035
Food Tourism Sector Market Size and Share Forecast Outlook 2025 to 2035
Food Processing Boiler Market Size and Share Forecast Outlook 2025 to 2035
Food Packaging Machines Market Size and Share Forecast Outlook 2025 to 2035
Food Minerals Market Size and Share Forecast Outlook 2025 to 2035

Thank you!
You will receive an email from our Business Development Manager. Please be sure to check your SPAM/JUNK folder too.
Chat With
MaRIA