Food Waste-Derived Protein Size and Share Forecast Outlook 2025 to 2035

The food-waste derived protein market is expected to be valued at USD 135.6 million in 2025 and is projected to reach USD 242.2 million by 2035. This anticipated increase of USD 106.6 million reflects a market expansion of over 78.6% during the decade. A steady compound annual growth rate (CAGR) of 6.0% is forecasted, suggesting that the market is likely to achieve nearly a 2X size increase within ten years.
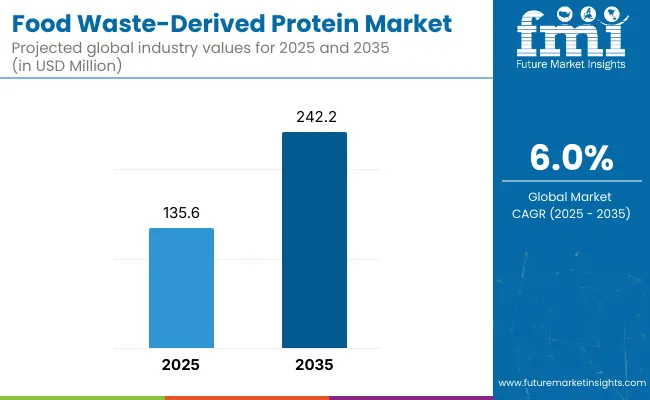
Quick Stats for Food Waste-Derived Protein

  • Food Waste-Derived Protein Value (2025): USD 135.6 million
  • Food Waste-Derived Protein Forecast Value (2035): USD 242.2 million
  • Food Waste-Derived Protein Forecast CAGR: 6.0%
  • Leading Segment in Food Waste-Derived Protein in 2025, by Protein Source: Dairy & Cheese Whey Waste Protein (20%)
  • Key Growth Regions in the Food Waste-Derived Protein: North America, Asia-Pacific, Europe
  • Top Key Players in Food Waste-Derived Protein: InnovaFeed, Ynsect, Better Origin, Full Harvest, Renewal Mill, Envergent Technologies, Spero Foods, Circular Protein, Green Protein

Food Waste Derived Protein Market

Food Waste-Derived Protein Key Takeaways

Metric Value
Estimated Value in (2025E) USD 135.6 million
Forecast Value in (2035F) USD 242.2 million
Forecast CAGR (2025 to 2035) 6.0%

Between 2025 and 2030, the market is projected to rise from USD 135.6 million to approximately USD 180.8 million, contributing USD 45.2 million or about 42.4% of the decade's total growth. During this period, demand is expected to be fueled by circular economy mandates, food industry waste valorization programs, and increasing functional food innovation. Fruit, vegetable, and cereal waste streams are anticipated to dominate volume adoption due to their high nutrient retention and availability across food supply chains.

The second phase from 2030 to 2035 is expected to contribute an additional USD 61.4 million in revenue, equivalent to 57.6% of the total growth, as the market grows from USD 180.8 million to USD 242.2 million. This phase will likely be driven by advancements in precision fermentation, enzymatic hydrolysis, and biorefinery integration.

A shift toward localized bioprocessing units and traceability-compliant protein ingredients is expected to accelerate commercialization across both developed and emerging economies. The market’s maturity will be supported by regulatory standardization, nutritional validation, and improved downstream scalability.

From 2020 to 2024, the Food-Waste Derived Protein Market expanded from ~USD 125.5 million to USD 135.6 million, driven largely by regulatory support and ESG-aligned reformulations in food and feed sectors. During this period, protein manufacturers converting high-volume waste streams particularly insect-based players captured nearly 30-35% of global revenue. Companies such as InnovaFeed, Ynsect, and Better Origin led the field through vertical integration and scalable bioconversion infrastructure.

Competitive advantage was anchored in volume capacity, regulatory compliance, and alignment with zero-waste and circular economy frameworks. Functional protein inclusion in sports, elderly, and animal nutrition products surged, while industrial and cosmetic applications remained nascent. As the market heads toward USD 242.2 million by 2035, growth is expected to be reshaped by subscription-based ingredient supply models, biorefinery integrations, and functional performance standards.

Legacy players must pivot beyond bulk protein delivery toward ingredient traceability, clean-label compliance, and functional differentiation. Competitive strength is now expected to depend on ecosystem partnerships, traceability platforms, and product customization aligned with end-use precision and nutritional integrity.

Why the Food Waste-Derived Protein is growing?

Significant growth in the food-waste derived protein market has been driven by the rising urgency to reduce food system inefficiencies and enhance resource circularity. Regulatory mandates on organic waste reduction and sustainable sourcing have been enacted across major economies, creating a strong policy tailwind.

As traditional protein inputs face environmental scrutiny, food-waste streams are being repositioned as viable, nutrient-dense alternatives. Advances in enzymatic hydrolysis and fermentation-based recovery have enabled greater extraction efficiency and consistency in amino acid profiles.

Demand has been further supported by heightened consumer interest in clean-label, upcycled, and environmentally responsible ingredients. Applications in functional foods, nutraceuticals, and animal feed have been prioritized by manufacturers seeking to meet sustainability targets.

Integration into B2B ingredient platforms and closed-loop processing systems is expected to scale adoption across industries. Growth is anticipated to be led by plant-based proteins, fermentation-based extraction technologies, and food & beverage applications, owing to their scalability, versatility, and growing mainstream acceptance.

Segmental Analysis

The food-waste derived protein market has been segmented across six key categories: protein source, protein type, processing technology, product form, application, and sales channel. These segments define the upstream availability, technological pathway, and commercial integration of food-waste valorization.

The protein source segment classifies inputs such as fruit, vegetable, grain, dairy, and meat waste, reflecting the diversity of feedstock supply. Protein type segmentation distinguishes between animal-based, plant-based, and mixed proteins, which are processed and positioned differently in functional food and feed applications.

Processing technology segmentation, including enzymatic hydrolysis and fermentation-based recovery, outlines the core methods enabling waste-to-protein conversion. Each segment offers unique drivers of scale, nutritional performance, and end-market alignment providing a multidimensional framework for competitive and operational analysis.
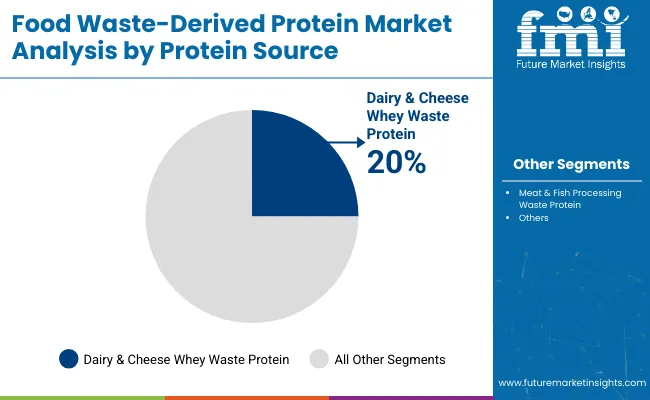
Insights into the Protein Source Segment with Dairy & Cheese Whey Waste Protein Leading in Market Share

Food Waste Derived Protein Market By Protien Source

Protein Source Segment Market Value Share, 2025
Dairy & Cheese Whey Waste Protein 20.0%
Meat & Fish Processing Waste Protein 18.0%

In 2025, dairy and cheese whey waste protein has been projected to hold the largest share at 20%, driven by its proven nutritional density, high protein yield, and integration with ultrafiltration and enzymatic systems. These proteins have been increasingly adopted for infant nutrition, performance foods, and nutraceuticals where complete amino acid profiles are prioritized. Meat and fish processing waste protein has emerged as the second-leading source, especially in animal feed and functional hydrolysates.

Meanwhile, plant-based waste proteins from fruits, vegetables, legumes, and grains have been gaining ground as sustainable, allergen-friendly options for clean-label foods. Growth across these segments has been supported by global zero-waste policies, rising ingredient traceability standards, and investments in local biomass valorization platforms. Going forward, protein sourcing strategies are expected to be guided by cost-efficiency, carbon reduction metrics, and compatibility with decentralized bioprocessing models.
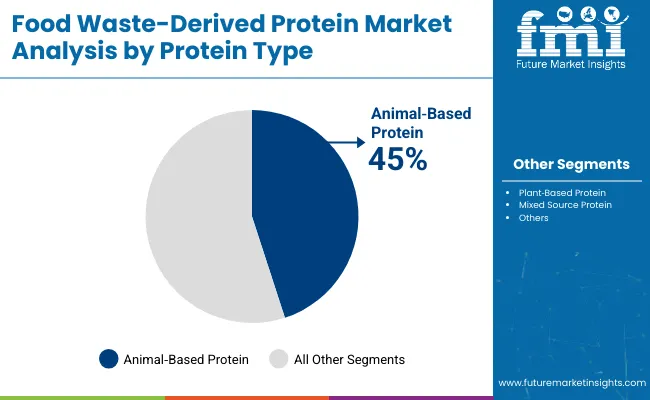
Insights into the Protein Type Segment with Animal Based Protein Dominating the Demand

Food Waste Derived Protein Market By Protien Type

Protein Type 2025 Share %
Animal Based Protein 45.0%
Plant Based Protein 40.0%
Mixed Source Protein 15.0%

Animal-based protein is expected to maintain a dominant share of 45% in 2025, attributed to the high protein content and functionality derived from dairy whey, meat, and fish waste. These proteins have been widely adopted in technical food, pet nutrition, and sports formulations where amino acid completeness and functional stability are required. However, the fastest growth is expected to come from plant-based protein, driven by the rising shift toward vegan diets, allergen-free nutrition, and environmentally-conscious formulations.

Waste streams from legumes, grains, and vegetables have been increasingly harnessed for protein extraction through enzymatic and microbial methods. Mixed-source proteins, typically created through blending or co-processing, have found utility in feed and aquaculture segments where cost and volume efficiency are prioritized. Over the coming years, market share dynamics are anticipated to shift in favor of plant-based proteins as novel extraction methods, flavor masking, and texturization technologies continue to mature.
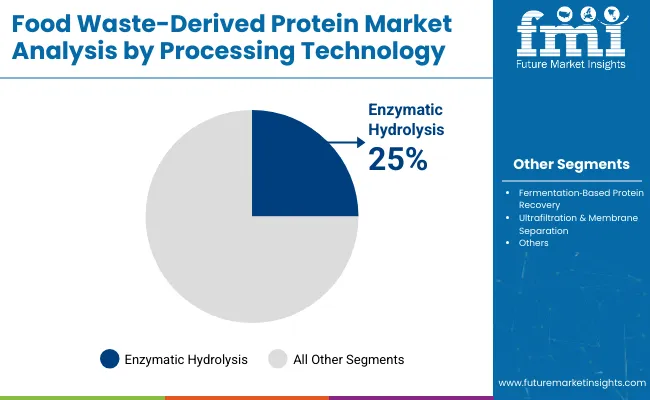
Insights into the Processing TechnologySegment with Focus on Enzymatic Hydrolysis

Food Waste Derived Protein Market By Process

Processing Technology 2025 Share %
Enzymatic Hydrolysis 25.0%
Fermentation Based Protein Recovery 22.0%
Ultrafiltration & Membrane Separation 20.0%

Enzymatic hydrolysis has been identified as the leading technology, expected to capture 25% of the market in 2025. Its prominence has been secured through its ability to convert complex proteins into bioavailable peptides with minimal nutrient loss and clean-label positioning. This method has been particularly favored in the production of hypoallergenic formulas and protein hydrolysates for dietary supplements. Fermentation-based recovery, close behind at 22%, has seen rapid adoption due to its capacity to improve digestibility and enhance protein stability.

The method has also aligned well with probiotic-infused formulations and circular fermentation ecosystems. Ultrafiltration and membrane separation have gained attention for their precision in fractionating protein concentrates, especially in dairy and plant applications. Drying and concentration technologies continue to support volume scalability, while chemical extraction has retained a niche presence for industrial-grade proteins. As cost-efficiency, bioactivity, and sustainability become critical selection criteria, enzymatic and fermentation platforms are projected to drive innovation leadership.

What are the Drivers, Restraints, and Key Trends of the Food Waste-Derived Protein?

Rising processing costs and regulatory uncertainty continue to challenge scalability in the food-waste derived protein market, even as demand surges across nutrition, feed, and wellness sectors for upcycled, sustainable proteins aligned with zero-waste goals and circular ingredient innovation.

Policy-Driven Valorization of Food Waste

Mandatory food waste reduction policies and landfill diversion laws have been enacted across major economies, driving the valorization of waste streams into high-value protein ingredients. Government initiatives promoting upcycled food and fiscal incentives for waste-to-value projects have been introduced to accelerate adoption.

Sustainability-linked procurement standards have been integrated into institutional food programs, further increasing demand for traceable, circular-sourced protein inputs. The market has been supported by cross-sector partnerships between municipalities, agri-processors, and food manufacturers. As regulatory pressure intensifies and reporting becomes mandatory, food companies are expected to integrate food-waste derived proteins as a core component of their sustainability and ESG disclosures.

Shift Toward Functional Protein Ingredients in Clean-Label Nutrition

Functional proteins derived from food waste are being positioned beyond commodity markets and are increasingly incorporated into specialized clean-label, plant-based, and performance nutrition applications. Market traction has been observed in fortified beverages, meal replacements, and gut-health-enhancing powders, where bioactive peptides and fiber-rich matrices are valued. Advanced extraction methods are enabling the preservation of functional compounds such as polyphenols and prebiotics alongside protein content. As consumer demand pivots toward multi-functional, transparent ingredients with environmental claims, food-waste proteins are being reformulated into high-margin, value-added offerings. The clean-label trend is expected to expand protein use cases and redefine quality benchmarks within this segment.
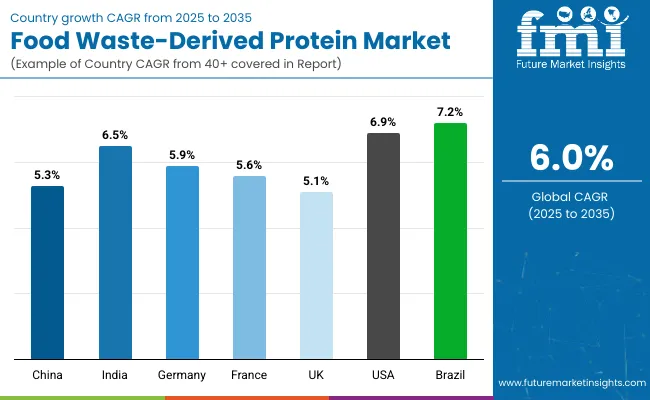
Analysis of Food Waste-Derived Prote in by Key Countries

Food Waste Derived Protein Market By Country

Countries CAGR (2025 to 2035)
China 5.3%
India 6.5%
Germany 5.9%
France 5.6%
UK 5.1%
USA 6.9%
Brazil 7.2%

The global food-waste derived protein market has exhibited significant cross-country divergence in adoption patterns, largely shaped by food system modernization, waste recovery infrastructure, and sustainability legislation. North America has been positioned as a key growth driver, with the United States forecasted to expand at a 6.9% CAGR.

This momentum has been supported by rising consumer demand for upcycled protein ingredients and corporate net-zero targets influencing ingredient procurement strategies. Brazil, with a projected CAGR of 7.2%, is expected to lead Latin America, driven by biomass-rich supply chains and government-backed circular economy frameworks encouraging agro-industrial waste valorization.

In Asia-Pacific, India is projected to grow at 6.5%, propelled by national food processing policies, capacity-building for municipal waste recovery, and private investments in functional protein start-ups. China, despite a slightly lower CAGR of 5.3%, remains strategically important due to its scale of food waste generation and growing regulatory pressure on food manufacturers to reduce organic waste volumes.

Europe continues to reflect a structured yet slower-paced growth curve, with Germany (5.9%), France (5.6%), and the UK (5.1%) advancing under EU waste reduction directives and retailer-led sustainability programs. Future growth across these markets is expected to be influenced by policy alignment, infrastructure funding, and the scalability of low-emission protein extraction technologies.

Sales Outlook for Food Waste-Derived Protein in the United States

Years 2025 2026 2027 2028 2029 2030 2031 2032 2033 2034 2035
USA Food Waste-Derived Protein 32.5 34.6 36.5 39.0 41.2 43.7 46.2 48.6 51.5 54.6 57.8

The food-waste derived protein market in the United States is projected to expand at a CAGR of 6.0% from 2025 to 2035, underpinned by government-backed waste reduction policies, ESG-driven reformulations by food manufacturers, and growing consumer alignment with clean-label and upcycled nutrition. Increased attention has been placed on valorizing organic residues from food service, brewery, and dairy sectors leading to strong demand for both plant- and animal-based functional protein ingredients.

Innovations in enzymatic and membrane separation technologies have been adopted by mid-size ingredient producers, enabling cost-effective recovery at scale. Greater traction has been observed in performance nutrition and pet food sectors, where digestibility and traceability are prioritized. USA universities and startups have also introduced pilot-scale systems integrating waste capture and protein extraction, supporting regionalized protein production.

  • Sustainability-focused reformulation in plant-based food brands has boosted ingredient demand.
  • Brewery and dairy processors are increasingly monetizing waste streams via contract protein recovery partnerships.

As sustainability-linked sourcing becomes institutionalized in procurement frameworks, demand for USA-produced food-waste derived protein is expected to experience continued acceleration.

Growth and Expansion Outlook for Food Waste-Derived Protein in the United Kingdom

The food-waste derived protein market in the UK is projected to grow moderately from 19.6% share in 2025 to 20.7% by 2035. Growth has been supported by strict landfill diversion mandates and post-Brexit sustainability commitments across the food sector. Upcycled proteins have been integrated into reformulated ready meals, bakery products, and sports nutrition lines as UK retailers adopt aggressive zero-waste targets. Local food manufacturers have partnered with municipal waste aggregators and academic institutions to develop closed-loop protein recovery systems.

  • Supermarkets have enforced supplier-level waste valorization requirements.
  • Bakery and produce waste streams are being converted into concentrated protein ingredients.
  • Regulatory alignment with novel food approval has encouraged innovation in functional protein formats.
  • Startups are commercializing localized waste-to-protein bioprocessing hubs.

Growth and Expansion Outlook for Food Waste-Derived Protein in India

India’s food-waste derived protein market is forecasted to register strong growth through 2035, supported by government initiatives under the Food Processing and Swachh Bharat missions. Decentralized bioprocessing units have been promoted to convert agri-waste, pulse husks, and fruit pulp into protein-rich inputs for domestic food, feed, and supplement sectors. The market has been shaped by demand for affordable, high-volume functional ingredients aligned with nutrition security goals.

  • Policy incentives have been provided for waste valorization in food parks.
  • Startups have scaled enzymatic and fermentation-based extraction for regional agri-waste.
  • Plant-based wellness brands are integrating upcycled protein into Ayurveda-inspired formulations.
  • Municipalities have piloted wet waste protein recovery under smart city programs.

Sales Outlook for Food Waste-Derived Protein in China

China’s share in the food-waste derived protein market is projected to grow steadily, anchored by strong state-led waste management reforms and rising demand for sustainable domestic ingredients. Circular economy targets have been embedded in the Five-Year Plan, prompting large food manufacturers to invest in high-volume protein extraction from fruit pomace, cereal residues, and dairy waste. National R&D programs have prioritized scalable recovery technologies and traceability infrastructure.

  • Large-scale pilot plants have been co-funded by municipal governments and SOEs.
  • Waste-to-protein platforms have been linked with national food security strategies.
  • Fermented and functional proteins are being positioned for use in meal replacements.
  • Compliance with carbon neutrality goals is accelerating industrial upcycling.

In-depth Analysis of Food Waste-Derived Protein in Germany

Countries 2025 2035
UK 19.6% 20.7%
Germany 20.3% 21.7%
Italy 10.0% 9.6%
France 13.4% 13.6%
Spain 9.1% 9.0%
BENELUX 6.8% 5.0%
Nordic 6.0% 5.1%
Rest of Europe 14.8% 15.4%

Germany is expected to remain a frontrunner in Europe’s food-waste derived protein landscape, with its market share increasing from 20.3% in 2025 to 21.7% by 2035. The country’s advanced recycling infrastructure, strong regulatory frameworks, and innovation-led food processing sector have enabled rapid adoption of protein extraction technologies. Functional proteins from bread waste, dairy by-products, and brewery residues have been integrated into premium food and nutraceutical applications.

  • Zero-waste certifications are being adopted by major food manufacturers.
  • Cross-sector consortiums are funding protein valorization from agro-industrial streams.
  • R&D has focused on enhancing bioavailability and shelf-life of upcycled proteins.
  • Retailers are sourcing functional ingredients with verified low environmental footprints.

Growth Outlook for Food Waste-Derived Protein in Japan

Protein Source Market Value Share, 2025
Fruit & Vegetable Waste Protein 11.0%
Cereal & Grain Waste Protein 9.0%
Dairy & Cheese Whey Waste Protein 22.0%
Legume & Pulse Waste Protein 12.0%
Meat & Fish Processing Waste Protein 20.0%
Brewery & Distillery Waste Protein 9.0%
Bakery Waste Protein 7.0%
Other Agro Industrial Waste Protein 10.0%

The food-waste derived protein market in Japan is projected to reach a valuation of USD 5.7 million in 2025, with dairy and cheese whey waste protein leading at 22%, followed closely by meat and fish processing waste protein at 20%. These shares reflect Japan’s emphasis on high-purity, nutritionally complete protein inputs for medical, elderly, and functional food segments. The preference for animal-based waste inputs is underpinned by their strong amino acid profiles and compatibility with existing dairy and seafood processing infrastructure.

Innovation has been steered by Japan’s long-standing expertise in fermentation, driving advancements in probiotic-infused upcycled proteins. Local manufacturers have prioritized ultra-clean extraction and traceability systems, aligning with national standards for food safety and low environmental impact.

  • Animal-based sources lead the market, with dairy and meat waste accounting for 42% combined.
  • Growth is supported by Japan’s functional food innovation and fermentation technology leadership.
  • Digital traceability, protein purity, and gut-health alignment define competitive advantage in Japan.

Opportunity Analysis of South Korea Food Waste-Derived Protein

Processing Technology Market Value Share, 2025
Enzymatic Hydrolysis 26.0%
Fermentation Based Protein Recovery 23.0%
Ultrafiltration & Membrane Separation 21.0%
Drying & Concentration Technologies 17.0%
Chemical Extraction & Purification 13.0%

The food-waste derived protein market in South Korea is projected to advance steadily by 2035, with enzymatic hydrolysis leading at 26% share in 2025, closely followed by fermentation-based recovery at 23%. This dominance has been supported by South Korea’s strong biochemical processing base and consumer demand for bioavailable, functional proteins. Proteins derived from food waste are being integrated into fortified beverages, functional foods, and elderly nutrition sectors in which enzymatic hydrolysis offers superior solubility and digestibility.

Fermentation-based processes have been championed for their compatibility with Korea’s traditional food biotech ecosystems, particularly in kombucha-style drinks and soy-ferment blends. Meanwhile, ultrafiltration methods have been increasingly deployed by ingredient manufacturers targeting purity and concentration without thermal degradation.
  • Enzymatic and fermentation technologies collectively dominate with a 49% combined share.
  • Use in elderly nutrition and functional beverages has reinforced demand for digestible hydrolysates.
  • R&D partnerships between biotech startups and food majors are accelerating extraction innovation.

Competitive Landscape of Food Waste-Derived Protein

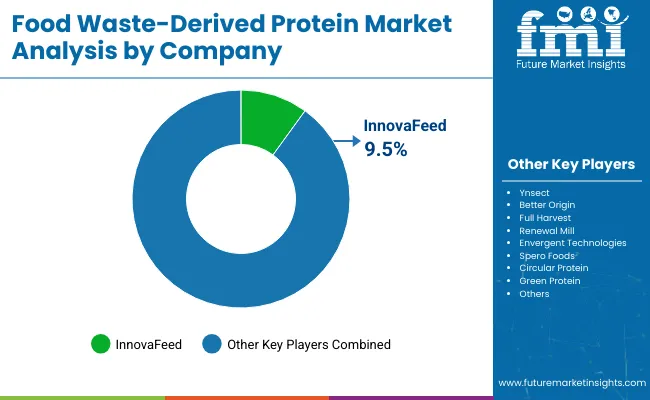
Food Waste Derived Protein Market By Company

The food-waste derived protein market is moderately fragmented, with global pioneers, mid-sized disruptors, and niche sustainability specialists competing across food, feed, and nutraceutical applications. Circular economy leaders such as InnovaFeed, Ynsect, and Better Origin have secured substantial market share by building vertically integrated platforms that convert agri-food waste into high-performance proteins for aquaculture, poultry, and pet nutrition. Their strategic advantage has been reinforced through investments in insect-based bioconversion systems, supported by favorable European regulations and zero-waste certification schemes.

Mid-sized innovators such as Spero Foods, Full Harvest, and Renewal Mill have focused on food-grade, plant-based protein ingredients derived from upcycled fruits, vegetables, and pulses. These companies have accelerated commercial traction through co-branding partnerships with CPG brands and by emphasizing functional nutrition, clean-label credentials, and traceable sourcing.

Specialized players, including Green Protein, Circular Protein, and Envergent Technologies, are targeting industrial food sectors with application-specific solutions in enzymatic hydrolysates and fiber-rich protein concentrates. Their strength lies in modular processing models and alignment with local biomass availability.

Competitive advantage in this market is increasingly defined by end-to-end sustainability, ingredient transparency, and functional performance, rather than volume scale alone. Strategic focus is expected to shift further toward subscription-based ingredient supply, upcycling-as-a-service models, and integration with regenerative agriculture systems.

Key Developments in Food Waste-Derived Protein

  • In June 2025, ODS Protein announced a key fermentation breakthrough enabling food‑waste substrates to be transformed into Nawa mycoprotein using fungi. The platform was reported to reduce natural resource use by 95% compared to conventional agriculture, driving scalability of upcycled protein across mainstream food applications.
  • In April 2025 - Bel Group & Standing Ovation Precision Fermentation Partnership. A joint development agreement was finalized in April 2025, under which Bel Group and biotech firm Standing Ovation began converting acid whey a by‑product of cheese production into casein via precision fermentation. This initiative was positioned as a circular solution, reinforcing supply resilience and reducing dairy waste.

Scope of the Report

Item Value
Quantitative Units USD 135.6 million
Protein Source Fruit & Vegetable Waste Protein, Cereal & Grain Waste Protein, Dairy & Cheese Whey Waste Protein, Legume & Pulse Waste Protein, Meat & Fish Processing Waste Protein, Brewery & Distillery Waste Protein, Bakery Waste Protein, Other Agro-Industrial Waste Protein
Protein Type Animal-Based Protein, Plant-Based Protein, Mixed Source Protein
Processing Technology Enzymatic Hydrolysis, Fermentation-Based Protein Recovery, Ultrafiltration & Membrane Separation, Drying & Concentration Technologies, Chemical Extraction & Purification
Product Form Protein Concentrates, Protein Isolates, Protein Hydrolysates, Functional Protein Ingredients
Application Food & Beverage Ingredients, Animal Feed & Aquafeed, Nutraceuticals & Dietary Supplements, Cosmetics & Personal Care, Industrial Uses
Sales Channel B2B Ingredient Suppliers, Food & Beverage Manufacturers, Animal Feed Producers, Nutraceutical Companies, Online Ingredient Marketplaces
Regions Covered North America, Europe, Asia-Pacific, Latin America, Middle East & Africa
Country Covered United States, Canada, Germany, France, United Kingdom, China, Japan, India, Brazil, South Africa
Key Companies Profiled InnovaFeed, Ynsect, Better Origin, Full Harvest, Renewal Mill, Envergent Technologies, Spero Foods, Circular Protein, Green Protein
Additional Attributes Dollar sales by protein source, technology, and application; demand shift toward clean-label and upcycled proteins; innovations in fermentation and enzymatic hydrolysis; regional mandates on food waste reduction; bioconversion platform scale-ups; functional protein inclusion in sports, wellness, and senior nutrition; B2B supplier integration; traceability and ESG-aligned sourcing; vertical integratio n in insect protein ecosystems.

Key Segments

By Protein Source:

  • Fruit & Vegetable Waste Protein
  • Cereal & Grain Waste Protein
  • Dairy & Cheese Whey Waste Protein
  • Legume & Pulse Waste Protein
  • Meat & Fish Processing Waste Protein
  • Brewery & Distillery Waste Protein
  • Bakery Waste Protein
  • Other Agro-Industrial Waste Protein

By Protein Type:

  • Animal-Based Protein
  • Plant-Based Protein
  • Mixed Source Protein

By Processing Technology:

  • Enzymatic Hydrolysis
  • Fermentation-Based Protein Recovery
  • Ultrafiltration & Membrane Separation
  • Drying & Concentration Technologies
  • Chemical Extraction & Purification

By Product Form:

  • Protein Concentrates
  • Protein Isolates
  • Protein Hydrolysates
  • Functional Protein Ingredients

By Application:

  • Food & Beverage Ingredients
  • Animal Feed & Aquafeed
  • Nutraceuticals & Dietary Supplements
  • Cosmetics & Personal Care
  • Industrial Uses

By Sales Channel:

  • B2B Ingredient Suppliers
  • Food & Beverage Manufacturers
  • Animal Feed Producers
  • Nutraceutical Companies
  • Online Ingredient Marketplaces

By Region:

  • North America
  • Latin America
  • Europe
  • East Asia
  • South Asia & Pacific
  • Middle East and Africa

Table of Content

  1. Executive Summary
    • Global Market Outlook
    • Demand-side Trends
    • Supply-side Trends
    • Technology Roadmap Analysis
    • Analysis and Recommendations
  2. Market Overview
    • Market Coverage / Taxonomy
    • Market Definition / Scope / Limitations
  3. Market Background
    • Market Dynamics
      • Drivers
      • Restraints
      • Opportunity
      • Trends
    • Scenario Forecast
      • Demand in Optimistic Scenario
      • Demand in Likely Scenario
      • Demand in Conservative Scenario
    • Opportunity Map Analysis
    • Product Life Cycle Analysis
    • Supply Chain Analysis
    • Investment Feasibility Matrix
    • Value Chain Analysis
    • PESTLE and Porter’s Analysis
    • Regulatory Landscape
    • Regional Parent Market Outlook
    • Production and Consumption Statistics
    • Import and Export Statistics
  4. Global Market Analysis 2020 to 2024 and Forecast, 2025 to 2035
    • Historical Market Size Value (USD Million) & Volume(Mt) Analysis, 2020 to 2024
    • Current and Future Market Size Value (USD Million) & Volume(Mt) Projections, 2025 to 2035
      • Y-o-Y Growth Trend Analysis
      • Absolute $ Opportunity Analysis
  5. Global Market Pricing Analysis 2020 to 2024 and Forecast 2025 to 2035
  6. Global Market Analysis 2020 to 2024 and Forecast 2025 to 2035, By Protein Source
    • Introduction / Key Findings
    • Historical Market Size Value (USD Million) & Volume(Mt) Analysis By Protein Source, 2020 to 2024
    • Current and Future Market Size Value (USD Million) & Volume(Mt) Analysis and Forecast By Protein Source, 2025 to 2035
      • Fruit & Vegetable Waste Protein
      • Cereal & Grain Waste Protein
      • Dairy & Cheese Whey Waste Protein
      • Legume & Pulse Waste Protein
      • Meat & Fish Processing Waste Protein
      • Brewery & Distillery Waste Protein
      • Bakery Waste Protein
      • Other Agro-Industrial Waste Protein
    • Y-o-Y Growth Trend Analysis By Protein Source, 2020 to 2024
    • Absolute $ Opportunity Analysis By Protein Source, 2025 to 2035
  7. Global Market Analysis 2020 to 2024 and Forecast 2025 to 2035, By Protein Type
    • Introduction / Key Findings
    • Historical Market Size Value (USD Million) & Volume(Mt) Analysis By Protein Type, 2020 to 2024
    • Current and Future Market Size Value (USD Million) & Volume(Mt) Analysis and Forecast By Protein Type, 2025 to 2035
      • Animal-Based Protein
      • Plant-Based Protein
      • Mixed Source Protein
    • Y-o-Y Growth Trend Analysis By Protein Type, 2020 to 2024
    • Absolute $ Opportunity Analysis By Protein Type, 2025 to 2035
  8. Global Market Analysis 2020 to 2024 and Forecast 2025 to 2035, By Processing Technology
    • Introduction / Key Findings
    • Historical Market Size Value (USD Million) & Volume(Mt) Analysis By Processing Technology, 2020 to 2024
    • Current and Future Market Size Value (USD Million) & Volume(Mt) Analysis and Forecast By Processing Technology, 2025 to 2035
      • Enzymatic Hydrolysis
      • Fermentation-Based Protein Recovery
      • Ultrafiltration & Membrane Separation
      • Drying & Concentration Technologies
      • Chemical Extraction & Purification
    • Y-o-Y Growth Trend Analysis By Processing Technology, 2020 to 2024
    • Absolute $ Opportunity Analysis By Processing Technology, 2025 to 2035
  9. Global Market Analysis 2020 to 2024 and Forecast 2025 to 2035, By Product Form
    • Introduction / Key Findings
    • Historical Market Size Value (USD Million) & Volume(Mt) Analysis By Product Form, 2020 to 2024
    • Current and Future Market Size Value (USD Million) & Volume(Mt) Analysis and Forecast By Product Form, 2025 to 2035
      • Protein Concentrates
      • Protein Isolates
      • Protein Hydrolysates
      • Functional Protein Ingredients
    • Y-o-Y Growth Trend Analysis By Product Form, 2020 to 2024
    • Absolute $ Opportunity Analysis By Product Form, 2025 to 2035
  10. Global Market Analysis 2020 to 2024 and Forecast 2025 to 2035, By Application
    • Introduction / Key Findings
    • Historical Market Size Value (USD Million) & Volume(Mt) Analysis By Application, 2020 to 2024
    • Current and Future Market Size Value (USD Million) & Volume(Mt) Analysis and Forecast By Application, 2025 to 2035
      • Food & Beverage Ingredients
      • Animal Feed & Aquafeed
      • Nutraceuticals & Dietary Supplements
      • Cosmetics & Personal Care
      • Industrial Uses
    • Y-o-Y Growth Trend Analysis By Application, 2020 to 2024
    • Absolute $ Opportunity Analysis By Application, 2025 to 2035
  11. Global Market Analysis 2020 to 2024 and Forecast 2025 to 2035, By Sales Channel
    • Introduction / Key Findings
    • Historical Market Size Value (USD Million) & Volume(Mt) Analysis By Sales Channel, 2020 to 2024
    • Current and Future Market Size Value (USD Million) & Volume(Mt) Analysis and Forecast By Sales Channel, 2025 to 2035
      • B2B Ingredient Suppliers
      • Food & Beverage Manufacturers
      • Animal Feed Producers
      • Nutraceutical Companies
      • Online Ingredient Marketplaces
    • Y-o-Y Growth Trend Analysis By Sales Channel, 2020 to 2024
    • Absolute $ Opportunity Analysis By Sales Channel, 2025 to 2035
  12. Global Market Analysis 2020 to 2024 and Forecast 2025 to 2035, By Region
    • Introduction
    • Historical Market Size Value (USD Million) & Volume(Mt) Analysis By Region, 2020 to 2024
    • Current Market Size Value (USD Million) & Volume(Mt) Analysis and Forecast By Region, 2025 to 2035
      • North America
      • Latin America
      • Europe
      • East Asia
      • South Asia & Pacific
      • Middle East and Africa
    • Market Attractiveness Analysis By Region
  13. North America Market Analysis 2020 to 2024 and Forecast 2025 to 2035, By Country
    • Historical Market Size Value (USD Million) & Volume(Mt) Trend Analysis By Market Taxonomy, 2020 to 2024
    • Market Size Value (USD Million) & Volume(Mt) Forecast By Market Taxonomy, 2025 to 2035
      • By Country
        • USA
        • Canada
      • By Protein Source
      • By Protein Type
      • By Processing Technology
      • By Product Form
      • By Application
      • By Sales Channel
    • Market Attractiveness Analysis
      • By Country
      • By Protein Source
      • By Protein Type
      • By Processing Technology
      • By Product Form
      • By Application
      • By Sales Channel
    • Key Takeaways
  14. Latin America Market Analysis 2020 to 2024 and Forecast 2025 to 2035, By Country
    • Historical Market Size Value (USD Million) & Volume(Mt) Trend Analysis By Market Taxonomy, 2020 to 2024
    • Market Size Value (USD Million) & Volume(Mt) Forecast By Market Taxonomy, 2025 to 2035
      • By Country
        • Brazil
        • Mexico
        • Colombia
        • Rest of Latin America
      • By Protein Source
      • By Protein Type
      • By Processing Technology
      • By Product Form
      • By Application
      • By Sales Channel
    • Market Attractiveness Analysis
      • By Country
      • By Protein Source
      • By Protein Type
      • By Processing Technology
      • By Product Form
      • By Application
      • By Sales Channel
    • Key Takeaways
  15. Europe Market Analysis 2020 to 2024 and Forecast 2025 to 2035, By Country
    • Historical Market Size Value (USD Million) & Volume(Mt) Trend Analysis By Market Taxonomy, 2020 to 2024
    • Market Size Value (USD Million) & Volume(Mt) Forecast By Market Taxonomy, 2025 to 2035
      • By Country
        • Germany
        • UK
        • France
        • Italy
        • Spain
        • Belgium
        • Netherlands
        • Nordic
        • Switzerland
        • Russia
        • Poland
        • Rest of Europe
      • By Protein Source
      • By Protein Type
      • By Processing Technology
      • By Product Form
      • By Application
      • By Sales Channel
    • Market Attractiveness Analysis
      • By Country
      • By Protein Source
      • By Protein Type
      • By Processing Technology
      • By Product Form
      • By Application
      • By Sales Channel
    • Key Takeaways
  16. East Asia Market Analysis 2020 to 2024 and Forecast 2025 to 2035, By Country
    • Historical Market Size Value (USD Million) & Volume(Mt) Trend Analysis By Market Taxonomy, 2020 to 2024
    • Market Size Value (USD Million) & Volume(Mt) Forecast By Market Taxonomy, 2025 to 2035
      • By Country
        • China
        • Japan
        • South Korea
      • By Protein Source
      • By Protein Type
      • By Processing Technology
      • By Product Form
      • By Application
      • By Sales Channel
    • Market Attractiveness Analysis
      • By Country
      • By Protein Source
      • By Protein Type
      • By Processing Technology
      • By Product Form
      • By Application
      • By Sales Channel
    • Key Takeaways
  17. South Asia & Pacific Market Analysis 2020 to 2024 and Forecast 2025 to 2035, By Country
    • Historical Market Size Value (USD Million) & Volume(Mt) Trend Analysis By Market Taxonomy, 2020 to 2024
    • Market Size Value (USD Million) & Volume(Mt) Forecast By Market Taxonomy, 2025 to 2035
      • By Country
        • India
        • Thailand
        • Malaysia
        • Indonesia
        • Singapore
        • Vietnam
        • Australia
        • New Zealand
        • Rest of South Asia & Pacific
      • By Protein Source
      • By Protein Type
      • By Processing Technology
      • By Product Form
      • By Application
      • By Sales Channel
    • Market Attractiveness Analysis
      • By Country
      • By Protein Source
      • By Protein Type
      • By Processing Technology
      • By Product Form
      • By Application
      • By Sales Channel
    • Key Takeaways
  18. Middle East and Africa Market Analysis 2020 to 2024 and Forecast 2025 to 2035, By Country
    • Historical Market Size Value (USD Million) & Volume(Mt) Trend Analysis By Market Taxonomy, 2020 to 2024
    • Market Size Value (USD Million) & Volume(Mt) Forecast By Market Taxonomy, 2025 to 2035
      • By Country
        • Turkey
        • UAE
        • Saudi Arabia
        • Israel
        • Other GCC Countries
        • North Africa
        • South Africa
      • By Protein Source
      • By Protein Type
      • By Processing Technology
      • By Product Form
      • By Application
      • By Sales Channel
    • Market Attractiveness Analysis
      • By Country
      • By Protein Source
      • By Protein Type
      • By Processing Technology
      • By Product Form
      • By Application
      • By Sales Channel
    • Key Takeaways
  19. Key Countries Market Analysis
    • U.S
      • Pricing Analysis
      • Market Share Analysis, 2024
        • By Protein Source
        • By Protein Type
        • By Processing Technology
        • By Product Form
        • By Application
        • By Sales Channel
    • Canada
      • Pricing Analysis
      • Market Share Analysis, 2024
        • By Protein Source
        • By Protein Type
        • By Processing Technology
        • By Product Form
        • By Application
        • By Sales Channel
    • Brazil
      • Pricing Analysis
      • Market Share Analysis, 2024
        • By Protein Source
        • By Protein Type
        • By Processing Technology
        • By Product Form
        • By Application
        • By Sales Channel
    • Mexico
      • Pricing Analysis
      • Market Share Analysis, 2024
        • By Protein Source
        • By Protein Type
        • By Processing Technology
        • By Product Form
        • By Application
        • By Sales Channel
    • Germany
      • Pricing Analysis
      • Market Share Analysis, 2024
        • By Protein Source
        • By Protein Type
        • By Processing Technology
        • By Product Form
        • By Application
        • By Sales Channel
    • UK
      • Pricing Analysis
      • Market Share Analysis, 2024
        • By Protein Source
        • By Protein Type
        • By Processing Technology
        • By Product Form
        • By Application
        • By Sales Channel
    • France
      • Pricing Analysis
      • Market Share Analysis, 2024
        • By Protein Source
        • By Protein Type
        • By Processing Technology
        • By Product Form
        • By Application
        • By Sales Channel
    • Italy
      • Pricing Analysis
      • Market Share Analysis, 2024
        • By Protein Source
        • By Protein Type
        • By Processing Technology
        • By Product Form
        • By Application
        • By Sales Channel
    • Spain
      • Pricing Analysis
      • Market Share Analysis, 2024
        • By Protein Source
        • By Protein Type
        • By Processing Technology
        • By Product Form
        • By Application
        • By Sales Channel
    • Belgium
      • Pricing Analysis
      • Market Share Analysis, 2024
        • By Protein Source
        • By Protein Type
        • By Processing Technology
        • By Product Form
        • By Application
        • By Sales Channel
    • Netherlands
      • Pricing Analysis
      • Market Share Analysis, 2024
        • By Protein Source
        • By Protein Type
        • By Processing Technology
        • By Product Form
        • By Application
        • By Sales Channel
    • Nordic
      • Pricing Analysis
      • Market Share Analysis, 2024
        • By Protein Source
        • By Protein Type
        • By Processing Technology
        • By Product Form
        • By Application
        • By Sales Channel
    • Switzerland
      • Pricing Analysis
      • Market Share Analysis, 2024
        • By Protein Source
        • By Protein Type
        • By Processing Technology
        • By Product Form
        • By Application
        • By Sales Channel
    • Russia
      • Pricing Analysis
      • Market Share Analysis, 2024
        • By Protein Source
        • By Protein Type
        • By Processing Technology
        • By Product Form
        • By Application
        • By Sales Channel
    • Poland
      • Pricing Analysis
      • Market Share Analysis, 2024
        • By Protein Source
        • By Protein Type
        • By Processing Technology
        • By Product Form
        • By Application
        • By Sales Channel
    • China
      • Pricing Analysis
      • Market Share Analysis, 2024
        • By Protein Source
        • By Protein Type
        • By Processing Technology
        • By Product Form
        • By Application
        • By Sales Channel
    • Japan
      • Pricing Analysis
      • Market Share Analysis, 2024
        • By Protein Source
        • By Protein Type
        • By Processing Technology
        • By Product Form
        • By Application
        • By Sales Channel
    • South Korea
      • Pricing Analysis
      • Market Share Analysis, 2024
        • By Protein Source
        • By Protein Type
        • By Processing Technology
        • By Product Form
        • By Application
        • By Sales Channel
    • India
      • Pricing Analysis
      • Market Share Analysis, 2024
        • By Protein Source
        • By Protein Type
        • By Processing Technology
        • By Product Form
        • By Application
        • By Sales Channel
    • Thailand
      • Pricing Analysis
      • Market Share Analysis, 2024
        • By Protein Source
        • By Protein Type
        • By Processing Technology
        • By Product Form
        • By Application
        • By Sales Channel
    • Malaysia
      • Pricing Analysis
      • Market Share Analysis, 2024
        • By Protein Source
        • By Protein Type
        • By Processing Technology
        • By Product Form
        • By Application
        • By Sales Channel
    • Indonesia
      • Pricing Analysis
      • Market Share Analysis, 2024
        • By Protein Source
        • By Protein Type
        • By Processing Technology
        • By Product Form
        • By Application
        • By Sales Channel
    • Singapore
      • Pricing Analysis
      • Market Share Analysis, 2024
        • By Protein Source
        • By Protein Type
        • By Processing Technology
        • By Product Form
        • By Application
        • By Sales Channel
    • Vietnam
      • Pricing Analysis
      • Market Share Analysis, 2024
        • By Protein Source
        • By Protein Type
        • By Processing Technology
        • By Product Form
        • By Application
        • By Sales Channel
    • Australia
      • Pricing Analysis
      • Market Share Analysis, 2024
        • By Protein Source
        • By Protein Type
        • By Processing Technology
        • By Product Form
        • By Application
        • By Sales Channel
    • New Zealand
      • Pricing Analysis
      • Market Share Analysis, 2024
        • By Protein Source
        • By Protein Type
        • By Processing Technology
        • By Product Form
        • By Application
        • By Sales Channel
    • Turkey
      • Pricing Analysis
      • Market Share Analysis, 2024
        • By Protein Source
        • By Protein Type
        • By Processing Technology
        • By Product Form
        • By Application
        • By Sales Channel
    • UAE
      • Pricing Analysis
      • Market Share Analysis, 2024
        • By Protein Source
        • By Protein Type
        • By Processing Technology
        • By Product Form
        • By Application
        • By Sales Channel
    • Saudi Arabia
      • Pricing Analysis
      • Market Share Analysis, 2024
        • By Protein Source
        • By Protein Type
        • By Processing Technology
        • By Product Form
        • By Application
        • By Sales Channel
    • Israel
      • Pricing Analysis
      • Market Share Analysis, 2024
        • By Protein Source
        • By Protein Type
        • By Processing Technology
        • By Product Form
        • By Application
        • By Sales Channel
  20. Market Structure Analysis
    • Competition Dashboard
    • Competition Benchmarking
    • Market Share Analysis of Top Players
      • By Regional
      • By Protein Source
      • By Protein Type
      • By Processing Technology
      • By Product Form
      • By Application
      • By Sales Channel
  21. Competition Analysis
    • Competition Deep Dive
      • Full Harvest
        • Overview
        • Product Portfolio
        • Profitability by Market Segments (Product/Age /Sales Channel/Region)
        • Sales Footprint
        • Strategy Overview
        • Renewal Mill
        • Envergent Technologies
        • Spero Foods
        • Green Protein
        • Circular Protein
        • InnovaFeed
        • Ynsect
        • Better Origin
        • Seafields
    • Assumptions & Acronyms Used
    • Research Methodology

List of Tables

  • Table 1: Global Market Value (USD Million) Forecast by Region, 2020-2035
  • Table 2: Global Market Volume (Units) Forecast by Region, 2020-2035
  • Table 3: Global Market Value (USD Million) Forecast by Fiber Type, 2020-2035
  • Table 4: Global Market Volume (Units) Forecast by Fiber Type, 2020-2035
  • Table 5: Global Market Value (USD Million) Forecast by Application, 2020-2035
  • Table 6: Global Market Volume (Units) Forecast by Application, 2020-2035
  • Table 7: Global Market Value (USD Million) Forecast by Product Format, 2020-2035
  • Table 8: Global Market Volume (Units) Forecast by Product Format, 2020-2035
  • Table 9: Global Market Value (USD Million) Forecast by End User, 2020-2035
  • Table 10: Global Market Volume (Units) Forecast by End User, 2020-2035
  • Table 11: Global Market Value (USD Million) Forecast by Sales Channel, 2020-2035
  • Table 12: Global Market Volume (Units) Forecast by Sales Channel, 2020-2035
  • Table 13: North America Market Value (USD Million) Forecast by Country, 2020-2035
  • Table 14: North America Market Volume (Units) Forecast by Country, 2020-2035
  • Table 15: North America Market Value (USD Million) Forecast by Fiber Type, 2020-2035
  • Table 16: North America Market Volume (Units) Forecast by Fiber Type, 2020-2035
  • Table 17: North America Market Value (USD Million) Forecast by Application, 2020-2035
  • Table 18: North America Market Volume (Units) Forecast by Application, 2020-2035
  • Table 19: North America Market Value (USD Million) Forecast by Product Format, 2020-2035
  • Table 20: North America Market Volume (Units) Forecast by Product Format, 2020-2035
  • Table 21: North America Market Value (USD Million) Forecast by End User, 2020-2035
  • Table 22: North America Market Volume (Units) Forecast by End User, 2020-2035
  • Table 23: North America Market Value (USD Million) Forecast by Sales Channel, 2020-2035
  • Table 24: North America Market Volume (Units) Forecast by Sales Channel, 2020-2035
  • Table 25: Latin America Market Value (USD Million) Forecast by Country, 2020-2035
  • Table 26: Latin America Market Volume (Units) Forecast by Country, 2020-2035
  • Table 27: Latin America Market Value (USD Million) Forecast by Fiber Type, 2020-2035
  • Table 28: Latin America Market Volume (Units) Forecast by Fiber Type, 2020-2035
  • Table 29: Latin America Market Value (USD Million) Forecast by Application, 2020-2035
  • Table 30: Latin America Market Volume (Units) Forecast by Application, 2020-2035
  • Table 31: Latin America Market Value (USD Million) Forecast by Product Format, 2020-2035
  • Table 32: Latin America Market Volume (Units) Forecast by Product Format, 2020-2035
  • Table 33: Latin America Market Value (USD Million) Forecast by End User, 2020-2035
  • Table 34: Latin America Market Volume (Units) Forecast by End User, 2020-2035
  • Table 35: Latin America Market Value (USD Million) Forecast by Sales Channel, 2020-2035
  • Table 36: Latin America Market Volume (Units) Forecast by Sales Channel, 2020-2035
  • Table 37: Europe Market Value (USD Million) Forecast by Country, 2020-2035
  • Table 38: Europe Market Volume (Units) Forecast by Country, 2020-2035
  • Table 39: Europe Market Value (USD Million) Forecast by Fiber Type, 2020-2035
  • Table 40: Europe Market Volume (Units) Forecast by Fiber Type, 2020-2035
  • Table 41: Europe Market Value (USD Million) Forecast by Application, 2020-2035
  • Table 42: Europe Market Volume (Units) Forecast by Application, 2020-2035
  • Table 43: Europe Market Value (USD Million) Forecast by Product Format, 2020-2035
  • Table 44: Europe Market Volume (Units) Forecast by Product Format, 2020-2035
  • Table 45: Europe Market Value (USD Million) Forecast by End User, 2020-2035
  • Table 46: Europe Market Volume (Units) Forecast by End User, 2020-2035
  • Table 47: Europe Market Value (USD Million) Forecast by Sales Channel, 2020-2035
  • Table 48: Europe Market Volume (Units) Forecast by Sales Channel, 2020-2035
  • Table 49: East Asia Market Value (USD Million) Forecast by Country, 2020-2035
  • Table 50: East Asia Market Volume (Units) Forecast by Country, 2020-2035
  • Table 51: East Asia Market Value (USD Million) Forecast by Fiber Type, 2020-2035
  • Table 52: East Asia Market Volume (Units) Forecast by Fiber Type, 2020-2035
  • Table 53: East Asia Market Value (USD Million) Forecast by Application, 2020-2035
  • Table 54: East Asia Market Volume (Units) Forecast by Application, 2020-2035
  • Table 55: East Asia Market Value (USD Million) Forecast by Product Format, 2020-2035
  • Table 56: East Asia Market Volume (Units) Forecast by Product Format, 2020-2035
  • Table 57: East Asia Market Value (USD Million) Forecast by End User, 2020-2035
  • Table 58: East Asia Market Volume (Units) Forecast by End User, 2020-2035
  • Table 59: East Asia Market Value (USD Million) Forecast by Sales Channel, 2020-2035
  • Table 60: East Asia Market Volume (Units) Forecast by Sales Channel, 2020-2035
  • Table 61: South Asia & Pacific Market Value (USD Million) Forecast by Country, 2020-2035
  • Table 62: South Asia & Pacific Market Volume (Units) Forecast by Country, 2020-2035
  • Table 63: South Asia & Pacific Market Value (USD Million) Forecast by Fiber Type, 2020-2035
  • Table 64: South Asia & Pacific Market Volume (Units) Forecast by Fiber Type, 2020-2035
  • Table 65: South Asia & Pacific Market Value (USD Million) Forecast by Application, 2020-2035
  • Table 66: South Asia & Pacific Market Volume (Units) Forecast by Application, 2020-2035
  • Table 67: South Asia & Pacific Market Value (USD Million) Forecast by Product Format, 2020-2035
  • Table 68: South Asia & Pacific Market Volume (Units) Forecast by Product Format, 2020-2035
  • Table 69: South Asia & Pacific Market Value (USD Million) Forecast by End User, 2020-2035
  • Table 70: South Asia & Pacific Market Volume (Units) Forecast by End User, 2020-2035
  • Table 71: South Asia & Pacific Market Value (USD Million) Forecast by Sales Channel, 2020-2035
  • Table 72: South Asia & Pacific Market Volume (Units) Forecast by Sales Channel, 2020-2035
  • Table 73: MEA Market Value (USD Million) Forecast by Country, 2020-2035
  • Table 74: MEA Market Volume (Units) Forecast by Country, 2020-2035
  • Table 75: MEA Market Value (USD Million) Forecast by Fiber Type, 2020-2035
  • Table 76: MEA Market Volume (Units) Forecast by Fiber Type, 2020-2035
  • Table 77: MEA Market Value (USD Million) Forecast by Application, 2020-2035
  • Table 78: MEA Market Volume (Units) Forecast by Application, 2020-2035
  • Table 79: MEA Market Value (USD Million) Forecast by Product Format, 2020-2035
  • Table 80: MEA Market Volume (Units) Forecast by Product Format, 2020-2035
  • Table 81: MEA Market Value (USD Million) Forecast by End User, 2020-2035
  • Table 82: MEA Market Volume (Units) Forecast by End User, 2020-2035
  • Table 83: MEA Market Value (USD Million) Forecast by Sales Channel, 2020-2035
  • Table 84: MEA Market Volume (Units) Forecast by Sales Channel, 2020-2035

List of Figures

  • Figure 1: Global Market Value (USD Million) by - Fiber Type, 2025-2035
  • Figure 2: Global Market Value (USD Million) by - Application, 2025-2035
  • Figure 3: Global Market Value (USD Million) by - Product Format, 2025-2035
  • Figure 4: Global Market Value (USD Million) by - End User, 2025-2035
  • Figure 5: Global Market Value (USD Million) by - Sales Channel, 2025-2035
  • Figure 6: Global Market Value (USD Million) by Region, 2025-2035
  • Figure 7: Global Market Value (USD Million) Analysis by Region, 2020-2035
  • Figure 8: Global Market Volume (Units) Analysis by Region, 2020-2035
  • Figure 9: Global Market Value Share (%) and BPS Analysis by Region, 2025-2035
  • Figure 10: Global Market Y-o-Y Growth (%) Projections by Region, 2025-2035
  • Figure 11: Global Market Value (USD Million) Analysis by - Fiber Type, 2020-2035
  • Figure 12: Global Market Volume (Units) Analysis by - Fiber Type, 2020-2035
  • Figure 13: Global Market Value Share (%) and BPS Analysis by - Fiber Type, 2025-2035
  • Figure 14: Global Market Y-o-Y Growth (%) Projections by - Fiber Type, 2025-2035
  • Figure 15: Global Market Value (USD Million) Analysis by - Application, 2020-2035
  • Figure 16: Global Market Volume (Units) Analysis by - Application, 2020-2035
  • Figure 17: Global Market Value Share (%) and BPS Analysis by - Application, 2025-2035
  • Figure 18: Global Market Y-o-Y Growth (%) Projections by - Application, 2025-2035
  • Figure 19: Global Market Value (USD Million) Analysis by - Product Format, 2020-2035
  • Figure 20: Global Market Volume (Units) Analysis by - Product Format, 2020-2035
  • Figure 21: Global Market Value Share (%) and BPS Analysis by - Product Format, 2025-2035
  • Figure 22: Global Market Y-o-Y Growth (%) Projections by - Product Format, 2025-2035
  • Figure 23: Global Market Value (USD Million) Analysis by - End User, 2020-2035
  • Figure 24: Global Market Volume (Units) Analysis by - End User, 2020-2035
  • Figure 25: Global Market Value Share (%) and BPS Analysis by - End User, 2025-2035
  • Figure 26: Global Market Y-o-Y Growth (%) Projections by - End User, 2025-2035
  • Figure 27: Global Market Value (USD Million) Analysis by - Sales Channel, 2020-2035
  • Figure 28: Global Market Volume (Units) Analysis by - Sales Channel, 2020-2035
  • Figure 29: Global Market Value Share (%) and BPS Analysis by - Sales Channel, 2025-2035
  • Figure 30: Global Market Y-o-Y Growth (%) Projections by - Sales Channel, 2025-2035
  • Figure 31: Global Market Attractiveness by - Fiber Type, 2025-2035
  • Figure 32: Global Market Attractiveness by - Application, 2025-2035
  • Figure 33: Global Market Attractiveness by - Product Format, 2025-2035
  • Figure 34: Global Market Attractiveness by - End User, 2025-2035
  • Figure 35: Global Market Attractiveness by - Sales Channel, 2025-2035
  • Figure 36: Global Market Attractiveness by Region, 2025-2035
  • Figure 37: North America Market Value (USD Million) by - Fiber Type, 2025-2035
  • Figure 38: North America Market Value (USD Million) by - Application, 2025-2035
  • Figure 39: North America Market Value (USD Million) by - Product Format, 2025-2035
  • Figure 40: North America Market Value (USD Million) by - End User, 2025-2035
  • Figure 41: North America Market Value (USD Million) by - Sales Channel, 2025-2035
  • Figure 42: North America Market Value (USD Million) by Country, 2025-2035
  • Figure 43: North America Market Value (USD Million) Analysis by Country, 2020-2035
  • Figure 44: North America Market Volume (Units) Analysis by Country, 2020-2035
  • Figure 45: North America Market Value Share (%) and BPS Analysis by Country, 2025-2035
  • Figure 46: North America Market Y-o-Y Growth (%) Projections by Country, 2025-2035
  • Figure 47: North America Market Value (USD Million) Analysis by - Fiber Type, 2020-2035
  • Figure 48: North America Market Volume (Units) Analysis by - Fiber Type, 2020-2035
  • Figure 49: North America Market Value Share (%) and BPS Analysis by - Fiber Type, 2025-2035
  • Figure 50: North America Market Y-o-Y Growth (%) Projections by - Fiber Type, 2025-2035
  • Figure 51: North America Market Value (USD Million) Analysis by - Application, 2020-2035
  • Figure 52: North America Market Volume (Units) Analysis by - Application, 2020-2035
  • Figure 53: North America Market Value Share (%) and BPS Analysis by - Application, 2025-2035
  • Figure 54: North America Market Y-o-Y Growth (%) Projections by - Application, 2025-2035
  • Figure 55: North America Market Value (USD Million) Analysis by - Product Format, 2020-2035
  • Figure 56: North America Market Volume (Units) Analysis by - Product Format, 2020-2035
  • Figure 57: North America Market Value Share (%) and BPS Analysis by - Product Format, 2025-2035
  • Figure 58: North America Market Y-o-Y Growth (%) Projections by - Product Format, 2025-2035
  • Figure 59: North America Market Value (USD Million) Analysis by - End User, 2020-2035
  • Figure 60: North America Market Volume (Units) Analysis by - End User, 2020-2035
  • Figure 61: North America Market Value Share (%) and BPS Analysis by - End User, 2025-2035
  • Figure 62: North America Market Y-o-Y Growth (%) Projections by - End User, 2025-2035
  • Figure 63: North America Market Value (USD Million) Analysis by - Sales Channel, 2020-2035
  • Figure 64: North America Market Volume (Units) Analysis by - Sales Channel, 2020-2035
  • Figure 65: North America Market Value Share (%) and BPS Analysis by - Sales Channel, 2025-2035
  • Figure 66: North America Market Y-o-Y Growth (%) Projections by - Sales Channel, 2025-2035
  • Figure 67: North America Market Attractiveness by - Fiber Type, 2025-2035
  • Figure 68: North America Market Attractiveness by - Application, 2025-2035
  • Figure 69: North America Market Attractiveness by - Product Format, 2025-2035
  • Figure 70: North America Market Attractiveness by - End User, 2025-2035
  • Figure 71: North America Market Attractiveness by - Sales Channel, 2025-2035
  • Figure 72: North America Market Attractiveness by Country, 2025-2035
  • Figure 73: Latin America Market Value (USD Million) by - Fiber Type, 2025-2035
  • Figure 74: Latin America Market Value (USD Million) by - Application, 2025-2035
  • Figure 75: Latin America Market Value (USD Million) by - Product Format, 2025-2035
  • Figure 76: Latin America Market Value (USD Million) by - End User, 2025-2035
  • Figure 77: Latin America Market Value (USD Million) by - Sales Channel, 2025-2035
  • Figure 78: Latin America Market Value (USD Million) by Country, 2025-2035
  • Figure 79: Latin America Market Value (USD Million) Analysis by Country, 2020-2035
  • Figure 80: Latin America Market Volume (Units) Analysis by Country, 2020-2035
  • Figure 81: Latin America Market Value Share (%) and BPS Analysis by Country, 2025-2035
  • Figure 82: Latin America Market Y-o-Y Growth (%) Projections by Country, 2025-2035
  • Figure 83: Latin America Market Value (USD Million) Analysis by - Fiber Type, 2020-2035
  • Figure 84: Latin America Market Volume (Units) Analysis by - Fiber Type, 2020-2035
  • Figure 85: Latin America Market Value Share (%) and BPS Analysis by - Fiber Type, 2025-2035
  • Figure 86: Latin America Market Y-o-Y Growth (%) Projections by - Fiber Type, 2025-2035
  • Figure 87: Latin America Market Value (USD Million) Analysis by - Application, 2020-2035
  • Figure 88: Latin America Market Volume (Units) Analysis by - Application, 2020-2035
  • Figure 89: Latin America Market Value Share (%) and BPS Analysis by - Application, 2025-2035
  • Figure 90: Latin America Market Y-o-Y Growth (%) Projections by - Application, 2025-2035
  • Figure 91: Latin America Market Value (USD Million) Analysis by - Product Format, 2020-2035
  • Figure 92: Latin America Market Volume (Units) Analysis by - Product Format, 2020-2035
  • Figure 93: Latin America Market Value Share (%) and BPS Analysis by - Product Format, 2025-2035
  • Figure 94: Latin America Market Y-o-Y Growth (%) Projections by - Product Format, 2025-2035
  • Figure 95: Latin America Market Value (USD Million) Analysis by - End User, 2020-2035
  • Figure 96: Latin America Market Volume (Units) Analysis by - End User, 2020-2035
  • Figure 97: Latin America Market Value Share (%) and BPS Analysis by - End User, 2025-2035
  • Figure 98: Latin America Market Y-o-Y Growth (%) Projections by - End User, 2025-2035
  • Figure 99: Latin America Market Value (USD Million) Analysis by - Sales Channel, 2020-2035
  • Figure 100: Latin America Market Volume (Units) Analysis by - Sales Channel, 2020-2035
  • Figure 101: Latin America Market Value Share (%) and BPS Analysis by - Sales Channel, 2025-2035
  • Figure 102: Latin America Market Y-o-Y Growth (%) Projections by - Sales Channel, 2025-2035
  • Figure 103: Latin America Market Attractiveness by - Fiber Type, 2025-2035
  • Figure 104: Latin America Market Attractiveness by - Application, 2025-2035
  • Figure 105: Latin America Market Attractiveness by - Product Format, 2025-2035
  • Figure 106: Latin America Market Attractiveness by - End User, 2025-2035
  • Figure 107: Latin America Market Attractiveness by - Sales Channel, 2025-2035
  • Figure 108: Latin America Market Attractiveness by Country, 2025-2035
  • Figure 109: Europe Market Value (USD Million) by - Fiber Type, 2025-2035
  • Figure 110: Europe Market Value (USD Million) by - Application, 2025-2035
  • Figure 111: Europe Market Value (USD Million) by - Product Format, 2025-2035
  • Figure 112: Europe Market Value (USD Million) by - End User, 2025-2035
  • Figure 113: Europe Market Value (USD Million) by - Sales Channel, 2025-2035
  • Figure 114: Europe Market Value (USD Million) by Country, 2025-2035
  • Figure 115: Europe Market Value (USD Million) Analysis by Country, 2020-2035
  • Figure 116: Europe Market Volume (Units) Analysis by Country, 2020-2035
  • Figure 117: Europe Market Value Share (%) and BPS Analysis by Country, 2025-2035
  • Figure 118: Europe Market Y-o-Y Growth (%) Projections by Country, 2025-2035
  • Figure 119: Europe Market Value (USD Million) Analysis by - Fiber Type, 2020-2035
  • Figure 120: Europe Market Volume (Units) Analysis by - Fiber Type, 2020-2035
  • Figure 121: Europe Market Value Share (%) and BPS Analysis by - Fiber Type, 2025-2035
  • Figure 122: Europe Market Y-o-Y Growth (%) Projections by - Fiber Type, 2025-2035
  • Figure 123: Europe Market Value (USD Million) Analysis by - Application, 2020-2035
  • Figure 124: Europe Market Volume (Units) Analysis by - Application, 2020-2035
  • Figure 125: Europe Market Value Share (%) and BPS Analysis by - Application, 2025-2035
  • Figure 126: Europe Market Y-o-Y Growth (%) Projections by - Application, 2025-2035
  • Figure 127: Europe Market Value (USD Million) Analysis by - Product Format, 2020-2035
  • Figure 128: Europe Market Volume (Units) Analysis by - Product Format, 2020-2035
  • Figure 129: Europe Market Value Share (%) and BPS Analysis by - Product Format, 2025-2035
  • Figure 130: Europe Market Y-o-Y Growth (%) Projections by - Product Format, 2025-2035
  • Figure 131: Europe Market Value (USD Million) Analysis by - End User, 2020-2035
  • Figure 132: Europe Market Volume (Units) Analysis by - End User, 2020-2035
  • Figure 133: Europe Market Value Share (%) and BPS Analysis by - End User, 2025-2035
  • Figure 134: Europe Market Y-o-Y Growth (%) Projections by - End User, 2025-2035
  • Figure 135: Europe Market Value (USD Million) Analysis by - Sales Channel, 2020-2035
  • Figure 136: Europe Market Volume (Units) Analysis by - Sales Channel, 2020-2035
  • Figure 137: Europe Market Value Share (%) and BPS Analysis by - Sales Channel, 2025-2035
  • Figure 138: Europe Market Y-o-Y Growth (%) Projections by - Sales Channel, 2025-2035
  • Figure 139: Europe Market Attractiveness by - Fiber Type, 2025-2035
  • Figure 140: Europe Market Attractiveness by - Application, 2025-2035
  • Figure 141: Europe Market Attractiveness by - Product Format, 2025-2035
  • Figure 142: Europe Market Attractiveness by - End User, 2025-2035
  • Figure 143: Europe Market Attractiveness by - Sales Channel, 2025-2035
  • Figure 144: Europe Market Attractiveness by Country, 2025-2035
  • Figure 145: East Asia Market Value (USD Million) by - Fiber Type, 2025-2035
  • Figure 146: East Asia Market Value (USD Million) by - Application, 2025-2035
  • Figure 147: East Asia Market Value (USD Million) by - Product Format, 2025-2035
  • Figure 148: East Asia Market Value (USD Million) by - End User, 2025-2035
  • Figure 149: East Asia Market Value (USD Million) by - Sales Channel, 2025-2035
  • Figure 150: East Asia Market Value (USD Million) by Country, 2025-2035
  • Figure 151: East Asia Market Value (USD Million) Analysis by Country, 2020-2035
  • Figure 152: East Asia Market Volume (Units) Analysis by Country, 2020-2035
  • Figure 153: East Asia Market Value Share (%) and BPS Analysis by Country, 2025-2035
  • Figure 154: East Asia Market Y-o-Y Growth (%) Projections by Country, 2025-2035
  • Figure 155: East Asia Market Value (USD Million) Analysis by - Fiber Type, 2020-2035
  • Figure 156: East Asia Market Volume (Units) Analysis by - Fiber Type, 2020-2035
  • Figure 157: East Asia Market Value Share (%) and BPS Analysis by - Fiber Type, 2025-2035
  • Figure 158: East Asia Market Y-o-Y Growth (%) Projections by - Fiber Type, 2025-2035
  • Figure 159: East Asia Market Value (USD Million) Analysis by - Application, 2020-2035
  • Figure 160: East Asia Market Volume (Units) Analysis by - Application, 2020-2035
  • Figure 161: East Asia Market Value Share (%) and BPS Analysis by - Application, 2025-2035
  • Figure 162: East Asia Market Y-o-Y Growth (%) Projections by - Application, 2025-2035
  • Figure 163: East Asia Market Value (USD Million) Analysis by - Product Format, 2020-2035
  • Figure 164: East Asia Market Volume (Units) Analysis by - Product Format, 2020-2035
  • Figure 165: East Asia Market Value Share (%) and BPS Analysis by - Product Format, 2025-2035
  • Figure 166: East Asia Market Y-o-Y Growth (%) Projections by - Product Format, 2025-2035
  • Figure 167: East Asia Market Value (USD Million) Analysis by - End User, 2020-2035
  • Figure 168: East Asia Market Volume (Units) Analysis by - End User, 2020-2035
  • Figure 169: East Asia Market Value Share (%) and BPS Analysis by - End User, 2025-2035
  • Figure 170: East Asia Market Y-o-Y Growth (%) Projections by - End User, 2025-2035
  • Figure 171: East Asia Market Value (USD Million) Analysis by - Sales Channel, 2020-2035
  • Figure 172: East Asia Market Volume (Units) Analysis by - Sales Channel, 2020-2035
  • Figure 173: East Asia Market Value Share (%) and BPS Analysis by - Sales Channel, 2025-2035
  • Figure 174: East Asia Market Y-o-Y Growth (%) Projections by - Sales Channel, 2025-2035
  • Figure 175: East Asia Market Attractiveness by - Fiber Type, 2025-2035
  • Figure 176: East Asia Market Attractiveness by - Application, 2025-2035
  • Figure 177: East Asia Market Attractiveness by - Product Format, 2025-2035
  • Figure 178: East Asia Market Attractiveness by - End User, 2025-2035
  • Figure 179: East Asia Market Attractiveness by - Sales Channel, 2025-2035
  • Figure 180: East Asia Market Attractiveness by Country, 2025-2035
  • Figure 181: South Asia & Pacific Market Value (USD Million) by - Fiber Type, 2025-2035
  • Figure 182: South Asia & Pacific Market Value (USD Million) by - Application, 2025-2035
  • Figure 183: South Asia & Pacific Market Value (USD Million) by - Product Format, 2025-2035
  • Figure 184: South Asia & Pacific Market Value (USD Million) by - End User, 2025-2035
  • Figure 185: South Asia & Pacific Market Value (USD Million) by - Sales Channel, 2025-2035
  • Figure 186: South Asia & Pacific Market Value (USD Million) by Country, 2025-2035
  • Figure 187: South Asia & Pacific Market Value (USD Million) Analysis by Country, 2020-2035
  • Figure 188: South Asia & Pacific Market Volume (Units) Analysis by Country, 2020-2035
  • Figure 189: South Asia & Pacific Market Value Share (%) and BPS Analysis by Country, 2025-2035
  • Figure 190: South Asia & Pacific Market Y-o-Y Growth (%) Projections by Country, 2025-2035
  • Figure 191: South Asia & Pacific Market Value (USD Million) Analysis by - Fiber Type, 2020-2035
  • Figure 192: South Asia & Pacific Market Volume (Units) Analysis by - Fiber Type, 2020-2035
  • Figure 193: South Asia & Pacific Market Value Share (%) and BPS Analysis by - Fiber Type, 2025-2035
  • Figure 194: South Asia & Pacific Market Y-o-Y Growth (%) Projections by - Fiber Type, 2025-2035
  • Figure 195: South Asia & Pacific Market Value (USD Million) Analysis by - Application, 2020-2035
  • Figure 196: South Asia & Pacific Market Volume (Units) Analysis by - Application, 2020-2035
  • Figure 197: South Asia & Pacific Market Value Share (%) and BPS Analysis by - Application, 2025-2035
  • Figure 198: South Asia & Pacific Market Y-o-Y Growth (%) Projections by - Application, 2025-2035
  • Figure 199: South Asia & Pacific Market Value (USD Million) Analysis by - Product Format, 2020-2035
  • Figure 200: South Asia & Pacific Market Volume (Units) Analysis by - Product Format, 2020-2035
  • Figure 201: South Asia & Pacific Market Value Share (%) and BPS Analysis by - Product Format, 2025-2035
  • Figure 202: South Asia & Pacific Market Y-o-Y Growth (%) Projections by - Product Format, 2025-2035
  • Figure 203: South Asia & Pacific Market Value (USD Million) Analysis by - End User, 2020-2035
  • Figure 204: South Asia & Pacific Market Volume (Units) Analysis by - End User, 2020-2035
  • Figure 205: South Asia & Pacific Market Value Share (%) and BPS Analysis by - End User, 2025-2035
  • Figure 206: South Asia & Pacific Market Y-o-Y Growth (%) Projections by - End User, 2025-2035
  • Figure 207: South Asia & Pacific Market Value (USD Million) Analysis by - Sales Channel, 2020-2035
  • Figure 208: South Asia & Pacific Market Volume (Units) Analysis by - Sales Channel, 2020-2035
  • Figure 209: South Asia & Pacific Market Value Share (%) and BPS Analysis by - Sales Channel, 2025-2035
  • Figure 210: South Asia & Pacific Market Y-o-Y Growth (%) Projections by - Sales Channel, 2025-2035
  • Figure 211: South Asia & Pacific Market Attractiveness by - Fiber Type, 2025-2035
  • Figure 212: South Asia & Pacific Market Attractiveness by - Application, 2025-2035
  • Figure 213: South Asia & Pacific Market Attractiveness by - Product Format, 2025-2035
  • Figure 214: South Asia & Pacific Market Attractiveness by - End User, 2025-2035
  • Figure 215: South Asia & Pacific Market Attractiveness by - Sales Channel, 2025-2035
  • Figure 216: South Asia & Pacific Market Attractiveness by Country, 2025-2035
  • Figure 217: MEA Market Value (USD Million) by - Fiber Type, 2025-2035
  • Figure 218: MEA Market Value (USD Million) by - Application, 2025-2035
  • Figure 219: MEA Market Value (USD Million) by - Product Format, 2025-2035
  • Figure 220: MEA Market Value (USD Million) by - End User, 2025-2035
  • Figure 221: MEA Market Value (USD Million) by - Sales Channel, 2025-2035
  • Figure 222: MEA Market Value (USD Million) by Country, 2025-2035
  • Figure 223: MEA Market Value (USD Million) Analysis by Country, 2020-2035
  • Figure 224: MEA Market Volume (Units) Analysis by Country, 2020-2035
  • Figure 225: MEA Market Value Share (%) and BPS Analysis by Country, 2025-2035
  • Figure 226: MEA Market Y-o-Y Growth (%) Projections by Country, 2025-2035
  • Figure 227: MEA Market Value (USD Million) Analysis by - Fiber Type, 2020-2035
  • Figure 228: MEA Market Volume (Units) Analysis by - Fiber Type, 2020-2035
  • Figure 229: MEA Market Value Share (%) and BPS Analysis by - Fiber Type, 2025-2035
  • Figure 230: MEA Market Y-o-Y Growth (%) Projections by - Fiber Type, 2025-2035
  • Figure 231: MEA Market Value (USD Million) Analysis by - Application, 2020-2035
  • Figure 232: MEA Market Volume (Units) Analysis by - Application, 2020-2035
  • Figure 233: MEA Market Value Share (%) and BPS Analysis by - Application, 2025-2035
  • Figure 234: MEA Market Y-o-Y Growth (%) Projections by - Application, 2025-2035
  • Figure 235: MEA Market Value (USD Million) Analysis by - Product Format, 2020-2035
  • Figure 236: MEA Market Volume (Units) Analysis by - Product Format, 2020-2035
  • Figure 237: MEA Market Value Share (%) and BPS Analysis by - Product Format, 2025-2035
  • Figure 238: MEA Market Y-o-Y Growth (%) Projections by - Product Format, 2025-2035
  • Figure 239: MEA Market Value (USD Million) Analysis by - End User, 2020-2035
  • Figure 240: MEA Market Volume (Units) Analysis by - End User, 2020-2035
  • Figure 241: MEA Market Value Share (%) and BPS Analysis by - End User, 2025-2035
  • Figure 242: MEA Market Y-o-Y Growth (%) Projections by - End User, 2025-2035
  • Figure 243: MEA Market Value (USD Million) Analysis by - Sales Channel, 2020-2035
  • Figure 244: MEA Market Volume (Units) Analysis by - Sales Channel, 2020-2035
  • Figure 245: MEA Market Value Share (%) and BPS Analysis by - Sales Channel, 2025-2035
  • Figure 246: MEA Market Y-o-Y Growth (%) Projections by - Sales Channel, 2025-2035
  • Figure 247: MEA Market Attractiveness by - Fiber Type, 2025-2035
  • Figure 248: MEA Market Attractiveness by - Application, 2025-2035
  • Figure 249: MEA Market Attractiveness by - Product Format, 2025-2035
  • Figure 250: MEA Market Attractiveness by - End User, 2025-2035
  • Figure 251: MEA Market Attractiveness by - Sales Channel, 2025-2035
  • Figure 252: MEA Market Attractiveness by Country, 2025-2035

Frequently Asked Questions

How big is the Food Waste-Derived Protein in 2025?

The global Food Waste-Derived Protein is estimated to be valued at USD 135.6 million in 2025.

What will be the size of Food Waste-Derived Protein in 2035?

The market size for the Food Waste-Derived Protein is projected to reach USD 242.2 million by 2035.

How much will be the Food Waste-Derived Protein growth between 2025 and 2035?

The Food Waste-Derived Protein is expected to grow at a 6.0% CAGR between 2025 and 2035.

What are the key protein sources in the Food Waste-Derived Protein?

The key protein sources in the Food Waste-Derived Protein Market are fruit & vegetable waste protein, cereal & grain waste protein, dairy & cheese whey waste protein, legume & pulse waste protein, meat & fish processing waste protein, brewery & distillery waste protein, bakery waste protein, and other agro-industrial waste protein.

Which processing technology segment to contribute significant share in the Food Waste-Derived Protein in 2025?

In terms of processing technology, Enzymatic Hydrolysis is projected to command the highest share at 25% in the Food-Waste Derived Protein Market in 2025.

Explore Similar Insights

Future Market Insights

Food Waste-Derived Protein Market