Reports

- Global Locations -

Headquarters

Future Market Insights, Inc.

Christiana Corporate, 200
Continental Drive, Suite 401,
Newark, Delaware - 19713,
United States

T: +1-347-918-3531

Americas

Future Market Insights, Inc.

616 Corporate Way, Suite 2-9018,
Valley Cottage, NY 10989, United States

MEA

Future Market Insights

1602-6 Jumeirah Bay X2 Tower, Plot No: JLT-PH2-X2A,
Jumeirah Lakes Towers, Dubai,
United Arab Emirates

Europe

Future Market Insights

3rd Floor, 207 Regent Street,
W1B 3HH London
United Kingdom

T: + 44 (0) 20 8123 9659

Asia Pacific

Future Market Insights

IndiaLand Global Tech Park, Unit UG-1, Behind Grand HighStreet, Phase 1, Hinjawadi, MH, Pune – 411057, India

Food & Beverage Industrial Disinfection and Cleaning Market Outlook (2023 to 2033)

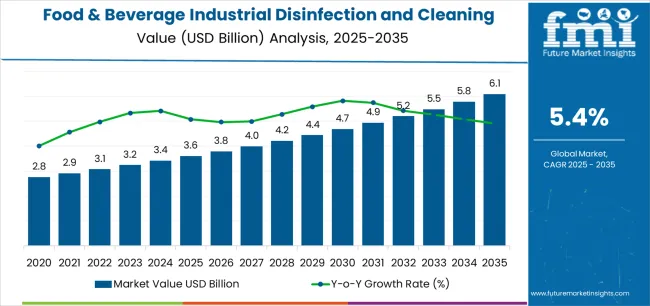
The global food & beverage industrial disinfection and cleaning market size is expected to top around US$ 3,270.9 million in 2023. It is projected to increase at a CAGR of 5.4% from 2023 to 2033.

The global market is anticipated to reach a valuation of US$ 5,549.2 million by 2033. Rising demand for cleaning products has been witnessed in countries such as India, China, and Japan. This puts East Asia and South Asia Pacific in a prime position to continue to play a significant role in the industry.

Recent years have seen growing concerns over the prevalence of food-borne diseases caused by pathogens, radioactive substances, and inorganic chemicals. According to the World Health Organization, tainted food is responsible for food-borne illnesses in 10% of the global population.

As a result, there has been increased regulatory control both within and outside the food & beverage industry in all economies.

The prevalence is particularly high in undeveloped and developing parts of Asia, Africa, and South America. Governments in these areas are hence stepping up their efforts to impose appropriate food testing and disinfection procedures for food safety.

Owing to these advances, the market for food-safe disinfectants has experienced tremendous growth over the past several years.

In other countries, the food & beverage disinfection industry is experiencing growth due to rising demand for food-grade disinfectants and need to prevent outbreaks of foodborne illnesses. There is an increased focus on reducing food waste, which has popularized the use of food-safe disinfectant sprays in numerous developed countries.

Cleaning and disinfecting are essential steps in the production process. If not done properly, disinfection can have negative effects. Effective cleaning is required prior to disinfection in order to remove dirt, residues, and other particulates.

Microbial growth is greatly slowed down when validated disinfectants are used in accordance with directions and contact times. It is crucial to take into account a disinfectant's toxicity, any lingering residues, and the effect of water hardness while making one’s choice.

Due to the fact that a few disinfectants do not work effectively in cold temperatures, temperature is another crucial consideration. A primary factor influencing the disinfectant used is the nature of the product being manufactured and processed.

Attributes Key Insights
Food & Beverage Industrial Disinfection and Cleaning Market Estimated Size (2023E) US$ 3,270.9 million
Projected Market Valuation (2033F) US$ 5,549.2 million
Value-based CAGR (2023 to 2033) 5.4%
Collective Value Share: Top 3 Countries (2023) 40% to 45%

Don't pay for what you don't need

Customize your report by selecting specific countries or regions and save 30%!

2018 to 2022 Food & Beverage Industrial Disinfection and Cleaning Sales Outlook Compared to Demand Forecast from 2023 to 2033

According to Future Market Insights (FMI), the global food-grade disinfectant market was valued at US$ 3,120.4 million in 2022. Despite a slowdown due to the pandemic between 2018 and 2022, the market maintained an average CAGR of 5.3%.

The pandemic has also notably increased awareness among food & beverage producers about the importance of preventing viral infections among consumers.

This has led to a boost in the market worldwide as several countries have increased their standards for food safety and hygiene. As per current estimates, the market is expected to witness a CAGR of around 5.4% between 2023 and 2033. It is mainly driven by innovations in cutting-edge technologies such as UV radiation and ozone to provide safe & healthy food.

Ammonium sulfate combinations adhere to certain surfaces such as glass, and could negatively influence the retention of beer heads. This is a key reason why they are not used as cleaning agents in the beverage industry. Caustic detergents with a saline or sodium hydroxide base are frequently employed in the dairy industry as they saponify recalcitrant milk lipids.

Top Food & Beverage Industrial Disinfection and Cleaning Market Trends

  • Food contamination can result from unsafe practices during food processing and storage, as well as environmental pollution from sources such as soil, water, or air.
  • These factors can act alone or in combination to contribute to the development of foodborne diseases.
  • The World Health Organization reports that consuming food contaminated with harmful bacteria, parasites, viruses, or chemicals such as heavy metals can cause over two hundred different diseases.
  • Each year, this results in six hundred million cases of foodborne illnesses and four lakhs twenty thousand deaths worldwide.
  • Children under five years old are responsible for 30% of these fatalities.
  • World Health Organization also estimates that consuming unsafe food results in a loss of 33 million healthy people globally every year.
  • To address the issue of food safety and prevent foodborne illnesses, the World Health Organization recommends coordinated efforts across different sectors, including increased investments by manufacturers.
  • The goal is to establish robust national food safety systems that can withstand potential hazards and ensure the safety of food supply.
  • They seek to empower consumers by providing them with the necessary tools to make informed decisions about safe food choices.
  • Due to the saturated market, differentiators such as an appealing pack can boost the product's shelf appeal and affect a customer's fast purchase decision.
  • Creating chemicals and polymers that give cleaning products a pleasant fragrance is anticipated to present new prospects for the industry.
  • Traditional cleaning product packaging has typically been loud, bright, and emphasized with graphic features, including bursts and gradients that emphasize how well they clean.
  • In contrast, natural product design frequently uses translucent or white structures and neutral color schemes to convey the sincerity and purity of products.
  • To gain a competitive edge over others, visual appeal of a product plays a crucial role in attracting consumers and driving sales.
  • Manufacturers would find sizeable opportunity upon considering the importance of label or packaging design in creating a strong shelf presence.
  • There is an increasing demand for chemical cleaners that offer both aesthetic appeal and pleasing fragrances, which presents a significant opportunity for manufacturers.
Nikhil Kaitwade
Nikhil Kaitwade

Principal Consultant

Talk to Analyst

Find your sweet spots for generating winning opportunities in this market.

Which Factors are Hampering Food & Beverage Industrial Disinfection and Cleaning Demand?

  • Certain chemical disinfectants can be dangerous due to their potential for explosion or flammability.
  • They can also lead to the emission of toxic fumes and have strong reactions with incompatible compounds.
  • All chemical disinfectants can be harmful or lethal to living organisms due to their inherent chemical properties.
  • Once these chemical disinfectants enter the body, they have the potential to cause harm, similar to other hazardous substances.
  • Only a handful of high-level disinfectant products have been approved by the Food and Drug Administration (FDA) for healthcare applications, which include hydrogen peroxide, per-acetic acid, and hypochlorite.
  • Being a toxic chemical, disposal of disinfectants is another big challenge as, ultimately, they are harmful to the environment.
  • Numerous regulations applied by the Occupational Safety and Health Administration (OSHA) on waste disposal of disinfectant products are forcing users to decrease consumption of these chemicals.
  • The aforementioned facts are poised to result in hampered demand for disinfectant products and chemicals in the food & beverage cleaning industry during the forecast period.

Country-wise Insights

Why is the USA Showcasing High Sales of Food & Beverage Industrial Disinfection and Cleaning Products?

Increasing Development of Hospitals in the USA to Propel Disinfection Cleaning Services

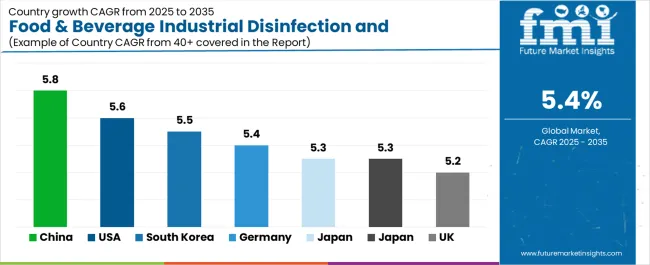
Demand for cleaning and disinfection services remains prominent in the USA. The country is expected to hold around 84.0% of the North America market share over the forecast period.

This can be attributed to factors such as rising hospital constructions and growing awareness about the significance of maintaining a clean & hygienic environment.

Industrial chemicals are widely used in various sectors in the USA, including the food & beverage processing sector. In particular, the market for industrial cleaning chemicals in the country is expected to experience significant growth during the forecast period.

This is attributed to factors such as increasing consumption of packaged foods and improvements in living standards. These trends have contributed to the growing demand for industrial disinfectants in the country.

What Makes Germany a Leading Hub for Food & Beverage Cleaning Chemicals?

Strict Worker Safety Norms in Germany to Fuel Demand for Cleaning and Disinfection Procedures

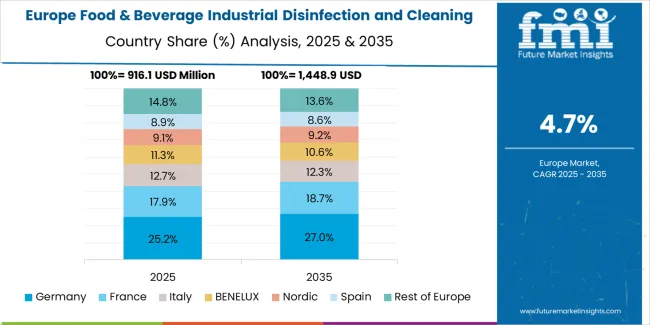
Germany is expected to dominate the Europe food & beverage industrial disinfection and cleaning market during the assessment period. The country has an extremely prominent healthcare sector compared to other countries in Europe. It has an estimated annual healthcare expenditure exceeding US$ 408.6 billion, which excludes fitness and wellness.

The country has been investing in mobile healthcare facilities, driven by demographic changes and high rates of digitalization. These facilities would provide a platform for further expansion of the healthcare sector in Germany.

The food & beverage industry of the country ranks fourth in terms of size, and is set to have a positive outlook in the evaluation period. The industry is unique due to the presence of a significant number of small and medium-sized enterprises.

Over 6,000 such companies operate within this sector. Enactment of stringent regulations for the safety of workers in industrial surroundings is also propelling demand for cleaning chemicals in Germany.

Get the data you need at a Fraction of the cost

Personalize your report by choosing insights you need
and save 40%!

Category-wise Insights

Which is the Leading Application of Food & Beverage Industrial Disinfection and Cleaning Items?

Demand for Disinfection Cleaning Services to Skyrocket among Processed Food Companies

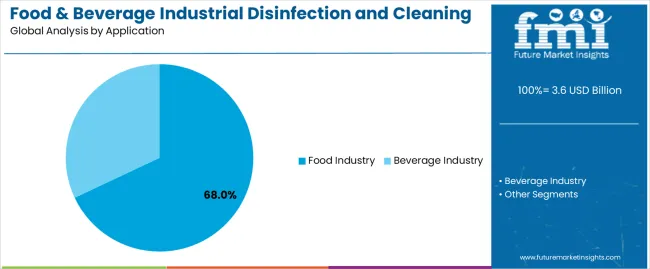
On the basis of application, the processed food segment accounted for a 7.5% market share in 2022. In order to maintain a longer shelf life, food commodities such as vegetables and meat need to be packaged properly. As customers do not favor food surface disinfection, manufacturers are switching to other disinfection methods to package food products.

Several food & beverage firms are utilizing cutting-edge disinfection technologies to meet changing demands. This includes steam ultrasound and ozonation, as they can disinfect quickly and produce high-quality food. This further decreases the deformation of packed foods and saves energy.

To fulfil the rising demand for packaged and processed food in the country, producers in developing countries such as India and China are adopting novel disinfection techniques. Agriculture and Agri-Food Canada (AAFC) reports that China is one among the highly significant and rapidly expanding markets for packaged food products.

Growing demand for innovative products is set to increase investments by renowned players across the globe. It is set to compel manufacturing companies to place a greater emphasis on research and development activities.

Which is the Most Preferred Food & Beverage Industrial Disinfection and Cleaning Solution?

Sales of Environmental Cleaning and Disinfection Products in the Form of Hydrogen Peroxide to Expand

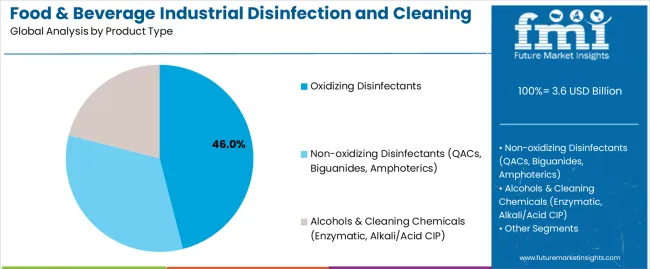
In terms of product type, the hydrogen peroxide segment held a 14.3% value share in 2022. Preferred disinfectants for ensuring food safety are hydrogen peroxide and per-acetic acid, as they can be directly applied to food surfaces to eliminate pathogens.

Chlorine-based chemical compounds are expected to gain significant ground over the forecast period, as compared to other types of disinfectants.

Chlorine dioxide and other similar compounds play a crucial role in maintaining basic sanitation during food processing stages. These compounds are environmentally friendly and have received approval from regulatory authorities.

A versatile disinfectant, chlorine might be employed in pasteurization devices, heat exchangers, and potable water treatment, among other sanitation uses. The market for food-safe disinfectant sprays is projected to develop significantly between 2023 to 2033 as ozone oxidation becomes increasingly popular.

Competitive Landscape

Key companies are focusing on developing innovative products and increasing their production facilities in domestic areas, as well as different geographies to cater to various markets. Few of the key players are collaborating and partnering with other companies to strengthen their product portfolios.

In recent years, there has been an increasing demand for sustainable solutions. This is a direct outcome of increasing environmental regulations, as well as growing concerns about health hazards. Prominent players are further focusing on introducing innovative solutions by using degradable products in the market space.

For instance

  • In January 2023, Ecolab introduced a new product called Active OX+ No-Rinse Disinfectant. This product is specifically designed for food processors, and is listed by the USA Organic Materials Review Institute (OMRI). Use of this product allows food processors to simplify their disinfecting process without compromising quality standards. It is expected to reduce the usage of chemicals and resources while improving the quality of effluent, which will ultimately help to mitigate negative environmental impacts.
  • In September 2022, An EPA-certified disinfectant cleaner and safer choice cleaners were introduced by CloroxPro. The company is intended for use on 20 common surfaces, including countertops, stainless steel, and appliances. The product can be used on a variety of surfaces, including desks, hard chairs, classroom tables, and lavatory surfaces. It is safe and efficient, making it perfect for use in school cafeterias and commercial kitchens.
  • In January 2021, Neogen Corporation acquired a company known as Megazyme, Ltd. It is a supplier of analytical solutions for the food & beverage industry based in Ireland. This acquisition will help expand Neogen Corporation's market presence and enable the company to offer its range of products to a wider client base in Ireland.
  • In December 2021, Kersia, a company operating in the food safety and biosecurity industry, entered into an exclusive agreement to acquire a controlling stake in Kalinisan Chemicals Corporation. It is a Philippines-based company. The agreement is based on the potential for positive synergies between the two companies. Both have complementary geographical, business, industrial, and innovation profiles.

Scope of the Report

Attribute Details
Estimated Market Size (2023) US$ 3,270.9 million
Projected Market Valuation (2033) US$ 5,549.2 million
Value-based CAGR (2023 to 2033) 5.4%
Forecast Period 2023 to 2033
Historical Data Available for 2018 to 2022
Market Analysis Value (US$ million) and Volume (Tons)
Key Regions Covered
  • North America
  • Latin America
  • Western Europe
  • Eastern Europe
  • Central Asia
  • Russia and Belarus
  • Balkan and Baltic
  • South Asia Pacific
  • East Asia
  • Middle East and Africa
Key Countries Covered USA, Canada, Brazil, Mexico, Germany, United Kingdom, France, Italy, Spain, Russia, China, Japan, South Korea, India, Association of Southeast Asian Nations, Australia and New Zealand, Gulf Co-operation Council Countries, Türkiye, Northern Africa, and South Africa
Key Market Segments Covered By Product Type, Process, Application, and Region
Key Companies Profiled
  • Diversey Holdings, Ltd.
  • Neogen Corporation
  • Pilot Chemical Company
  • Nilfisk Food
  • Kersia Group
  • CHRISTIANS
  • Danaher Corporation
  • Solvay
  • Ecolab
  • Evonik Industries
  • Lagafors AB
  • FOAMit
  • Rossari Biotech
  • Lilleborg AS
  • Stepan Company
  • Nerta (Entaco N.V.)
  • Foamico
  • Jürgen Löhrke GmbH
  • Dosanova BV
  • PROQUIMIA S.A.
  • Novadan
  • Calvatis GmbH
  • Kiilto
  • IXOM Operations Pte Ltd
  • Epsilon Chemicals Ltd.
  • BASF SE
Report Coverage Market Forecast, Company Share Analysis, Competition Intelligence, Drivers Restraints Opportunity Trends Analysis, Market Dynamics and Challenges, and Strategic Growth Initiatives

Food & Beverage Industrial Disinfection and Cleaning Market Outlook by Category

By Product Type:

  • Oxidizing Disinfectants
    • Sodium Hypochlorite
    • Chlorine Dioxide
    • Hydrogen Peroxide
    • Peracetic Acid and Iodophors
  • Non-Oxidizing Disinfectants
    • Quaternary Ammonium Compound
    • Triamines
    • Biguanides
  • Alcohols and Cleaning Chemicals
    • Acid Cleaners
    • Detergents
    • Foaming Cleaners
    • Alkaline Cleaners
    • General Purpose Cleaners
    • Solvents

By Process:

  • Coagulation
  • Steam Sterilization
  • Pasteurization
  • Carbonation
  • Chlorination
  • UV Process
  • Ozonation
  • Others

By Application:

  • Food Industry
    • Meat and Poultry
    • Fish and Seafood
    • Fruits and Vegetables
    • Dairy Products
    • Processed Foods
    • Others
  • Beverage Industry
    • Alcoholic Beverages
    • Non-Alcoholic Beverages

By Region:

  • North America
  • Latin America
  • Western Europe
  • Eastern Europe
  • Central Asia
  • Russia and Belarus
  • Balkan and Baltic
  • South Asia Pacific
  • East Asia
  • Middle East and Africa

Frequently Asked Questions

What Is the Current Size of The Market?

In 2023, the market is expected to be around US$ 3,270.9 million.

What Is the Market's Estimation In 2033?

By 2033, the market is expected to be worth US$ 5,549.2 million.

How Much Market Growth Is Anticipated at What CAGR?

The food & beverage industrial disinfection and cleaning market to endure at a 5.4% CAGR through 2033.

How Much Did the Market's HCAGR Progress?

The food & beverage industrial disinfection and cleaning sales increased at an HCAGR of 3.9% between 2018 and 2022.

Which Product Type Segment Represents the Majority?

The category for hydrogen peroxide anticipates a 14.3% value share in terms of product type.

What Are the United States’ Economic Future Outlook?

To possess 84.0% of the food & beverage industrial disinfection and cleaning market share in North America.

Table of Content

1. Executive Summary | Food & Beverage Industrial Disinfection and Cleaning Market

    1.1. Global Market Outlook

    1.2. Demand Side Trends

    1.3. Supply Side Trends

    1.4. Process Roadmap

    1.5. Analysis and Recommendations

2. Market Overview

    2.1. Market Coverage / Taxonomy

    2.2. Market Definition / Scope / Limitations

3. Key Market Trends

    3.1. Key Trends Impacting the Market

    3.2. Material Innovation / Development Trends

4. Key Success Factors

    4.1. Material Adoption / Usage Analysis

    4.2. Material USPs / Features

    4.3. Strategic Promotional Strategies

5. Global Market Demand Analysis 2018 to 2022 and Forecast, 2023 to 2033

    5.1. Historical Market Volume (Tons) Analysis, 2018 to 2022

    5.2. Current and Future Market Volume (Tons) Projections, 2023 to 2033

    5.3. Y-o-Y Growth Trend Analysis

6. Global Market - Pricing Analysis

    6.1. Regional Pricing Analysis

    6.2. Global Average Pricing Analysis Benchmark

7. Global Market Demand (in Value or Size in US$ million) Analysis 2018 to 2022 and Forecast, 2023 to 2033

    7.1. Historical Market Value (US$ million) Analysis, 2018 to 2022

    7.2. Current and Future Market Value (US$ million) Projections, 2023 to 2033

        7.2.1. Y-o-Y Growth Trend Analysis

        7.2.2. Absolute $ Opportunity Analysis

8. Market Background

    8.1. Macro-Economic Factors

    8.2. Forecast Factors - Relevance and Impact

    8.3. Value Chain

        8.3.1. Material Manufacturers

        8.3.2. Distributors

        8.3.3. Probable End-Users

        8.3.4. Average Profitability Margin

    8.4. COVID-19 Crisis – Impact Assessment

        8.4.1. Current Statistics

        8.4.2. Short-Mid-Long Term Outlook

        8.4.3. Likely Rebound

    8.5. Market Dynamics

        8.5.1. Drivers

        8.5.2. Restraints

        8.5.3. Opportunity Analysis

    8.6. Global Supply Demand Analysis

    8.7. Key Developments

    8.8. Patent Analysis

9. Global Market Analysis 2018 to 2022 and Forecast 2023 to 2033, by Product Type

    9.1. Introduction / Key Findings

    9.2. Historical Market Size (US$ million) and Volume (Tons) Analysis by Product Type, 2018 to 2022

    9.3. Current and Future Market Size (US$ million) and Volume Analysis and Forecast by Product Type, 2023 to 2033

        9.3.1. Oxidizing Disinfectants

            9.3.1.1. Sodium Hypochlorite

            9.3.1.2. Chlorine Dioxide

            9.3.1.3. Hydrogen Peroxide

            9.3.1.4. Peracetic Acid and Iodophores

        9.3.2. Non-Oxidizing Disinfectants

            9.3.2.1. Quaternary Ammonium Compounds

            9.3.2.2. Triamines

            9.3.2.3. Biguanides

        9.3.3. Alcohols and Cleaning Chemicals

            9.3.3.1. Acid Cleaners

            9.3.3.2. Detergents

            9.3.3.3. Foaming Cleaners

            9.3.3.4. Alkaline Cleaners

            9.3.3.5. General Purpose Cleaners

            9.3.3.6. Solvents

    9.4. Market Attractiveness Analysis by Product Type

10. Global Market Analysis 2018 to 2022 and Forecast 2023 to 2033, by Process

    10.1. Introduction / Key Findings

    10.2. Historical Market Size (US$ million) and Volume (Tons) Analysis by Process, 2018 to 2022

    10.3. Current and Future Market Size (US$ million) and Volume Analysis and Forecast by Process, 2023 to 2033

        10.3.1. Coagulation

        10.3.2. Steam Sterilization

        10.3.3. Pasteurization

        10.3.4. Carbonation

        10.3.5. Chlorination

        10.3.6. UV Technology

        10.3.7. Ozonation

        10.3.8. Others

    10.4. Market Attractiveness Analysis by Process

11. Global Market Analysis 2018 to 2022 and Forecast 2023 to 2033, by Application

    11.1. Introduction / Key Findings

    11.2. Historical Market Size (US$ million) and Volume (Tons) Analysis by Application, 2018 to 2022

    11.3. Current and Future Market Size (US$ million) and Volume Analysis and Forecast by Application, 2023 to 2033

        11.3.1. Food Industry

            11.3.1.1. Meat and Poultry

            11.3.1.2. Fish and Seafood

            11.3.1.3. Fruits and Vegetables

            11.3.1.4. Dairy Products

            11.3.1.5. Processed Foods

            11.3.1.6. Others

        11.3.2. Beverage Industry

            11.3.2.1. Alcoholic Beverages

            11.3.2.2. Non-alcoholic Beverages

    11.4. Market Attractiveness Analysis by Application

12. Global Market Analysis 2018 to 2022 and Forecast 2023 to 2033, by Region

    12.1. Introduction

    12.2. Historical Market Size (US$ million) and Volume (Tons) Analysis by Region, 2018 to 2022

    12.3. Current Market Size (US$ million) and Volume (Tons) Analysis and Forecast by Region, 2023 to 2033

        12.3.1. North America

        12.3.2. Latin America

        12.3.3. East Asia

        12.3.4. South Asia and Pacific

        12.3.5. Western Europe

        12.3.6. Eastern Europe

        12.3.7. Central Asia

        12.3.8. Russia and Belarus

        12.3.9. Balkan and Baltic Countries

        12.3.10. Middle East and Africa

    12.4. Market Attractiveness Analysis by Region

13. North America Market Analysis 2018 to 2022 and Forecast 2023 to 2033

    13.1. Introduction

    13.2. Pricing Analysis

    13.3. Historical Market Size (US$ million) and Volume Trend Analysis by Market Taxonomy, 2018 to 2022

    13.4. Market Size (US$ million) and Volume Forecast by Market Taxonomy, 2023 to 2033

        13.4.1. by Country

            13.4.1.1. USA

            13.4.1.2. Canada

        13.4.2. by Product Type

        13.4.3. by Process

        13.4.4. by Application

    13.5. Market Attractiveness Analysis

        13.5.1. by Country

        13.5.2. by Product Type

        13.5.3. by Process

        13.5.4. by Application

    13.6. Key Market Participants - Intensity Mapping

14. Latin America Market Analysis 2018 to 2022 and Forecast 2023 to 2033

    14.1. Introduction

    14.2. Pricing Analysis

    14.3. Historical Market Size (US$ million) and Volume Trend Analysis by Market Taxonomy, 2018 to 2022

    14.4. Market Size (US$ million) and Volume Forecast by Market Taxonomy, 2023 to 2033

        14.4.1. by Country

            14.4.1.1. Brazil

            14.4.1.2. Mexico

            14.4.1.3. Argentina

        14.4.2. by Product Type

        14.4.3. by Process

        14.4.4. by Application

    14.5. Market Attractiveness Analysis

        14.5.1. by Country

        14.5.2. by Product Type

        14.5.3. by Process

        14.5.4. by Application

    14.6. Key Market Participants - Intensity Mapping

15. East Asia Market Analysis 2018 to 2022 and Forecast 2023 to 2033

    15.1. Introduction

    15.2. Pricing Analysis

    15.3. Historical Market Size (US$ million) and Volume Trend Analysis by Market Taxonomy, 2018 to 2022

    15.4. Market Size (US$ million) and Volume Forecast by Market Taxonomy, 2023 to 2033

        15.4.1. by Country

            15.4.1.1. China

            15.4.1.2. Japan

            15.4.1.3. South Korea

        15.4.2. by Product Type

        15.4.3. by Process

        15.4.4. by Application

    15.5. Market Attractiveness Analysis

        15.5.1. by Country

        15.5.2. by Product Type

        15.5.3. by Process

        15.5.4. by Application

    15.6. Key Market Participants - Intensity Mapping

16. South Asia and Pacific Market Analysis 2018 to 2022 and Forecast 2023 to 2033

    16.1. Introduction

    16.2. Pricing Analysis

    16.3. Historical Market Size (US$ million) and Volume Trend Analysis by Market Taxonomy, 2018 to 2022

    16.4. Market Size (US$ million) and Volume Forecast by Market Taxonomy, 2023 to 2033

        16.4.1. by Country

            16.4.1.1. India

            16.4.1.2. The Association of Southeast Asian Nations

            16.4.1.3. Australia and New Zealand

        16.4.2. by Product Type

        16.4.3. by Process

        16.4.4. by Application

    16.5. Market Attractiveness Analysis

        16.5.1. by Country

        16.5.2. by Product Type

        16.5.3. by Process

        16.5.4. by Application

    16.6. Key Market Participants - Intensity Mapping

17. Western Europe Market Analysis 2018 to 2022 and Forecast 2023 to 2033

    17.1. Introduction

    17.2. Pricing Analysis

    17.3. Historical Market Size (US$ million) and Volume Trend Analysis by Market Taxonomy, 2018 to 2022

    17.4. Market Size (US$ million) and Volume Forecast by Market Taxonomy, 2023 to 2033

        17.4.1. by Country

            17.4.1.1. Germany

            17.4.1.2. Italy

            17.4.1.3. France

            17.4.1.4. United Kingdom

            17.4.1.5. Spain

            17.4.1.6. Benelux

            17.4.1.7. Nordics

        17.4.2. by Product Type

        17.4.3. by Process

        17.4.4. by Application

    17.5. Market Attractiveness Analysis

        17.5.1. by Country

        17.5.2. by Product Type

        17.5.3. by Process

        17.5.4. by Application

    17.6. Key Market Participants - Intensity Mapping

18. Eastern Europe Market Analysis 2018 to 2022 and Forecast 2023 to 2033

    18.1. Introduction

    18.2. Pricing Analysis

    18.3. Historical Market Size (US$ million) and Volume Trend Analysis by Market Taxonomy, 2018 to 2022

    18.4. Market Size (US$ million) and Volume Forecast by Market Taxonomy, 2023 to 2033

        18.4.1. by Country

            18.4.1.1. Poland

            18.4.1.2. Hungary

            18.4.1.3. Romania

            18.4.1.4. Czech Republic

            18.4.1.5. Others

        18.4.2. by Product Type

        18.4.3. by Process

        18.4.4. by Application

    18.5. Market Attractiveness Analysis

        18.5.1. by Country

        18.5.2. by Product Type

        18.5.3. by Process

        18.5.4. by Application

    18.6. Key Market Participants - Intensity Mapping

19. Central Asia Market Analysis 2018 to 2022 and Forecast 2023 to 2033

    19.1. Introduction

    19.2. Pricing Analysis

    19.3. Historical Market Size (US$ million) and Volume Trend Analysis by Market Taxonomy, 2018 to 2022

    19.4. Market Size (US$ million) and Volume Forecast by Market Taxonomy, 2023 to 2033

        19.4.1. by Country

        19.4.2. by Product Type

        19.4.3. by Process

        19.4.4. by Application

    19.5. Market Attractiveness Analysis

        19.5.1. by Country

        19.5.2. by Product Type

        19.5.3. by Process

        19.5.4. by Application

    19.6. Key Market Participants - Intensity Mapping

20. Russia and Belarus Market Analysis 2018 to 2022 and Forecast 2023 to 2033

    20.1. Introduction

    20.2. Pricing Analysis

    20.3. Historical Market Size (US$ million) and Volume Trend Analysis by Market Taxonomy, 2018 to 2022

    20.4. Market Size (US$ million) and Volume Forecast by Market Taxonomy, 2023 to 2033

        20.4.1. by Country

        20.4.2. by Product Type

        20.4.3. by Process

        20.4.4. by Application

    20.5. Market Attractiveness Analysis

        20.5.1. by Country

        20.5.2. by Product Type

        20.5.3. by Process

        20.5.4. by Application

    20.6. Key Market Participants - Intensity Mapping

21. Balkan and Baltic Countries Market Analysis 2018 to 2022 and Forecast 2023 to 2033

    21.1. Introduction

    21.2. Pricing Analysis

    21.3. Historical Market Size (US$ million) and Volume Trend Analysis by Market Taxonomy, 2018 to 2022

    21.4. Market Size (US$ million) and Volume Forecast by Market Taxonomy, 2023 to 2033

        21.4.1. by Country

        21.4.2. by Product Type

        21.4.3. by Process

        21.4.4. by Application

    21.5. Market Attractiveness Analysis

        21.5.1. by Country

        21.5.2. by Product Type

        21.5.3. by Process

        21.5.4. by Application

    21.6. Key Market Participants - Intensity Mapping

22. Middle East and Africa Market Analysis 2018 to 2022 and Forecast 2023 to 2033

    22.1. Introduction

    22.2. Pricing Analysis

    22.3. Historical Market Size (US$ million) and Volume Trend Analysis by Market Taxonomy, 2018 to 2022

    22.4. Market Size (US$ million) and Volume Forecast by Market Taxonomy, 2023 to 2033

        22.4.1. by Country

            22.4.1.1. Gulf Cooperation Council

            22.4.1.2. Türkiye

            22.4.1.3. Northern Africa

            22.4.1.4. South Africa

            22.4.1.5. Rest of Middle East and Africa

        22.4.2. by Product Type

        22.4.3. by Process

        22.4.4. by Application

    22.5. Market Attractiveness Analysis

        22.5.1. by Country

        22.5.2. by Product Type

        22.5.3. by Process

        22.5.4. by Application

    22.6. Key Market Participants - Intensity Mapping

23. Country Wise Market Analysis

    23.1. USA Market Analysis

        23.1.1. by Product Type

        23.1.2. by Process

        23.1.3. by Application

    23.2. Canada Market Analysis

        23.2.1. by Product Type

        23.2.2. by Process

        23.2.3. by Application

    23.3. Mexico Market Analysis

        23.3.1. by Product Type

        23.3.2. by Process

        23.3.3. by Application

    23.4. Brazil Market Analysis

        23.4.1. by Product Type

        23.4.2. by Process

        23.4.3. by Application

    23.5. Argentina Market Analysis

        23.5.1. by Product Type

        23.5.2. by Process

        23.5.3. by Application

    23.6. China Market Analysis

        23.6.1. by Product Type

        23.6.2. by Process

        23.6.3. by Application

    23.7. Japan Market Analysis

        23.7.1. by Product Type

        23.7.2. by Process

        23.7.3. by Application

    23.8. S. Korea Market Analysis

        23.8.1. by Product Type

        23.8.2. by Process

        23.8.3. by Application

    23.9. India Market Analysis

        23.9.1. by Product Type

        23.9.2. by Process

        23.9.3. by Application

    23.10. The Association of Southeast Asian Nations Market Analysis

        23.10.1. by Product Type

        23.10.2. by Process

        23.10.3. by Application

    23.11. Australia and New Zealand Market Analysis

        23.11.1. by Product Type

        23.11.2. by Process

        23.11.3. by Application

    23.12. Germany Market Analysis

        23.12.1. by Product Type

        23.12.2. by Process

        23.12.3. by Application

    23.13. Italy Market Analysis

        23.13.1. by Product Type

        23.13.2. by Process

        23.13.3. by Application

    23.14. France Market Analysis

        23.14.1. by Product Type

        23.14.2. by Process

        23.14.3. by Application

    23.15. United Kingdom Market Analysis

        23.15.1. by Product Type

        23.15.2. by Process

        23.15.3. by Application

    23.16. Spain Market Analysis

        23.16.1. by Product Type

        23.16.2. by Process

        23.16.3. by Application

    23.17. Benelux Market Analysis

        23.17.1. by Product Type

        23.17.2. by Process

        23.17.3. by Application

    23.18. Nordics Market Analysis

        23.18.1. by Product Type

        23.18.2. by Process

        23.18.3. by Application

    23.19. Poland Market Analysis

        23.19.1. by Product Type

        23.19.2. by Process

        23.19.3. by Application

    23.20. Hungary Market Analysis

        23.20.1. by Product Type

        23.20.2. by Process

        23.20.3. by Application

    23.21. Romania Market Analysis

        23.21.1. by Product Type

        23.21.2. by Process

        23.21.3. by Application

    23.22. Czech Republic Market Analysis

        23.22.1. by Product Type

        23.22.2. by Process

        23.22.3. by Application

    23.23. Gulf Cooperation Council Market Analysis

        23.23.1. by Product Type

        23.23.2. by Process

        23.23.3. by Application

    23.24. Türkiye Market Analysis

        23.24.1. by Product Type

        23.24.2. by Process

        23.24.3. by Application

    23.25. Northern Africa Market Analysis

        23.25.1. by Product Type

        23.25.2. by Process

        23.25.3. by Application

    23.26. South Africa Market Analysis

        23.26.1. by Product Type

        23.26.2. by Process

        23.26.3. by Application

24. Market Structure Analysis

    24.1. Market Analysis by Tier of Companies (Food and Beverage Industrial Disinfection and Cleaning)

    24.2. Market Share Analysis of Top Players

    24.3. Market Presence Analysis

25. Competition Analysis

    25.1. Competition Dashboard

    25.2. Competition Benchmarking

    25.3. Competition Deep Dive

        25.3.1. BASF SE

            25.3.1.1. Overview

            25.3.1.2. Material Portfolio

            25.3.1.3. Profitability by Market Segments (Material/Channel/Region)

            25.3.1.4. Sales Footprint

            25.3.1.5. Strategy Overview

        25.3.2. Diversey Holdings, Ltd.

            25.3.2.1. Overview

            25.3.2.2. Material Portfolio

            25.3.2.3. Profitability by Market Segments (Material/Channel/Region)

            25.3.2.4. Sales Footprint

            25.3.2.5. Strategy Overview

        25.3.3. Neogen Corporation

            25.3.3.1. Overview

            25.3.3.2. Material Portfolio

            25.3.3.3. Profitability by Market Segments (Material/Channel/Region)

            25.3.3.4. Sales Footprint

            25.3.3.5. Strategy Overview

        25.3.4. Pilot Chemical Company

            25.3.4.1. Overview

            25.3.4.2. Material Portfolio

            25.3.4.3. Profitability by Market Segments (Material/Channel/Region)

            25.3.4.4. Sales Footprint

            25.3.4.5. Strategy Overview

        25.3.5. Nilfisk Food

            25.3.5.1. Overview

            25.3.5.2. Material Portfolio

            25.3.5.3. Profitability by Market Segments (Material/Channel/Region)

            25.3.5.4. Sales Footprint

            25.3.5.5. Strategy Overview

        25.3.6. Kersia Group

            25.3.6.1. Overview

            25.3.6.2. Material Portfolio

            25.3.6.3. Profitability by Market Segments (Material/Channel/Region)

            25.3.6.4. Sales Footprint

            25.3.6.5. Strategy Overview

        25.3.7. CHRISTYENS

            25.3.7.1. Overview

            25.3.7.2. Material Portfolio

            25.3.7.3. Profitability by Market Segments (Material/Channel/Region)

            25.3.7.4. Sales Footprint

            25.3.7.5. Strategy Overview

        25.3.8. Danaher Corporation

            25.3.8.1. Overview

            25.3.8.2. Material Portfolio

            25.3.8.3. Profitability by Market Segments (Material/Channel/Region)

            25.3.8.4. Sales Footprint

            25.3.8.5. Strategy Overview

        25.3.9. Solvay

            25.3.9.1. Overview

            25.3.9.2. Material Portfolio

            25.3.9.3. Profitability by Market Segments (Material/Channel/Region)

            25.3.9.4. Sales Footprint

            25.3.9.5. Strategy Overview

        25.3.10. EcoLab

            25.3.10.1. Overview

            25.3.10.2. Material Portfolio

            25.3.10.3. Profitability by Market Segments (Material/Channel/Region)

            25.3.10.4. Sales Footprint

            25.3.10.5. Strategy Overview

        25.3.11. Evonik Industries

            25.3.11.1. Overview

            25.3.11.2. Material Portfolio

            25.3.11.3. Profitability by Market Segments (Material/Channel/Region)

            25.3.11.4. Sales Footprint

            25.3.11.5. Strategy Overview

        25.3.12. Lagafors AB

            25.3.12.1. Overview

            25.3.12.2. Material Portfolio

            25.3.12.3. Profitability by Market Segments (Material/Channel/Region)

            25.3.12.4. Sales Footprint

            25.3.12.5. Strategy Overview

        25.3.13. FOAMit

            25.3.13.1. Overview

            25.3.13.2. Material Portfolio

            25.3.13.3. Profitability by Market Segments (Material/Channel/Region)

            25.3.13.4. Sales Footprint

            25.3.13.5. Strategy Overview

        25.3.14. Rossari Biotech

            25.3.14.1. Overview

            25.3.14.2. Material Portfolio

            25.3.14.3. Profitability by Market Segments (Material/Channel/Region)

            25.3.14.4. Sales Footprint

            25.3.14.5. Strategy Overview

        25.3.15. Lilleborg AS

            25.3.15.1. Overview

            25.3.15.2. Material Portfolio

            25.3.15.3. Profitability by Market Segments (Material/Channel/Region)

            25.3.15.4. Sales Footprint

            25.3.15.5. Strategy Overview

        25.3.16. Stepan Company

            25.3.16.1. Overview

            25.3.16.2. Material Portfolio

            25.3.16.3. Profitability by Market Segments (Material/Channel/Region)

            25.3.16.4. Sales Footprint

            25.3.16.5. Strategy Overview

        25.3.17. Nerta (Entaco N.V.)

            25.3.17.1. Overview

            25.3.17.2. Material Portfolio

            25.3.17.3. Profitability by Market Segments (Material/Channel/Region)

            25.3.17.4. Sales Footprint

            25.3.17.5. Strategy Overview

        25.3.18. Foamico

            25.3.18.1. Overview

            25.3.18.2. Material Portfolio

            25.3.18.3. Profitability by Market Segments (Material/Channel/Region)

            25.3.18.4. Sales Footprint

            25.3.18.5. Strategy Overview

        25.3.19. Jürgen Löhrke GmbH

            25.3.19.1. Overview

            25.3.19.2. Material Portfolio

            25.3.19.3. Profitability by Market Segments (Material/Channel/Region)

            25.3.19.4. Sales Footprint

            25.3.19.5. Strategy Overview

        25.3.20. Dosanova BV

            25.3.20.1. Overview

            25.3.20.2. Material Portfolio

            25.3.20.3. Profitability by Market Segments (Material/Channel/Region)

            25.3.20.4. Sales Footprint

            25.3.20.5. Strategy Overview

        25.3.21. PROQUIMIA S.A.

            25.3.21.1. Overview

            25.3.21.2. Material Portfolio

            25.3.21.3. Profitability by Market Segments (Material/Channel/Region)

            25.3.21.4. Sales Footprint

            25.3.21.5. Strategy Overview

        25.3.22. Novadan

            25.3.22.1. Overview

            25.3.22.2. Material Portfolio

            25.3.22.3. Profitability by Market Segments (Material/Channel/Region)

            25.3.22.4. Sales Footprint

            25.3.22.5. Strategy Overview

        25.3.23. Calvatis GmbH

            25.3.23.1. Overview

            25.3.23.2. Material Portfolio

            25.3.23.3. Profitability by Market Segments (Material/Channel/Region)

            25.3.23.4. Sales Footprint

            25.3.23.5. Strategy Overview

        25.3.24. Kiilto

            25.3.24.1. Overview

            25.3.24.2. Material Portfolio

            25.3.24.3. Profitability by Market Segments (Material/Channel/Region)

            25.3.24.4. Sales Footprint

            25.3.24.5. Strategy Overview

        25.3.25. IXOM Operations Pte Ltd

            25.3.25.1. Overview

            25.3.25.2. Material Portfolio

            25.3.25.3. Profitability by Market Segments (Material/Channel/Region)

            25.3.25.4. Sales Footprint

            25.3.25.5. Strategy Overview

        25.3.26. Epsilon Chemicals Ltd.

            25.3.26.1. Overview

            25.3.26.2. Material Portfolio

            25.3.26.3. Profitability by Market Segments (Material/Channel/Region)

            25.3.26.4. Sales Footprint

            25.3.26.5. Strategy Overview

26. Primary Survey Analysis

27. Assumptions and Acronyms Used

28. Research Methodology

List of Tables

Table 01: Global Market Size Volume (Tons) Analysis and Forecast by Product Type, 2018 to 2033

Table 02: Global Market Size Volume (Tons) Analysis and Forecast by Product Type, 2018 to 2033

Table 03: Global Market Size (US$ million) Analysis and Forecast by Product Type, 2018 to 2033

Table 04: Global Market Size (US$ million) Analysis and Forecast by Product Type, 2018 to 2033

Table 05: Global Market Size Volume (Tons) Analysis and Forecast by Process, 2018 to 2033

Table 06: Global Market Size (US$ million) Analysis and Forecast by Process, 2018 to 2033

Table 07: Global Market Size Volume (Tons) Analysis and Forecast by Application, 2018 to 2033

Table 08: Global Market Size (US$ million) Analysis and Forecast by Application, 2018 to 2033

Table 09: Global Market Size Volume (Tons) Analysis and Forecast by Region, 2018 to 2033

Table 10: Global Market Size (US$ million) Analysis and Forecast by Region, 2018 to 2033

Table 11: North America Market Size (US$ million) and Volume (Tons) Analysis and Forecast by Country, 2018 to 2033

Table 12: North America Market Size Volume (Tons) Analysis and Forecast by Product Type, 2018 to 2033

Table 13: North America Market Size Volume (Tons) Analysis and Forecast by Product Type, 2018 to 2033

Table 14: North America Market Size (US$ million) Analysis and Forecast by Product Type, 2018 to 2033

Table 15: North America Market Size (US$ million) Analysis and Forecast by Product Type, 2018 to 2033

Table 16: North America Market Size Volume (Tons) Analysis and Forecast by Process, 2018 to 2033

Table 17: North America Market Size (US$ million) Analysis and Forecast by Process, 2018 to 2033

Table 18: North America Market Size Volume (Tons) Analysis and Forecast by Application, 2018 to 2033

Table 19: North America Market Size (US$ million) Analysis and Forecast by Application, 2018 to 2033

Table 20: Latin America Market Size (US$ million) and Volume (Tons) Analysis and Forecast by Country, 2018 to 2033

Table 21: Latin America Market Size Volume (Tons) Analysis and Forecast by Product Type, 2018 to 2033

Table 22: Latin America Market Size Volume (Tons) Analysis and Forecast by Product Type, 2018 to 2033

Table 23: Latin America Market Size (US$ million) Analysis and Forecast by Product Type, 2018 to 2033

Table 24: Latin America Market Size (US$ million) Analysis and Forecast by Product Type, 2018 to 2033

Table 25: Latin America Market Size Volume (Tons) Analysis and Forecast by Process, 2018 to 2033

Table 26: Latin America Market Size (US$ million) Analysis and Forecast by Process, 2018 to 2033

Table 27: Latin America Market Size Volume (Tons) Analysis and Forecast by Application, 2018 to 2033

Table 28: Latin America Market Size (US$ million) Analysis and Forecast by Application, 2018 to 2033

Table 29: Western Europe Market Size (US$ million) and Volume (Tons) Analysis and Forecast by Country, 2018 to 2033

Table 30: Western Europe Market Size Volume (Tons) Analysis and Forecast by Product Type, 2018 to 2033

Table 31: Western Europe Market Size Volume (Tons) Analysis and Forecast by Product Type, 2018 to 2033

Table 32: Western Europe Market Size (US$ million) Analysis and Forecast by Product Type, 2018 to 2033

Table 33: Western Europe Market Size (US$ million) Analysis and Forecast by Product Type, 2018 to 2033

Table 34: Western Europe Market Size Volume (Tons) Analysis and Forecast by Process, 2018 to 2033

Table 35: Western Europe Market Size (US$ million) Analysis and Forecast by Process, 2018 to 2033

Table 36: Western Europe Market Size Volume (Tons) Analysis and Forecast by Application, 2018 to 2033

Table 37: Western Europe Market Size (US$ million) Analysis and Forecast by Application, 2018 to 2033

Table 38: Eastern Europe Market Size (US$ million) and Volume (Units) Analysis and Forecast by Country, 2018 to 2033

Table 39: Eastern Europe Market Size Volume (Tons) Analysis and Forecast by Product Type, 2018 to 2033

Table 40: Eastern Europe Market Size Volume (Tons) Analysis and Forecast by Product Type, 2018 to 2033

Table 41: Eastern Europe Market Size (US$ million) Analysis and Forecast by Product Type, 2018 to 2033

Table 42: Eastern Europe Market Size (US$ million) Analysis and Forecast by Product Type, 2018 to 2033

Table 43: Eastern Europe Market Size Volume (Tons) Analysis and Forecast by Process, 2018 to 2033

Table 44: Eastern Europe Market Size (US$ million) Analysis and Forecast by Process, 2018 to 2033

Table 45: Eastern Europe Market Size Volume (Tons) Analysis and Forecast by Application, 2018 to 2033

Table 46: Eastern Europe Market Size (US$ million) Analysis and Forecast by Application, 2018 to 2033

Table 47: Russia and Belarus Market Size Volume (Tons) Analysis and Forecast by Product Type, 2018 to 2033

Table 48: Russia and Belarus Market Size Volume (Tons) Analysis and Forecast by Product Type, 2018 to 2033

Table 49: Russia and Belarus Market Size (US$ million) Analysis and Forecast by Product Type, 2018 to 2033

Table 50: Russia and Belarus Market Size (US$ million) Analysis and Forecast by Product Type, 2018 to 2033

Table 51: Russia and Belarus Market Size Volume (Tons) Analysis and Forecast by Process, 2018 to 2033

Table 52: Russia and Belarus Market Size (US$ million) Analysis and Forecast by Process, 2018 to 2033

Table 53: Russia and Belarus Market Size Volume (Tons) Analysis and Forecast by Application, 2018 to 2033

Table 54: Russia and Belarus Market Size (US$ million) Analysis and Forecast by Application, 2018 to 2033

Table 55: Balkan and Baltics Market Size Volume (Tons) Analysis and Forecast by Product Type, 2018 to 2033

Table 56: Balkan and Baltics Market Size Volume (Tons) Analysis and Forecast by Product Type, 2018 to 2033

Table 57: Balkan and Baltics Market Size (US$ million) Analysis and Forecast by Product Type, 2018 to 2033

Table 58: Balkan and Baltics Market Size (US$ million) Analysis and Forecast by Product Type, 2018 to 2033

Table 59: Balkan and Baltics Market Size Volume (Tons) Analysis and Forecast by Process, 2018 to 2033

Table 60: Balkan and Baltics Market Size (US$ million) Analysis and Forecast by Process, 2018 to 2033

Table 61: Balkan and Baltics Market Size Volume (Tons) Analysis and Forecast by Application, 2018 to 2033

Table 62: Balkan and Baltics Market Size (US$ million) Analysis and Forecast by Application, 2018 to 2033

Table 63: Central Asia Market Size Volume (Tons) Analysis and Forecast by Product Type, 2018 to 2033

Table 64: Central Asia Market Size Volume (Tons) Analysis and Forecast by Product Type, 2018 to 2033

Table 65: Central Asia Market Size (US$ million) Analysis and Forecast by Product Type, 2018 to 2033

Table 66: Central Asia Market Size (US$ million) Analysis and Forecast by Product Type, 2018 to 2033

Table 67: Central Asia Market Size Volume (Tons) Analysis and Forecast by Process, 2018 to 2033

Table 68: Central Asia Market Size (US$ million) Analysis and Forecast by Process, 2018 to 2033

Table 69: Central Asia Market Size Volume (Tons) Analysis and Forecast by Application, 2018 to 2033

Table 70: Central Asia Market Size (US$ million) Analysis and Forecast by Application, 2018 to 2033

Table 71: South Asia Pacific Market Size (US$ million) and Volume (Tons) Analysis and Forecast by Country, 2018 to 2033

Table 72: South Asia Pacific Market Size Volume (Tons) Analysis and Forecast by Product Type, 2018 to 2033

Table 73: South Asia Pacific Market Size Volume (Tons) Analysis and Forecast by Product Type, 2018 to 2033

Table 74: South Asia Pacific Market Size (US$ million) Analysis and Forecast by Product Type, 2018 to 2033

Table 75: South Asia Pacific Market Size (US$ million) Analysis and Forecast by Product Type, 2018 to 2033

Table 76: South Asia Pacific Market Size Volume (Tons) Analysis and Forecast by Process, 2018 to 2033

Table 77: South Asia Pacific Market Size (US$ million) Analysis and Forecast by Process, 2018 to 2033

Table 78: South Asia Pacific Market Size Volume (Tons) Analysis and Forecast by Application, 2018 to 2033

Table 79: South Asia Pacific Market Size (US$ million) Analysis and Forecast by Application, 2018 to 2033

Table 80: East Asia Market Size (US$ million) and Volume (Tons) Analysis and Forecast by Country, 2018 to 2033

Table 81: East Asia Market Size (US$ million) and Volume (Tons) Analysis and Forecast by Country, 2018 to 2033

Table 82: East Asia Market Size Volume (Tons) Analysis and Forecast by Product Type, 2018 to 2033

Table 83: East Asia Market Size Volume (Tons) Analysis and Forecast by Product Type, 2018 to 2033

Table 84: East Asia Market Size (US$ million) Analysis and Forecast by Product Type, 2018 to 2033

Table 85: East Asia Market Size (US$ million) Analysis and Forecast by Product Type, 2018 to 2033

Table 86: East Asia Market Size Volume (Tons) Analysis and Forecast by Process, 2018 to 2033

Table 87: East Asia Market Size (US$ million) Analysis and Forecast by Process, 2018 to 2033

Table 88: East Asia Market Size Volume (Tons) Analysis and Forecast by Application, 2018 to 2033

Table 89: East Asia Market Size (US$ million) Analysis and Forecast by Application, 2018 to 2033

Table 90: Middle East and Africa Market Size (US$ million) and Volume (Tons) Analysis and Forecast by Country, 2018 to 2033

Table 91: Middle East and Africa Market Size (US$ million) and Volume (Tons) Analysis and Forecast by Country, 2018 to 2033

Table 92: Middle East and Africa Market Size Volume (Tons) Analysis and Forecast by Product Type, 2018 to 2033

Table 93: Middle East and Africa Market Size Volume (Tons) Analysis and Forecast by Product Type, 2018 to 2033

Table 94: Middle East and Africa Market Size (US$ million) Analysis and Forecast by Product Type, 2018 to 2033

Table 95: Middle East and Africa Market Size (US$ million) Analysis and Forecast by Product Type, 2018 to 2033

Table 96: Middle East and Africa Market Size Volume (Tons) Analysis and Forecast by Process, 2018 to 2033

Table 97: Middle East and Africa Market Size (US$ million) Analysis and Forecast by Process, 2018 to 2033

Table 98: Middle East and Africa Market Size Volume (Tons) Analysis and Forecast by Application, 2018 to 2033

Table 99: Middle East and Africa Market Size (US$ million) Analysis and Forecast by Application, 2018 to 2033

List of Charts

Figure 01: Global Market Historical Volume (Tons), 2018 to 2022

Figure 02: Global Market Current and Forecast Volume), 2023 to 2033

Figure 03: Global Market Historical Value (US$ million), 2018 to 2022

Figure 04: Global Market Current and Forecast Value (US$ million), 2023 to 2033

Figure 05: Global Market Incremental $ Opportunity (US$ million), 2023 to 2033

Figure 06: Global Market Share and BPS Analysis by Product Type, 2023 and 2033

Figure 07: Global Market Y-o-Y Growth Projections by Product Type, 2023 to 2033

Figure 08: Global Market Attractiveness Analysis by Product Type, 2023 to 2033

Figure 09: Global Market Absolute $ Opportunity by Oxidizing Disinfectants Segment, 2018 to 2033

Figure 10: Global Market Absolute $ Opportunity by Non-Oxidizing Disinfectants Segment, 2018 to 2033

Figure 11: Global Market Absolute $ Opportunity by Alcohols and Cleaning Chemicals Segment, 2018 to 2033

Figure 12: Global Market Share and BPS Analysis by Process, 2023 and 2033

Figure 13: Global Market Y-o-Y Growth Projections by Process, 2023 to 2033

Figure 14: Global Market Attractiveness Analysis by Process, 2023 to 2033

Figure 15: Global Market Absolute $ Opportunity by Coagulation Segment, 2018 to 2033

Figure 16: Global Market Absolute $ Opportunity by Steam Sterilization Segment, 2018 to 2033

Figure 17: Global Market Absolute $ Opportunity by Pasteurization Segment, 2018 to 2033

Figure 18: Global Market Absolute $ Opportunity by Carbonation Segment, 2018 to 2033

Figure 19: Global Market Absolute $ Opportunity by Chlorination Segment, 2018 to 2033

Figure 20: Global Market Absolute $ Opportunity by UV Technology Segment, 2018 to 2033

Figure 21: Global Market Absolute $ Opportunity by Ozonation Segment, 2018 to 2033

Figure 22: Global Market Absolute $ Opportunity by Others Segment, 2018 to 2033

Figure 23: Global Market Share and BPS Analysis by Application, 2023 and 2033

Figure 24: Global Market Y-o-Y Growth Projections by Application, 2023 to 2033

Figure 25: Global Market Attractiveness Analysis by Application, 2023 to 2033

Figure 26: Global Market Absolute $ Opportunity by Food Industry Segment, 2018 to 2033

Figure 27: Global Market Absolute $ Opportunity by Beverage Industry Segment, 2018 to 2033

Figure 28: Global Market Share and BPS Analysis by Region, 2023 and 2033

Figure 29: Global Market Y-o-Y Growth Projections by Region, 2023 to 2033

Figure 30: Global Market Attractiveness Analysis by Region, 2023 to 2033

Figure 31: Global Market Absolute $ Opportunity by North America Segment, 2018 to 2033

Figure 32: Global Market Absolute $ Opportunity by Latin America Segment, 2018 to 2033

Figure 33: Global Market Absolute $ Opportunity by Western Europe Segment, 2018 to 2033

Figure 34: Global Market Absolute $ Opportunity by Eastern Europe Segment, 2018 to 2033

Figure 35: Global Market Absolute $ Opportunity by Russia and Belarus Segment, 2018 to 2033

Figure 36: Global Market Absolute $ Opportunity by Balkan and Baltic Segment, 2018 to 2033

Figure 37: Global Market Absolute $ Opportunity by Central Asia Segment, 2018 to 2033

Figure 38: Global Market Absolute $ Opportunity by South Asia Pacific Segment, 2018 to 2033

Figure 39: Global Market Absolute $ Opportunity by East Asia Segment, 2018 to 2033

Figure 40: Global Market Absolute $ Opportunity by Middle East and Africa Segment, 2018 to 2033

Figure 41: North America Market Share and BPS Analysis by Country, 2023 and 2033

Figure 42: North America Market Y-o-Y Growth Projections by Country, 2023 to 2033

Figure 43: North America Market Attractiveness Analysis by Country, 2023 to 2033

Figure 44: North America Market Share and BPS Analysis by Product Type, 2023 and 2033

Figure 45: North America Market Y-o-Y Growth Projections by Product Type, 2023 to 2033

Figure 46: North America Market Attractiveness Analysis by Product Type, 2023 to 2033

Figure 47: North America Market Share and BPS Analysis by Process, 2023 and 2033

Figure 48: North America Market Y-o-Y Growth Projections by Process, 2023 to 2033

Figure 49: North America Market Attractiveness Analysis by Process, 2023 to 2033

Figure 50: North America Market Share and BPS Analysis by Application, 2023 and 2033

Figure 51: North America Market Y-o-Y Growth Projections by Application, 2023 to 2033

Figure 52: North America Market Attractiveness Analysis by Application, 2023 to 2033

Figure 53: Latin America Market Share and BPS Analysis by Country, 2023 and 2033

Figure 54: Latin America Market Y-o-Y Growth Projections by Country, 2023 to 2033

Figure 55: Latin America Market Attractiveness Analysis by Country, 2023 to 2033

Figure 56: Latin America Market Share and BPS Analysis by Product Type, 2023 and 2033

Figure 57: Latin America Market Y-o-Y Growth Projections by Product Type, 2023 to 2033

Figure 58: Latin America Market Attractiveness Analysis by Product Type, 2023 to 2033

Figure 59: Latin America Market Share and BPS Analysis by Process, 2023 and 2033

Figure 60: Latin America Market Y-o-Y Growth Projections by Process, 2023 to 2033

Figure 61: Latin America Market Attractiveness Analysis by Process, 2023 to 2033

Figure 62: Latin America Market Share and BPS Analysis by Application, 2023 and 2033

Figure 63: Latin America Market Y-o-Y Growth Projections by Application, 2023 to 2033

Figure 64: Latin America Market Attractiveness Analysis by Application, 2023 to 2033

Figure 65: Western Europe Market Share and BPS Analysis by Country, 2023 and 2033

Figure 66: Western Europe Market Y-o-Y Growth Projections by Country, 2023 to 2033

Figure 67: Western Europe Market Attractiveness Analysis by Country, 2023 to 2033

Figure 68: Western Europe Market Share and BPS Analysis by Product Type, 2023 and 2033

Figure 69: Western Europe Market Y-o-Y Growth Projections by Product Type, 2023 to 2033

Figure 70: Western Europe Market Attractiveness Analysis by Product Type, 2023 to 2033

Figure 71: Western Europe Market Share and BPS Analysis by Process, 2023 and 2033

Figure 72: Western Europe Market Y-o-Y Growth Projections by Process, 2023 to 2033

Figure 73: Western Europe Market Attractiveness Analysis by Process, 2023 to 2033

Figure 74: Western Europe Market Share and BPS Analysis by Application, 2023 and 2033

Figure 75: Western Europe Market Y-o-Y Growth Projections by Application, 2023 to 2033

Figure 76: Western Europe Market Attractiveness Analysis by Application, 2023 to 2033

Figure 77: Eastern Europe Market Share and BPS Analysis by Country, 2023 and 2033

Figure 78: Eastern Europe Market Y-o-Y Growth Projections by Country, 2023 to 2033

Figure 79: Eastern Europe Market Attractiveness Analysis by Country, 2023 to 2033

Figure 80: Eastern Europe Market Share and BPS Analysis by Product Type, 2023 and 2033

Figure 81: Eastern Europe Market Y-o-Y Growth Projections by Product Type, 2023 to 2033

Figure 82: Eastern Europe Market Attractiveness Analysis by Product Type, 2023 to 2033

Figure 83: Eastern Europe Market Share and BPS Analysis by Process, 2023 and 2033

Figure 84: Eastern Europe Market Y-o-Y Growth Projections by Process, 2023 to 2033

Figure 85: Eastern Europe Market Attractiveness Analysis by Process, 2023 to 2033

Figure 86: Eastern Europe Market Share and BPS Analysis by Application, 2023 and 2033

Figure 87: Eastern Europe Market Y-o-Y Growth Projections by Application, 2023 to 2033

Figure 88: Eastern Europe Market Attractiveness Analysis by Application, 2023 to 2033

Figure 89: Russia and Belarus Market Share and BPS Analysis by Product Type, 2023 and 2033

Figure 90: Russia and Belarus Market Y-o-Y Growth Projections by Product Type, 2023 to 2033

Figure 91: Russia and Belarus Market Attractiveness Analysis by Product Type, 2023 to 2033

Figure 92: Russia and Belarus Market Share and BPS Analysis by Process, 2023 and 2033

Figure 93: Russia and Belarus Market Y-o-Y Growth Projections by Process, 2023 to 2033

Figure 94: Russia and Belarus Market Attractiveness Analysis by Process, 2023 to 2033

Figure 95: Russia and Belarus Market Share and BPS Analysis by Application, 2023 and 2033

Figure 96: Russia and Belarus Market Y-o-Y Growth Projections by Application, 2023 to 2033

Figure 97: Russia and Belarus Market Attractiveness Analysis by Application, 2023 to 2033

Figure 98: Balkan and Baltics Market Share and BPS Analysis by Product Type, 2023 and 2033

Figure 99: Balkan and Baltics Market Y-o-Y Growth Projections by Product Type, 2023 to 2033

Figure 100: Balkan and Baltics Market Attractiveness Analysis by Product Type, 2023 to 2033

Figure 101: Balkan and Baltics Market Share and BPS Analysis by Process, 2023 and 2033

Figure 102: Balkan and Baltics Market Y-o-Y Growth Projections by Process, 2023 to 2033

Figure 103: Balkan and Baltics Market Attractiveness Analysis by Process, 2023 to 2033

Figure 104: Balkan and Baltics Market Share and BPS Analysis by Application, 2023 and 2033

Figure 105: Balkan and Baltics Market Y-o-Y Growth Projections by Application, 2023 to 2033

Figure 106: Balkan and Baltics Market Attractiveness Analysis by Application, 2023 to 2033

Figure 107: Central Asia Market Share and BPS Analysis by Product Type, 2023 and 2033

Figure 108: Central Asia Market Y-o-Y Growth Projections by Product Type, 2023 to 2033

Figure 109: Central Asia Market Attractiveness Analysis by Product Type, 2023 to 2033

Figure 110: Central Asia Market Share and BPS Analysis by Process, 2023 and 2033

Figure 111: Central Asia Market Y-o-Y Growth Projections by Process, 2023 to 2033

Figure 112: Central Asia Market Attractiveness Analysis by Process, 2023 to 2033

Figure 113: Central Asia Market Share and BPS Analysis by Application, 2023 and 2033

Figure 114: Central Asia Market Y-o-Y Growth Projections by Application, 2023 to 2033

Figure 115: Central Asia Market Attractiveness Analysis by Application, 2023 to 2033

Figure 116: South Asia Pacific Market Share and BPS Analysis by Country, 2023 and 2033

Figure 117: South Asia Pacific Market Y-o-Y Growth Projections by Country, 2023 to 2033

Figure 118: South Asia Pacific Market Attractiveness Analysis by Country, 2023 to 2033

Figure 119: South Asia Pacific Market Share and BPS Analysis by Product Type, 2023 and 2033

Figure 120: South Asia Pacific Market Y-o-Y Growth Projections by Product Type, 2023 to 2033

Figure 121: South Asia Pacific Market Attractiveness Analysis by Product Type, 2023 to 2033

Figure 122: South Asia Pacific Market Share and BPS Analysis by Process, 2023 and 2033

Figure 123: South Asia Pacific Market Y-o-Y Growth Projections by Process, 2023 to 2033

Figure 124: South Asia Pacific Market Attractiveness Analysis by Process, 2023 to 2033

Figure 125: South Asia Pacific Market Share and BPS Analysis by Application, 2023 and 2033

Figure 126: South Asia Pacific Market Y-o-Y Growth Projections by Application, 2023 to 2033

Figure 127: South Asia Pacific Market Attractiveness Analysis by Application, 2023 to 2033

Figure 128: East Asia Market Share and BPS Analysis by Country, 2023 and 2033

Figure 129: East Asia Market Y-o-Y Growth Projections by Country, 2023 to 2033

Figure 130: East Asia Market Attractiveness Analysis by Country, 2023 to 2033

Figure 131: East Asia Market Share and BPS Analysis by Country, 2023 and 2033

Figure 132: East Asia Market Y-o-Y Growth Projections by Country, 2023 to 2033

Figure 133: East Asia Market Attractiveness Analysis by Country, 2023 to 2033

Figure 134: East Asia Market Share and BPS Analysis by Product Type, 2023 and 2033

Figure 135: East Asia Market Y-o-Y Growth Projections by Product Type, 2023 to 2033

Figure 136: East Asia Market Attractiveness Analysis by Product Type, 2023 to 2033

Figure 137: East Asia Market Share and BPS Analysis by Process, 2023 and 2033

Figure 138: East Asia Market Y-o-Y Growth Projections by Process, 2023 to 2033

Figure 139: East Asia Market Attractiveness Analysis by Process, 2023 to 2033

Figure 140: East Asia Market Share and BPS Analysis by Application, 2023 and 2033

Figure 141: East Asia Market Y-o-Y Growth Projections by Application, 2023 to 2033

Figure 142: East Asia Market Attractiveness Analysis by Application, 2023 to 2033

Figure 143: Middle East and Africa Market Share and BPS Analysis by Country, 2023 and 2033

Figure 144: Middle East and Africa Market Y-o-Y Growth Projections by Country, 2023 to 2033

Figure 145: Middle East and Africa Market Attractiveness Analysis by Country, 2023 to 2033

Figure 146: Middle East and Africa Market Share and BPS Analysis by Country, 2023 and 2033

Figure 147: Middle East and Africa Market Y-o-Y Growth Projections by Country, 2023 to 2033

Figure 148: Middle East and Africa Market Attractiveness Analysis by Country, 2023 to 2033

Figure 149: Middle East and Africa Market Share and BPS Analysis by Product Type, 2023 and 2033

Figure 150: Middle East and Africa Market Y-o-Y Growth Projections by Product Type, 2023 to 2033

Figure 151: Middle East and Africa Market Attractiveness Analysis by Product Type, 2023 to 2033

Figure 152: Middle East and Africa Market Share and BPS Analysis by Process, 2023 and 2033

Figure 153: Middle East and Africa Market Y-o-Y Growth Projections by Process, 2023 to 2033

Figure 154: Middle East and Africa Market Attractiveness Analysis by Process, 2023 to 2033

Figure 155: Middle East and Africa Market Share and BPS Analysis by Application, 2023 and 2033

Figure 156: Middle East and Africa Market Y-o-Y Growth Projections by Application, 2023 to 2033

Figure 157: Middle East and Africa Market Attractiveness Analysis by Application, 2023 to 2033

Recommendations

Chemicals & Materials

Electronic Grade Hydrofluoric Acid Market

Published : April 2023

Chemicals & Materials

Gum Turpentine Oil Market

Published : March 2023

Chemicals & Materials

FKM Elastomers Market

Published : March 2023

Chemicals & Materials

2K Coatings Market

Published : March 2023

Explore Chemicals & Materials Insights

View Reports

Food & Beverage Industrial Disinfection and Cleaning Market