Reports

- Global Locations -

Headquarters

Future Market Insights, Inc.

Christiana Corporate, 200
Continental Drive, Suite 401,
Newark, Delaware - 19713,
United States

T: +1-845-579-5705

Americas

Future Market Insights, Inc.

616 Corporate Way, Suite 2-9018,
Valley Cottage, NY 10989, United States

T: +1-347-918-3531

MEA

Future Market Insights

1602-6 Jumeirah Bay X2 Tower, Plot No: JLT-PH2-X2A,
Jumeirah Lakes Towers, Dubai,
United Arab Emirates

Europe

Future Market Insights

3rd Floor, 207 Regent Street,
W1B 3HH London
United Kingdom

T: + 44 (0) 20 8123 9659
D: +44 (0) 20 3287 4268

Asia Pacific

Future Market Insights

IndiaLand Global Tech Park, Unit UG-1, Behind Grand HighStreet, Phase 1, Hinjawadi, MH, Pune – 411057, India

Food Stabilizers Market Outlook (2022-2032)

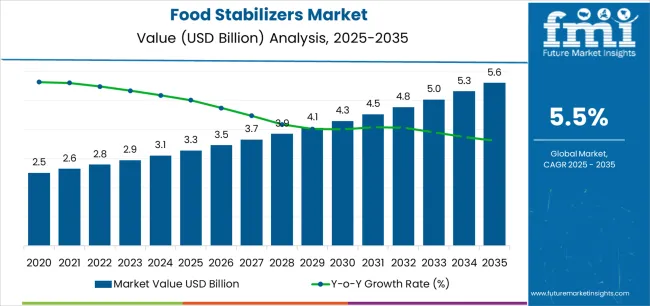
[350 Pages Report] The food stabilizers market is valued at US$ 2.8 billion in 2022 and is expected to grow at a CAGR of 5.5% during the forecast period, reaching a valuation of US$ 4.7 billion by 2032.

  • The rising use of food stabilizers for preventing oil and water emulsions from separating in products, eradicating ice crystal formation in frozen foods, and attempting to prevent fruit from settling in products is expected to boost food stabiliser sales.
  • The increasing production and consumption of packaged food products, as well as the growing demand for preserving foods for longer periods of time, are driving growth in the food stabilizers market.
  • A rise in food stabiliser production and consumption will eventually boost food stabiliser sales, expanding the food stabilizers market size.
  • The versatility of food stabilizers in various food and beverage products is propelling the market growth.
Attributes Key Statistics
Food Stabilizers Market Size in 2022 US$ 2.8 Billion
Projected Market Size in 2032 US$ 4.7 Billion
Anticipated Growth Rate (2022 to 2032) 5.5% CAGR
Collective Value Share: Top 3 Countries (2021A) 38.7%

Don't pay for what you don't need

Customize your report by selecting specific countries or regions and save 30%!

A Significant Area of Opportunity is the Demand for Food Stabilizers for Innovative Applications

Food market demand is being driven by rising population and economic development. The world's ever-increasing population puts a strain on the availability of scarce resources. Rising raw material costs and high energy prices impact food prices, affecting low-income consumers.

The growing market for food products is expected to provide the market with potential growth opportunities. Consumers in developing economies have changed lifestyles and more disposable income, fueling the market for processed food products. Food additives and ingredients are required to produce processed goods, fueling the food additives and food ingredient markets.Food Stabilizers Market

United States is a Major Market for Food Stabilizers

"Cost-cutting with precise functionality sparks food stabilizer sales in the United States."

The growing trend of combining food stabiliser ingredients with raw food materials to create precise customized customized food products has been driving sales in the United States. It is expected to continue during the forecast period. Key brands in the country are customising different stabiliser agents based on consumer preferences.

While the company's product Hamulsion serves as a protective colloid and is used in beverages, cakes, jellies, fillings, puddings, marmalades, ice cream, sauces, soups, low-calorie, and dietetic foods, the company's product Hamultop serves as a food stabiliser for clean label products and is used in acidified milk products.

Nandini Roy Choudhury

Principal Consultant

Talk to Analyst

Find your sweet spots for generating winning opportunities in this market.

Growth in the Food Stabilizers Market in the United Kingdom

"Continuous technological advances fuel the food stabilizers sales in the United Kingdom."

The food stabilizers market in the United Kingdom is expected to grow rapidly due to rapid technological advancement, increased production and consumption of packaged food products, rising consumer awareness, and a large presence of food stabiliser manufacturers.

With the help of modern technologies, leading food stabilizers brands in the United Kingdom are producing tailored, functional food stabilizers blends known as texturants, fully integrated food stabilizers systems or emulsifiers.

The company's innovative spray crystallised portfolio includes a non-hydrogenated, super-efficient comprehensive range of certified spray crystallised roux mixes, fat powders, and stable free-flowing chocolate powders.

National Stabilizers Inc., Tate & Lyle Plc, and Palsgaard are at the Forefront of the Food Stabilizers Market

National Stabilizers Inc., founded in 1975 by George Ryback and Richard McKiernan, has become one of the most trusted food stabiliser companies, providing proprietary high-quality food stabiliser solutions. The company offers custom contract blending, gums and hydrocolloids such as agar-powdered, gelatins, pectin (high and low methoxyl), and so on.

Tate & Lyle is morphing the food stabilizers market by offering a variety of food stabilizers that would keep every mouthful delicious for weeks. Tate & Lyle is constantly increasing its investment in R&D, innovation, and solution development to expand its customer base.

Palsgaard is another company that is taking the food stabilizers industry by storm. It is the world's only full-service emulsifier and stabiliser company, producing food ingredients with specialised performance that are produced sustainably. It produces emulsifiers and stabilizers for bakery, dairy, ice cream, confectionery, and other food products.

Food stabilizer, an external agent which is added to food products, assists in enhancing the products chemical and physical characteristics, and improves product texture. Available in plenty, food stabilizers can be found naturally (agar agar, carrageenan, pectin, and others) or made synthetically (phosphates, diphosphates, pyrophosphates, and others). They preserve the structure of foods and make them more appetizing to consumers.

Rising usage of food stabilizers for preventing oil, water emulsions from separating in products such as salad dressings, eliminating the ice crystal formation in frozen foods, and preventing fruit from settling in products like jams and yoghurt, is likely to bolster food stabilizers sales during the assessment period.

Get the data you need at a Fraction of the cost

Personalize your report by choosing insights you need
and save 40%!

2017-2021 Food Stabilizers Market Outlook Compared to 2022-2032 Forecast

The global food stabilizers demand is slated to grow at 5.5% CAGR between 2022 and 2032, in comparison to 4.6% CAGR registered between 2017 and 2021. Increasing production and consumption of packaged food products and growing demand for preserving foods for longer durations are driving growth in the food stabilizers market.

Food product manufacturers rely on food stabilizers to ensure that the end products can maintain the highest possible quality in transit to the customers. As the shelf life of food products gets extended while using food stabilizers, the product has been in demand among food products manufacturers as well as consumers who want to preserve food at home.

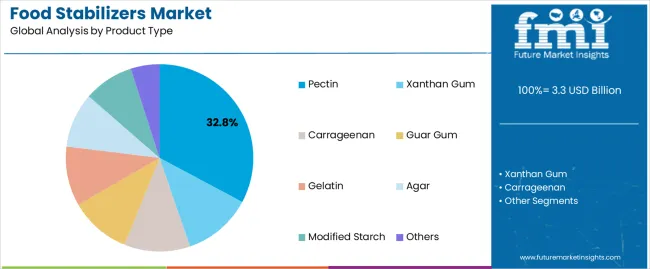
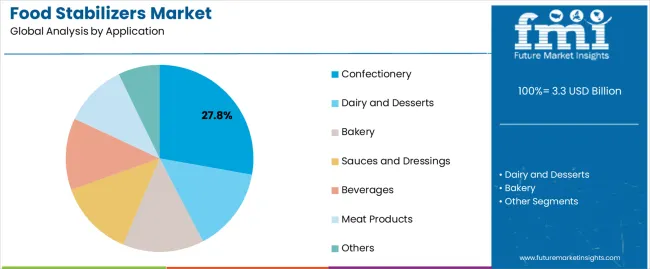
Within food stabilizers market, pectin, plant source, stability as function, dairy and desserts as application, and B2C sales channel segments are projected to reflect favorable growth outlook in terms of revenue, according to the annual market analysis conducted by Future Market Insights.

What are the Key Trends Driving the Global Food Stabilizers Market?

“Rising Consumption of Packaged Food Products to Ignite Food Stabilizer Sales”

With rapidly growing population and increasing disposable income, there has been a robust surge in the production and consumption of packaged food products. Consumer across the world spend large amounts on processed and packaged food products.

In order to improve the quality of these packaged food products as well as to increase their shelf life, manufacturers are increasingly using additives like food stabilizers and emulsifiers.

Thus, rise in production and consumption of food stabilizers will eventually boost food stabilizer sales, which in turn will expand the food stabilizers market size during the forecast period.

Country-wise Insights

What Makes the U.S. One of the Most Prominent Food Stabilizers Market?

“Cost Reduction with Precise Functionality Igniting Food Stabilizers Sales in the U.S.”

Over the years, growing trend of combining food stabilizer ingredients with raw food materials to develop precise functionality customized food products has been propelling food stabilizers sales in the U.S. and the trend is likely to continue during the forecast period. Key brands operating in the country, like Tate & Lyle, are customizing different stabilizer agents according to consumer requirements.

While the product Hamulsion by the company acts as a protective colloid and is used in drinks, cakes, jellies, fillings, puddings, marmalades, ice-cream, sauces, soups, low-calorie, and dietetic foods; the product Hamultop acts as a food stabilizer for clean label products and is used in acidified milk products like yoghurt or quarg, in dips and dressings, dessert, milk drinks, or meat products.

Why is Demand for Food Stabilizers Rising in Germany?

“Growing Popularity of Sustainable Food Stabilizers Augmenting Growth in Germany Market”

High quality and sustainable food stabilizers are growing in demand among German consumers, where natural and specially selected raw materials are only allowed for food stabilizers production.

Brands like Condio GmbH uses wide range of natural and sustainable ingredients, such as agar agar, carrageen, pectin, guar gum, emulsifiers, modified starches, locust bean gum, vegetable fibers, celluloses, xanthan gum, soy proteins, gelatin, tara gum, and alginates to produce and develop sustainable food stabilizers.

How Will Growth Unfold in the U.K. Food Stabilizers Market?

“Continuous Technological Advancements Spurring Food Stabilizers Sales in the U.K.”

As per FMI, food stabilizers market in the U.K. is poised to exhibit strong growth during the forecast period, owing to the rapid advancement in technology, increasing production and consumption of packaged food products, rising consumer awareness, and large presence of food stabilizer manufacturers.

Leading food stabilizers brands in the U.K., such as Arthur Branwell & Company, are producing tailored and functional food stabilizers blends, named as texturants, which are fully integrated food stabilizers systems or emulsifiers, with the help of modern technologies like cryogenic spray crystallisation technology.

This groundbreaking spray crystallised portfolio of the company include a non-hydrogenated and super-efficient comprehensive range of certified spray crystallised roux mixes, fat powders, and stable free flowing chocolate powders.

Category-wise Insights

Which is the Top Selling Product Type in Food Stabilizers Market?

“Pectin to Remain the Top Selling Food Stabilizer in the Market”

Based on product type, the pectin segment is likely to hold the largest revenue share of the global food stabilizers market through 2032. This can be attributed to the rising usage of pectin in a wide range of food products, such as dessert fillings, sweets, fruit juices, milk drinks, etc.

Similarly growing awareness about the health benefits of pectin including lowering blood pressure, maintainimg blood cholesterol and relieving constipation, is prompting food manufacturers to use it as a food stabilizer.

Demand for phosphates as food stabilizers is also anticipated to rise at a healthy pace during the forecast period. Phosphates play a crucial role in providing stabilization or emulsification function in finely ground poultry, meat, and seafood products like frankfurters, bologna, nuggets, mettwurst, and others.

Which is the Most Lucrative Application of Food Stabilizers?

“Food Stabilizer Sales to Remain High in Dairy and Dessert Application”

In recent years, burgeoning demand from dairy industry has propelled food stabilizers production, thereby allowing leading manufacturers to increase their revenue share. This trend is likely to follow even during the forecast period, making dairy and dessert application the most profitable one.

Milk pasteurisation needs certain food stabilizers like phosphates to ensure that casein protein maintains its quality. Thus, they improve the shelf life and quality of the dairy products.

Furthermore, as milk naturally consists of gelatin, food stabilizers can easily mix with the milk and produce a gelling effect without any heat treatment, which may give instant pudding formulas.

Competitive Landscape

Key food stabilizers manufacturers are looking for capturing the market with joint ventures, partnerships, mergers, and acquisitions, while keeping up with research for innovative product lines, supported by governments. Top food stabilizers brands are also focusing on upgraded and modified product to meet the rising demand for new formulation from food and beverage industry.

For instance,

  • In April 2021, Tate & Lyle, the leading food and beverage solutions provider of ingredients, announced the launch of Stabiliser University™, which is consisted of online and new modular course to design formulations and to support food scientists and formulators to solve stabiliser formulation challenges with ease.
  • In March 2020, Arthur Branwell and Co. announced the launch of a range of clean label alternatives in emulsifier category, named as EmuLux, which comes with Cryo-crystallisation technology. The technology incorporates lipid based product atomisation into a cryogenic atmosphere to generate rapid cooling, as a result of which, crystallisation transform it into a free flowing powder form.

National Stabilizers Inc., Tate & Lyle Plc, and Palsgaard, Leading at the Forefront in Food Stabilizers Space

Leading food stabilizer manufacturers like Tate & Lyle Plc, National Stabilizers Inc., and Plasgaard are using various tactics. Since its establishment in 1975 by George Ryback and Richard McKiernan, National Stabilizers Inc. has become one of the most trusted food stabilizer companies that provide proprietary high quality food stabilizer solutions.

The company offers a line of stabilizers and emulsification systems designed to improve tastes, texture, and mouth feel of products for the dairy and bakery industries. Furthermore, it provides custom contract blending as well as gums and hydrocolloids like agar-powdered, gelatins, pectin (high and low methoxyl), etc.

Similarly, Tate & Lyle is transforming the food stabilizers market by offering various food stabilizers to keep every mouthful delicious for weeks. It has become a leading food ingredient provider that is constantly striving to help people across the globe to make healthier and tastier food and drinks.

Tate & Lyle is continuously stepping up their investment in R&D, innovation and solutions development to improve their customer base. In June 2022, the company’s chief executive, Nick Hampton said that “New Tate & Lyle delivered double digit organic revenue growth across all regions and double-digit profit growth despite significant inflation across supply chain”.

In May 2022, the company opened a new customer innovation and collaboration centre in Chile as a part of their growth strategy in Latin America. The new centre will enable Tate & Lyle’s food scientists to work with customers in the region to address growing demand for various food ingredients.

Another company that is taking the food stabilizers industry by storm is Palsgaard. It is the world’s only full-service emulsifier and stabiliser company, creating sustainably produced food ingredients with specialized performance. It specializes in manufacturing emulsifiers and stabilizers for bakery, dairy, ice cream, confectionery and other food products.

Scope of Report

Attribute Details
Market Size in 2022 US$ 2.8 Billion
Market Forecast Value in 2032 US$ 4.7 Billion
Global Growth Rate ~ 5.5% CAGR
Forecast Period 2022-2032
Historical Data Available for 2017-2021
Market Analysis MT for Volume and USD Billion for Value
Key Regions Covered North America, Latin America, Europe, East Asia, South Asia, Oceania and MEA
Key Countries Covered United States, Canada, Brazil, Mexico, Argentina, Chile, Peru, Germany, France, Italy, Spain, UK, Netherlands, Belgium, Nordic, Russia, Poland, China, Japan, South Korea, India, Thailand, Malaysia, Indonesia, Singapore, Australia, New Zealand, GCC Countries, South Africa, Central Africa, and others
Key Market Segments Covered Product Type, Source, Function, Application, Sales Channel, and Regions
Key Companies Profiled
  • National Stabilizers Inc.
  • Tate & Lyle Plc
  • Ingredion Incorporation
  • Palsgaard
  • Holton Food Products
  • Kilo Ltd
  • Profile Food Ingredients
  • FBC Industries Inc.
  • Arthur Branwell and Co. Ltd
  • Vantage Specialty Chemicals™
  • Crest Foods Co., Inc.
  • TER (UK) LTD.
  • CONDIO GmbH
  • Others
Report Coverage Revenue Forecast, Volume Forecast, Company Ranking, Competitive Landscape, Growth Factors, Trends and Pricing Analysis

Food Stabilizers Market by Category

By Product Type:

  • Pectin
  • Agar
  • Gelatin
  • Xanthan Gum
  • Carrageenan
  • Guar Gum
  • Others

By Source:

  • Seaweed
  • Plant
  • Microbial
  • Synthetic
  • Animal
  • Others

By Function:

  • Stability
  • Moisture Retention
  • Texture
  • Others

By Application:

  • Bakery Products
  • Dairy and Desserts
  • Confectionery Items
  • Sauces and Dressings
  • Meat and Poultry Products
  • Convenience Foods
  • Beverages
  • Others

By Sales Channel:

  • B2B / HoReCa
  • B2C
    • Hypermarkets /Supermarkets
    • Convenience Stores
    • Mom and Pop Stores
    • Discount Stores
    • Food Specialty Stores
    • Independent Small Groceries
    • Online Retail
    • Others Retail Formats

By Region:

  • North America
  • Latin America
  • Europe
  • East Asia
  • South Asia
  • Oceania
  • Middle East & Africa

Frequently Asked Questions

What is the current size of food stabilizers industry?

The food stabilizers market is estimated to reach nearly US$ 2.8 Bn by 2022.

At what CAGR is the market expected to expand through 2032?

Food stabilizers market revenue is expected to increase at a CAGR of around 5.5% during the period 2022-2032.

How was the performance of food stabilizers over the past half-decade?

Food stabilizers sales increased at a CAGR of around 4.6% over the past half-decade.

What will be the market for food stabilizers worth in 2032?

The global food stabilizers market value will be around US$ 4.7 Bn in 2032.

Who are the key players operating in the market?

National Stabilizers Inc., Tate & Lyle Plc, Ingredion Incorporation, Palsgaard, and Holton Food Products are a few among the top players driving the market growth.

Which are the top countries driving the food stabilizers market demand?

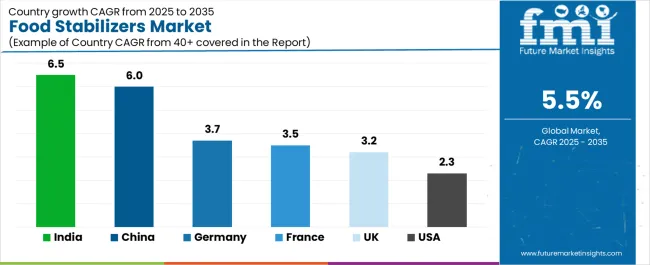
Top countries driving the food stabilizers demand are the US, Japan, UK, Germany, and India.

What are the key factors affecting the food stabilizers market growth?

High product demand from food industry, soaring production of raw material, and increasing production and consumption of convenient packaged food products are some of the factors driving growth of food stabilizers market.

Table of Content

1. Executive Summary

    1.1. Global Market Outlook

    1.2. Demand-side Trends

    1.3. Supply-side Trends

    1.4. Technology Roadmap Analysis

    1.5. Analysis and Recommendations

2. Market Overview

    2.1. Market Coverage / Taxonomy

    2.2. Market Definition / Scope / Limitations

3. Market Background

    3.1. Market Dynamics

        3.1.1. Drivers

        3.1.2. Restraints

        3.1.3. Opportunity

        3.1.4. Trends

    3.2. Scenario Forecast

        3.2.1. Demand in Optimistic Scenario

        3.2.2. Demand in Likely Scenario

        3.2.3. Demand in Conservative Scenario

    3.3. Product launches & Recent Developments

    3.4. Product Life Cycle Analysis

    3.5. Value Chain Analysis

        3.5.1. Supply Side Participants and their Roles

            3.5.1.1. Producers

            3.5.1.2. Mid-Level Participants (Traders/ Agents/ Brokers)

            3.5.1.3. Wholesalers and Distributors

        3.5.2. % of Operating Margin Analysis

        3.5.3. List of Raw Material Suppliers

        3.5.4. List of Existing and Potential Buyer’s

    3.6. Global Market - Pricing Analysis

        3.6.1. Price Point Assessment by Region

        3.6.2. Price Point Assessment by Product Type

        3.6.3. Price Forecast till 2032

        3.6.4. Factors affecting pricing

    3.7. Forecast Factors - Relevance & Impact

    3.8. Regulatory Landscape

        3.8.1. Packaging & Labelling Regulations

        3.8.2. Certifications and Certifying Agency Overview

        3.8.3. Import/Export Policies

    3.9. Regional Parent Market Outlook

    3.10. Macro-Economic Factors

    3.11. Product Claims & Nutritional Information Scan by Buyers

4. Global Market Analysis 2017-2021 and Forecast, 2022-2032

    4.1. Historical Market Size Value (US$ Mn) & Volume (MT) Analysis, 2017-2021

    4.2. Current and Future Market Size Value (US$ Mn) & Volume (MT) Projections, 2022-2032

        4.2.1. Y-o-Y Growth Trend Analysis

        4.2.2. Absolute $ Opportunity Analysis

5. Global Market Analysis 2017-2021 and Forecast 2022-2032, By Product Type

    5.1. Introduction / Key Findings

    5.2. Historical Market Size Value (US$ Mn) & Volume (MT) Analysis By Product Type, 2017-2021

    5.3. Current and Future Market Size Value (US$ Mn) & Volume (MT) Analysis and Forecast By Product Type, 2022-2032

        5.3.1. Pectin

        5.3.2. Agar

        5.3.3. Gelatin

        5.3.4. Xanthan Gum

        5.3.5. Carrageenan

        5.3.6. Guar Gum

        5.3.7. Others

    5.4. Y-o-Y Growth Trend Analysis By Product Type, 2017-2021

    5.5. Absolute $ Opportunity Analysis By Product Type, 2022-2032

6. Global Market Analysis 2017-2021 and Forecast 2022-2032, By Source

    6.1. Introduction / Key Findings

    6.2. Historical Market Size Value (US$ Mn) & Volume (MT) Analysis By Source, 2017-2021

    6.3. Current and Future Market Size Value (US$ Mn) & Volume (MT) Analysis and Forecast By Source, 2022-2032

        6.3.1. Seaweed

        6.3.2. Plant

        6.3.3. Microbial

        6.3.4. Synthetic

        6.3.5. Animal

        6.3.6. Others

    6.4. Y-o-Y Growth Trend Analysis By Source, 2017-2021

    6.5. Absolute $ Opportunity Analysis By Source, 2022-2032

7. Global Market Analysis 2017-2021 and Forecast 2022-2032, By Function

    7.1. Introduction / Key Findings

    7.2. Historical Market Size Value (US$ Mn) & Volume (MT) Analysis By Function, 2017-2021

    7.3. Current and Future Market Size Value (US$ Mn) & Volume (MT) Analysis and Forecast By Function, 2022-2032

        7.3.1. Stability

        7.3.2. Moisture Retention

        7.3.3. Texture

        7.3.4. Others

    7.4. Y-o-Y Growth Trend Analysis By Function, 2017-2021

    7.5. Absolute $ Opportunity Analysis By Function, 2022-2032

8. Global Market Analysis 2017-2021 and Forecast 2022-2032, By Application

    8.1. Introduction / Key Findings

    8.2. Historical Market Size Value (US$ Mn) & Volume (MT) Analysis By Application, 2017-2021

    8.3. Current and Future Market Size Value (US$ Mn) & Volume (MT) Analysis and Forecast By Application, 2022-2032

        8.3.1. Bakery Products

        8.3.2. Dairy and Desserts

        8.3.3. Confectionery Items

        8.3.4. Sauces and Dressings

        8.3.5. Meat and Poultry Products

        8.3.6. Convenience Foods

        8.3.7. Beverages

        8.3.8. Others

    8.4. Y-o-Y Growth Trend Analysis By Application, 2017-2021

    8.5. Absolute $ Opportunity Analysis By Application, 2022-2032

9. Global Market Analysis 2017-2021 and Forecast 2022-2032, By Sales Channel

    9.1. Introduction / Key Findings

    9.2. Historical Market Size Value (US$ Mn) & Volume (MT) Analysis By Sales Channel, 2017-2021

    9.3. Current and Future Market Size Value (US$ Mn) & Volume (MT) Analysis and Forecast By Sales Channel, 2022-2032

        9.3.1. B2B/HoReCa

        9.3.2. B2C

            9.3.2.1. Hypermarkets/Supermarkets

            9.3.2.2. Convenience Stores

            9.3.2.3. Mom and Pop Stores

            9.3.2.4. Discount Stores

            9.3.2.5. Food Specialty Stores

            9.3.2.6. Independent Small Groceries

            9.3.2.7. Online Retail

            9.3.2.8. Other Retail Formats

    9.4. Y-o-Y Growth Trend Analysis By Sales Channel, 2017-2021

    9.5. Absolute $ Opportunity Analysis By Sales Channel, 2022-2032

10. Global Market Analysis 2017-2021 and Forecast 2022-2032, By Region

    10.1. Introduction

    10.2. Historical Market Size Value (US$ Mn) & Volume (MT) Analysis By Region, 2017-2021

    10.3. Current Market Size Value (US$ Mn) & Volume (MT) Analysis and Forecast By Region, 2022-2032

        10.3.1. North America

        10.3.2. Latin America

        10.3.3. Europe

        10.3.4. East Asia

        10.3.5. South Asia

        10.3.6. Oceania

        10.3.7. MEA

    10.4. Market Attractiveness Analysis By Region

11. North America Market Analysis 2017-2021 and Forecast 2022-2032, By Country

    11.1. Historical Market Size Value (US$ Mn) & Volume (MT) Trend Analysis By Market Taxonomy, 2017-2021

    11.2. Market Size Value (US$ Mn) & Volume (MT) Forecast By Market Taxonomy, 2022-2032

        11.2.1. By Country

            11.2.1.1. U.S.

            11.2.1.2. Canada

        11.2.2. By Product Type

        11.2.3. By Source

        11.2.4. By Function

        11.2.5. By Application

        11.2.6. By Sales Channel

    11.3. Market Attractiveness Analysis

        11.3.1. By Country

        11.3.2. By Product Type

        11.3.3. By Source

        11.3.4. By Function

        11.3.5. By Application

        11.3.6. By Sales Channel

    11.4. Key Takeaways

12. Latin America Market Analysis 2017-2021 and Forecast 2022-2032, By Country

    12.1. Historical Market Size Value (US$ Mn) & Volume (MT) Trend Analysis By Market Taxonomy, 2017-2021

    12.2. Market Size Value (US$ Mn) & Volume (MT) Forecast By Market Taxonomy, 2022-2032

        12.2.1. By Country

            12.2.1.1. Brazil

            12.2.1.2. Mexico

            12.2.1.3. Argentina

            12.2.1.4. Chile

            12.2.1.5. Peru

            12.2.1.6. Rest of Latin America

        12.2.2. By Product Type

        12.2.3. By Source

        12.2.4. By Function

        12.2.5. By Application

        12.2.6. By Sales Channel

    12.3. Market Attractiveness Analysis

        12.3.1. By Country

        12.3.2. By Product Type

        12.3.3. By Source

        12.3.4. By Function

        12.3.5. By Application

        12.3.6. By Sales Channel

    12.4. Key Takeaways

13. Europe Market Analysis 2017-2021 and Forecast 2022-2032, By Country

    13.1. Historical Market Size Value (US$ Mn) & Volume (MT) Trend Analysis By Market Taxonomy, 2017-2021

    13.2. Market Size Value (US$ Mn) & Volume (MT) Forecast By Market Taxonomy, 2022-2032

        13.2.1. By Country

            13.2.1.1. Germany

            13.2.1.2. Italy

            13.2.1.3. France

            13.2.1.4. U.K.

            13.2.1.5. Spain

            13.2.1.6. Russia

            13.2.1.7. BENELUX

            13.2.1.8. Poland

            13.2.1.9. Nordic Countries

            13.2.1.10. Rest of Europe

        13.2.2. By Product Type

        13.2.3. By Source

        13.2.4. By Function

        13.2.5. By Application

        13.2.6. By Sales Channel

    13.3. Market Attractiveness Analysis

        13.3.1. By Country

        13.3.2. By Product Type

        13.3.3. By Source

        13.3.4. By Function

        13.3.5. By Application

        13.3.6. By Sales Channel

    13.4. Key Takeaways

14. East Asia Market Analysis 2017-2021 and Forecast 2022-2032, By Country

    14.1. Historical Market Size Value (US$ Mn) & Volume (MT) Trend Analysis By Market Taxonomy, 2017-2021

    14.2. Market Size Value (US$ Mn) & Volume (MT) Forecast By Market Taxonomy, 2022-2032

        14.2.1. By Country

            14.2.1.1. China

            14.2.1.2. Japan

            14.2.1.3. South Korea

        14.2.2. By Product Type

        14.2.3. By Source

        14.2.4. By Function

        14.2.5. By Application

        14.2.6. By Sales Channel

    14.3. Market Attractiveness Analysis

        14.3.1. By Country

        14.3.2. By Product Type

        14.3.3. By Source

        14.3.4. By Function

        14.3.5. By Application

        14.3.6. By Sales Channel

    14.4. Key Takeaways

15. South Asia Market Analysis 2017-2021 and Forecast 2022-2032, By Country

    15.1. Historical Market Size Value (US$ Mn) & Volume (MT) Trend Analysis By Market Taxonomy, 2017-2021

    15.2. Market Size Value (US$ Mn) & Volume (MT) Forecast By Market Taxonomy, 2022-2032

        15.2.1. By Country

            15.2.1.1. India

            15.2.1.2. Thailand

            15.2.1.3. Malaysia

            15.2.1.4. Indonesia

            15.2.1.5. Singapore

            15.2.1.6. Rest of South Asia

        15.2.2. By Product Type

        15.2.3. By Source

        15.2.4. By Function

        15.2.5. By Application

        15.2.6. By Sales Channel

    15.3. Market Attractiveness Analysis

        15.3.1. By Country

        15.3.2. By Product Type

        15.3.3. By Source

        15.3.4. By Function

        15.3.5. By Application

        15.3.6. By Sales Channel

    15.4. Key Takeaways

16. Oceania Market Analysis 2017-2021 and Forecast 2022-2032, By Country

    16.1. Historical Market Size Value (US$ Mn) & Volume (MT) Trend Analysis By Market Taxonomy, 2017-2021

    16.2. Market Size Value (US$ Mn) & Volume (MT) Forecast By Market Taxonomy, 2022-2032

        16.2.1. By Country

            16.2.1.1. Australia

            16.2.1.2. New Zealand

        16.2.2. By Product Type

        16.2.3. By Source

        16.2.4. By Function

        16.2.5. By Application

        16.2.6. By Sales Channel

    16.3. Market Attractiveness Analysis

        16.3.1. By Country

        16.3.2. By Product Type

        16.3.3. By Source

        16.3.4. By Function

        16.3.5. By Application

        16.3.6. By Sales Channel

    16.4. Key Takeaways

17. MEA Market Analysis 2017-2021 and Forecast 2022-2032, By Country

    17.1. Historical Market Size Value (US$ Mn) & Volume (MT) Trend Analysis By Market Taxonomy, 2017-2021

    17.2. Market Size Value (US$ Mn) & Volume (MT) Forecast By Market Taxonomy, 2022-2032

        17.2.1. By Country

            17.2.1.1. GCC Countries

            17.2.1.2. South Africa

            17.2.1.3. Central Africa

            17.2.1.4. North Africa

        17.2.2. By Product Type

        17.2.3. By Source

        17.2.4. By Function

        17.2.5. By Application

        17.2.6. By Sales Channel

    17.3. Market Attractiveness Analysis

        17.3.1. By Country

        17.3.2. By Product Type

        17.3.3. By Source

        17.3.4. By Function

        17.3.5. By Application

        17.3.6. By Sales Channel

    17.4. Key Takeaways

18. Key Countries Market Analysis

    18.1. U.S.

        18.1.1. Pricing Analysis

        18.1.2. Market Share Analysis, 2021

            18.1.2.1. By Product Type

            18.1.2.2. By Source

            18.1.2.3. By Function

            18.1.2.4. By Application

            18.1.2.5. By Sales Channel

    18.2. Canada

        18.2.1. Pricing Analysis

        18.2.2. Market Share Analysis, 2021

            18.2.2.1. By Product Type

            18.2.2.2. By Source

            18.2.2.3. By Function

            18.2.2.4. By Application

            18.2.2.5. By Sales Channel

    18.3. Brazil

        18.3.1. Pricing Analysis

        18.3.2. Market Share Analysis, 2021

            18.3.2.1. By Product Type

            18.3.2.2. By Source

            18.3.2.3. By Function

            18.3.2.4. By Application

            18.3.2.5. By Sales Channel

    18.4. Mexico

        18.4.1. Pricing Analysis

        18.4.2. Market Share Analysis, 2021

            18.4.2.1. By Product Type

            18.4.2.2. By Source

            18.4.2.3. By Function

            18.4.2.4. By Application

            18.4.2.5. By Sales Channel

    18.5. Argentina

        18.5.1. Pricing Analysis

        18.5.2. Market Share Analysis, 2021

            18.5.2.1. By Product Type

            18.5.2.2. By Source

            18.5.2.3. By Function

            18.5.2.4. By Application

            18.5.2.5. By Sales Channel

    18.6. Chile

        18.6.1. Pricing Analysis

        18.6.2. Market Share Analysis, 2021

            18.6.2.1. By Product Type

            18.6.2.2. By Source

            18.6.2.3. By Function

            18.6.2.4. By Application

            18.6.2.5. By Sales Channel

    18.7. Peru

        18.7.1. Pricing Analysis

        18.7.2. Market Share Analysis, 2021

            18.7.2.1. By Product Type

            18.7.2.2. By Source

            18.7.2.3. By Function

            18.7.2.4. By Application

            18.7.2.5. By Sales Channel

    18.8. Germany

        18.8.1. Pricing Analysis

        18.8.2. Market Share Analysis, 2021

            18.8.2.1. By Product Type

            18.8.2.2. By Source

            18.8.2.3. By Function

            18.8.2.4. By Application

            18.8.2.5. By Sales Channel

    18.9. Italy

        18.9.1. Pricing Analysis

        18.9.2. Market Share Analysis, 2021

            18.9.2.1. By Product Type

            18.9.2.2. By Source

            18.9.2.3. By Function

            18.9.2.4. By Application

            18.9.2.5. By Sales Channel

    18.10. France

        18.10.1. Pricing Analysis

        18.10.2. Market Share Analysis, 2021

            18.10.2.1. By Product Type

            18.10.2.2. By Source

            18.10.2.3. By Function

            18.10.2.4. By Application

            18.10.2.5. By Sales Channel

    18.11. Spain

        18.11.1. Pricing Analysis

        18.11.2. Market Share Analysis, 2021

            18.11.2.1. By Product Type

            18.11.2.2. By Source

            18.11.2.3. By Function

            18.11.2.4. By Application

            18.11.2.5. By Sales Channel

    18.12. U.K.

        18.12.1. Pricing Analysis

        18.12.2. Market Share Analysis, 2021

            18.12.2.1. By Product Type

            18.12.2.2. By Source

            18.12.2.3. By Function

            18.12.2.4. By Application

            18.12.2.5. By Sales Channel

    18.13. Russia

        18.13.1. Pricing Analysis

        18.13.2. Market Share Analysis, 2021

            18.13.2.1. By Product Type

            18.13.2.2. By Source

            18.13.2.3. By Function

            18.13.2.4. By Application

            18.13.2.5. By Sales Channel

    18.14. Poland

        18.14.1. Pricing Analysis

        18.14.2. Market Share Analysis, 2021

            18.14.2.1. By Product Type

            18.14.2.2. By Source

            18.14.2.3. By Function

            18.14.2.4. By Application

            18.14.2.5. By Sales Channel

    18.15. BENELUX

        18.15.1. Pricing Analysis

        18.15.2. Market Share Analysis, 2021

            18.15.2.1. By Product Type

            18.15.2.2. By Source

            18.15.2.3. By Function

            18.15.2.4. By Application

            18.15.2.5. By Sales Channel

    18.16. Nordic Countries

        18.16.1. Pricing Analysis

        18.16.2. Market Share Analysis, 2021

            18.16.2.1. By Product Type

            18.16.2.2. By Source

            18.16.2.3. By Function

            18.16.2.4. By Application

            18.16.2.5. By Sales Channel

    18.17. China

        18.17.1. Pricing Analysis

        18.17.2. Market Share Analysis, 2021

            18.17.2.1. By Product Type

            18.17.2.2. By Source

            18.17.2.3. By Function

            18.17.2.4. By Application

            18.17.2.5. By Sales Channel

    18.18. Japan

        18.18.1. Pricing Analysis

        18.18.2. Market Share Analysis, 2021

            18.18.2.1. By Product Type

            18.18.2.2. By Source

            18.18.2.3. By Function

            18.18.2.4. By Application

            18.18.2.5. By Sales Channel

    18.19. South Korea

        18.19.1. Pricing Analysis

        18.19.2. Market Share Analysis, 2021

            18.19.2.1. By Product Type

            18.19.2.2. By Source

            18.19.2.3. By Function

            18.19.2.4. By Application

            18.19.2.5. By Sales Channel

    18.20. India

        18.20.1. Pricing Analysis

        18.20.2. Market Share Analysis, 2021

            18.20.2.1. By Product Type

            18.20.2.2. By Source

            18.20.2.3. By Function

            18.20.2.4. By Application

            18.20.2.5. By Sales Channel

    18.21. Thailand

        18.21.1. Pricing Analysis

        18.21.2. Market Share Analysis, 2021

            18.21.2.1. By Product Type

            18.21.2.2. By Source

            18.21.2.3. By Function

            18.21.2.4. By Application

            18.21.2.5. By Sales Channel

    18.22. Indonesia

        18.22.1. Pricing Analysis

        18.22.2. Market Share Analysis, 2021

            18.22.2.1. By Product Type

            18.22.2.2. By Source

            18.22.2.3. By Function

            18.22.2.4. By Application

            18.22.2.5. By Sales Channel

    18.23. Malaysia

        18.23.1. Pricing Analysis

        18.23.2. Market Share Analysis, 2021

            18.23.2.1. By Product Type

            18.23.2.2. By Source

            18.23.2.3. By Function

            18.23.2.4. By Application

            18.23.2.5. By Sales Channel

    18.24. Singapore

        18.24.1. Pricing Analysis

        18.24.2. Market Share Analysis, 2021

            18.24.2.1. By Product Type

            18.24.2.2. By Source

            18.24.2.3. By Function

            18.24.2.4. By Application

            18.24.2.5. By Sales Channel

    18.25. Australia

        18.25.1. Pricing Analysis

        18.25.2. Market Share Analysis, 2021

            18.25.2.1. By Product Type

            18.25.2.2. By Source

            18.25.2.3. By Function

            18.25.2.4. By Application

            18.25.2.5. By Sales Channel

    18.26. New Zealand

        18.26.1. Pricing Analysis

        18.26.2. Market Share Analysis, 2021

            18.26.2.1. By Product Type

            18.26.2.2. By Source

            18.26.2.3. By Function

            18.26.2.4. By Application

            18.26.2.5. By Sales Channel

    18.27. GCC Countries

        18.27.1. Pricing Analysis

        18.27.2. Market Share Analysis, 2021

            18.27.2.1. By Product Type

            18.27.2.2. By Source

            18.27.2.3. By Function

            18.27.2.4. By Application

            18.27.2.5. By Sales Channel

    18.28. South Africa

        18.28.1. Pricing Analysis

        18.28.2. Market Share Analysis, 2021

            18.28.2.1. By Product Type

            18.28.2.2. By Source

            18.28.2.3. By Function

            18.28.2.4. By Application

            18.28.2.5. By Sales Channel

    18.29. North Africa

        18.29.1. Pricing Analysis

        18.29.2. Market Share Analysis, 2021

            18.29.2.1. By Product Type

            18.29.2.2. By Source

            18.29.2.3. By Function

            18.29.2.4. By Application

            18.29.2.5. By Sales Channel

    18.30. Central Africa

        18.30.1. Pricing Analysis

        18.30.2. Market Share Analysis, 2021

            18.30.2.1. By Product Type

            18.30.2.2. By Source

            18.30.2.3. By Function

            18.30.2.4. By Application

            18.30.2.5. By Sales Channel

19. Market Structure Analysis

    19.1. Competition Dashboard

    19.2. Competition Benchmarking

    19.3. Market Share Analysis of Top Players

        19.3.1. By Regional

        19.3.2. By Product Type

        19.3.3. By Source

        19.3.4. By Function

        19.3.5. By Application

        19.3.6. By Sales Channel

20. Competition Analysis

    20.1. Competition Deep Dive

        20.1.1. National Stabilizers Inc.

            20.1.1.1. Overview

            20.1.1.2. Product Portfolio

            20.1.1.3. Profitability by Market Segments (Product Type/Source/Sales Channel/Region)

            20.1.1.4. Sales Footprint

            20.1.1.5. Strategy Overview

                20.1.1.5.1. Marketing Strategy

                20.1.1.5.2. Product Strategy

                20.1.1.5.3. Channel Strategy

        20.1.2. Tate & Lyle Plc

            20.1.2.1. Overview

            20.1.2.2. Product Portfolio

            20.1.2.3. Profitability by Market Segments (Product Type/Source/Sales Channel/Region)

            20.1.2.4. Sales Footprint

            20.1.2.5. Strategy Overview

                20.1.2.5.1. Marketing Strategy

                20.1.2.5.2. Product Strategy

                20.1.2.5.3. Channel Strategy

        20.1.3. Ingredion Incorporation

            20.1.3.1. Overview

            20.1.3.2. Product Portfolio

            20.1.3.3. Profitability by Market Segments (Product Type/Source/Sales Channel/Region)

            20.1.3.4. Sales Footprint

            20.1.3.5. Strategy Overview

                20.1.3.5.1. Marketing Strategy

                20.1.3.5.2. Product Strategy

                20.1.3.5.3. Channel Strategy

        20.1.4. Palsgaard

            20.1.4.1. Overview

            20.1.4.2. Product Portfolio

            20.1.4.3. Profitability by Market Segments (Product Type/Source/Sales Channel/Region)

            20.1.4.4. Sales Footprint

            20.1.4.5. Strategy Overview

                20.1.4.5.1. Marketing Strategy

                20.1.4.5.2. Product Strategy

                20.1.4.5.3. Channel Strategy

        20.1.5. Holton Food Products

            20.1.5.1. Overview

            20.1.5.2. Product Portfolio

            20.1.5.3. Profitability by Market Segments (Product Type/Source/Sales Channel/Region)

            20.1.5.4. Sales Footprint

            20.1.5.5. Strategy Overview

                20.1.5.5.1. Marketing Strategy

                20.1.5.5.2. Product Strategy

                20.1.5.5.3. Channel Strategy

        20.1.6. Kilo Ltd

            20.1.6.1. Overview

            20.1.6.2. Product Portfolio

            20.1.6.3. Profitability by Market Segments (Product Type/Source/Sales Channel/Region)

            20.1.6.4. Sales Footprint

            20.1.6.5. Strategy Overview

                20.1.6.5.1. Marketing Strategy

                20.1.6.5.2. Product Strategy

                20.1.6.5.3. Channel Strategy

        20.1.7. Profile Food Ingredients

            20.1.7.1. Overview

            20.1.7.2. Product Portfolio

            20.1.7.3. Profitability by Market Segments (Product Type/Source/Sales Channel/Region)

            20.1.7.4. Sales Footprint

            20.1.7.5. Strategy Overview

                20.1.7.5.1. Marketing Strategy

                20.1.7.5.2. Product Strategy

                20.1.7.5.3. Channel Strategy

        20.1.8. FBC Industries Inc.

            20.1.8.1. Overview

            20.1.8.2. Product Portfolio

            20.1.8.3. Profitability by Market Segments (Product Type/Source/Sales Channel/Region)

            20.1.8.4. Sales Footprint

            20.1.8.5. Strategy Overview

                20.1.8.5.1. Marketing Strategy

                20.1.8.5.2. Product Strategy

                20.1.8.5.3. Channel Strategy

        20.1.9. Arthur Branwell and Co. Ltd.

            20.1.9.1. Overview

            20.1.9.2. Product Portfolio

            20.1.9.3. Profitability by Market Segments (Product Type/Source/Sales Channel/Region)

            20.1.9.4. Sales Footprint

            20.1.9.5. Strategy Overview

                20.1.9.5.1. Marketing Strategy

                20.1.9.5.2. Product Strategy

                20.1.9.5.3. Channel Strategy

        20.1.10. Vantage Specialty Chemicals

            20.1.10.1. Overview

            20.1.10.2. Product Portfolio

            20.1.10.3. Profitability by Market Segments (Product Type/Source/Sales Channel/Region)

            20.1.10.4. Sales Footprint

            20.1.10.5. Strategy Overview

                20.1.10.5.1. Marketing Strategy

                20.1.10.5.2. Product Strategy

                20.1.10.5.3. Channel Strategy

        20.1.11. Crest Foods Co., Inc.

            20.1.11.1. Overview

            20.1.11.2. Product Portfolio

            20.1.11.3. Profitability by Market Segments (Product Type/Source/Sales Channel/Region)

            20.1.11.4. Sales Footprint

            20.1.11.5. Strategy Overview

                20.1.11.5.1. Marketing Strategy

                20.1.11.5.2. Product Strategy

                20.1.11.5.3. Channel Strategy

        20.1.12. TER (UK) LTD.

            20.1.12.1. Overview

            20.1.12.2. Product Portfolio

            20.1.12.3. Profitability by Market Segments (Product Type/Source/Sales Channel/Region)

            20.1.12.4. Sales Footprint

            20.1.12.5. Strategy Overview

                20.1.12.5.1. Marketing Strategy

                20.1.12.5.2. Product Strategy

                20.1.12.5.3. Channel Strategy

        20.1.13. CONDIO GmbH

            20.1.13.1. Overview

            20.1.13.2. Product Portfolio

            20.1.13.3. Profitability by Market Segments (Product Type/Source/Sales Channel/Region)

            20.1.13.4. Sales Footprint

            20.1.13.5. Strategy Overview

                20.1.13.5.1. Marketing Strategy

                20.1.13.5.2. Product Strategy

                20.1.13.5.3. Channel Strategy

        20.1.14. Others on Additional Request

            20.1.14.1. Overview

            20.1.14.2. Product Portfolio

            20.1.14.3. Profitability by Market Segments (Product Type/Source/Sales Channel/Region)

            20.1.14.4. Sales Footprint

            20.1.14.5. Strategy Overview

                20.1.14.5.1. Marketing Strategy

                20.1.14.5.2. Product Strategy

                20.1.14.5.3. Channel Strategy

21. Assumptions & Acronyms Used

22. Research Methodology

Don't pay for what you don't need

Customize your report by selecting specific countries or regions and save 30%!

List of Tables

Table 1: Global Market Value (US$ Mn) Forecast by Region, 2017-2032

Table 2: Global Market Volume (MT) Forecast by Region, 2017-2032

Table 3: Global Market Value (US$ Mn) Forecast by Product Type, 2017-2032

Table 4: Global Market Volume (MT) Forecast by Product Type, 2017-2032

Table 5: Global Market Value (US$ Mn) Forecast by Source, 2017-2032

Table 6: Global Market Volume (MT) Forecast by Source, 2017-2032

Table 7: Global Market Value (US$ Mn) Forecast by Function, 2017-2032

Table 8: Global Market Volume (MT) Forecast by Function, 2017-2032

Table 9: Global Market Value (US$ Mn) Forecast by Application, 2017-2032

Table 10: Global Market Volume (MT) Forecast by Application, 2017-2032

Table 11: Global Market Value (US$ Mn) Forecast by Sales Channel, 2017-2032

Table 12: Global Market Volume (MT) Forecast by Sales Channel, 2017-2032

Table 13: North America Market Value (US$ Mn) Forecast by Country, 2017-2032

Table 14: North America Market Volume (MT) Forecast by Country, 2017-2032

Table 15: North America Market Value (US$ Mn) Forecast by Product Type, 2017-2032

Table 16: North America Market Volume (MT) Forecast by Product Type, 2017-2032

Table 17: North America Market Value (US$ Mn) Forecast by Source, 2017-2032

Table 18: North America Market Volume (MT) Forecast by Source, 2017-2032

Table 19: North America Market Value (US$ Mn) Forecast by Function, 2017-2032

Table 20: North America Market Volume (MT) Forecast by Function, 2017-2032

Table 21: North America Market Value (US$ Mn) Forecast by Application, 2017-2032

Table 22: North America Market Volume (MT) Forecast by Application, 2017-2032

Table 23: North America Market Value (US$ Mn) Forecast by Sales Channel, 2017-2032

Table 24: North America Market Volume (MT) Forecast by Sales Channel, 2017-2032

Table 25: Latin America Market Value (US$ Mn) Forecast by Country, 2017-2032

Table 26: Latin America Market Volume (MT) Forecast by Country, 2017-2032

Table 27: Latin America Market Value (US$ Mn) Forecast by Product Type, 2017-2032

Table 28: Latin America Market Volume (MT) Forecast by Product Type, 2017-2032

Table 29: Latin America Market Value (US$ Mn) Forecast by Source, 2017-2032

Table 30: Latin America Market Volume (MT) Forecast by Source, 2017-2032

Table 31: Latin America Market Value (US$ Mn) Forecast by Function, 2017-2032

Table 32: Latin America Market Volume (MT) Forecast by Function, 2017-2032

Table 33: Latin America Market Value (US$ Mn) Forecast by Application, 2017-2032

Table 34: Latin America Market Volume (MT) Forecast by Application, 2017-2032

Table 35: Latin America Market Value (US$ Mn) Forecast by Sales Channel, 2017-2032

Table 36: Latin America Market Volume (MT) Forecast by Sales Channel, 2017-2032

Table 37: Europe Market Value (US$ Mn) Forecast by Country, 2017-2032

Table 38: Europe Market Volume (MT) Forecast by Country, 2017-2032

Table 39: Europe Market Value (US$ Mn) Forecast by Product Type, 2017-2032

Table 40: Europe Market Volume (MT) Forecast by Product Type, 2017-2032

Table 41: Europe Market Value (US$ Mn) Forecast by Source, 2017-2032

Table 42: Europe Market Volume (MT) Forecast by Source, 2017-2032

Table 43: Europe Market Value (US$ Mn) Forecast by Function, 2017-2032

Table 44: Europe Market Volume (MT) Forecast by Function, 2017-2032

Table 45: Europe Market Value (US$ Mn) Forecast by Application, 2017-2032

Table 46: Europe Market Volume (MT) Forecast by Application, 2017-2032

Table 47: Europe Market Value (US$ Mn) Forecast by Sales Channel, 2017-2032

Table 48: Europe Market Volume (MT) Forecast by Sales Channel, 2017-2032

Table 49: East Asia Market Value (US$ Mn) Forecast by Country, 2017-2032

Table 50: East Asia Market Volume (MT) Forecast by Country, 2017-2032

Table 51: East Asia Market Value (US$ Mn) Forecast by Product Type, 2017-2032

Table 52: East Asia Market Volume (MT) Forecast by Product Type, 2017-2032

Table 53: East Asia Market Value (US$ Mn) Forecast by Source, 2017-2032

Table 54: East Asia Market Volume (MT) Forecast by Source, 2017-2032

Table 55: East Asia Market Value (US$ Mn) Forecast by Function, 2017-2032

Table 56: East Asia Market Volume (MT) Forecast by Function, 2017-2032

Table 57: East Asia Market Value (US$ Mn) Forecast by Application, 2017-2032

Table 58: East Asia Market Volume (MT) Forecast by Application, 2017-2032

Table 59: East Asia Market Value (US$ Mn) Forecast by Sales Channel, 2017-2032

Table 60: East Asia Market Volume (MT) Forecast by Sales Channel, 2017-2032

Table 61: South Asia Market Value (US$ Mn) Forecast by Country, 2017-2032

Table 62: South Asia Market Volume (MT) Forecast by Country, 2017-2032

Table 63: South Asia Market Value (US$ Mn) Forecast by Product Type, 2017-2032

Table 64: South Asia Market Volume (MT) Forecast by Product Type, 2017-2032

Table 65: South Asia Market Value (US$ Mn) Forecast by Source, 2017-2032

Table 66: South Asia Market Volume (MT) Forecast by Source, 2017-2032

Table 67: South Asia Market Value (US$ Mn) Forecast by Function, 2017-2032

Table 68: South Asia Market Volume (MT) Forecast by Function, 2017-2032

Table 69: South Asia Market Value (US$ Mn) Forecast by Application, 2017-2032

Table 70: South Asia Market Volume (MT) Forecast by Application, 2017-2032

Table 71: South Asia Market Value (US$ Mn) Forecast by Sales Channel, 2017-2032

Table 72: South Asia Market Volume (MT) Forecast by Sales Channel, 2017-2032

Table 73: Oceania Market Value (US$ Mn) Forecast by Country, 2017-2032

Table 74: Oceania Market Volume (MT) Forecast by Country, 2017-2032

Table 75: Oceania Market Value (US$ Mn) Forecast by Product Type, 2017-2032

Table 76: Oceania Market Volume (MT) Forecast by Product Type, 2017-2032

Table 77: Oceania Market Value (US$ Mn) Forecast by Source, 2017-2032

Table 78: Oceania Market Volume (MT) Forecast by Source, 2017-2032

Table 79: Oceania Market Value (US$ Mn) Forecast by Function, 2017-2032

Table 80: Oceania Market Volume (MT) Forecast by Function, 2017-2032

Table 81: Oceania Market Value (US$ Mn) Forecast by Application, 2017-2032

Table 82: Oceania Market Volume (MT) Forecast by Application, 2017-2032

Table 83: Oceania Market Value (US$ Mn) Forecast by Sales Channel, 2017-2032

Table 84: Oceania Market Volume (MT) Forecast by Sales Channel, 2017-2032

Table 85: MEA Market Value (US$ Mn) Forecast by Country, 2017-2032

Table 86: MEA Market Volume (MT) Forecast by Country, 2017-2032

Table 87: MEA Market Value (US$ Mn) Forecast by Product Type, 2017-2032

Table 88: MEA Market Volume (MT) Forecast by Product Type, 2017-2032

Table 89: MEA Market Value (US$ Mn) Forecast by Source, 2017-2032

Table 90: MEA Market Volume (MT) Forecast by Source, 2017-2032

Table 91: MEA Market Value (US$ Mn) Forecast by Function, 2017-2032

Table 92: MEA Market Volume (MT) Forecast by Function, 2017-2032

Table 93: MEA Market Value (US$ Mn) Forecast by Application, 2017-2032

Table 94: MEA Market Volume (MT) Forecast by Application, 2017-2032

Table 95: MEA Market Value (US$ Mn) Forecast by Sales Channel, 2017-2032

Table 96: MEA Market Volume (MT) Forecast by Sales Channel, 2017-2032
Nandini Roy Choudhury

Principal Consultant

Talk to Analyst

Find your sweet spots for generating winning opportunities in this market.

List of Charts

Figure 1: Global Market Value (US$ Mn) by Product Type, 2022-2032

Figure 2: Global Market Value (US$ Mn) by Source, 2022-2032

Figure 3: Global Market Value (US$ Mn) by Function, 2022-2032

Figure 4: Global Market Value (US$ Mn) by Application, 2022-2032

Figure 5: Global Market Value (US$ Mn) by Sales Channel, 2022-2032

Figure 6: Global Market Value (US$ Mn) by Region, 2022-2032

Figure 7: Global Market Value (US$ Mn) Analysis by Region, 2017-2032

Figure 8: Global Market Volume (MT) Analysis by Region, 2017-2032

Figure 9: Global Market Value Share (%) and BPS Analysis by Region, 2022-2032

Figure 10: Global Market Y-o-Y Growth (%) Projections by Region, 2022-2032

Figure 11: Global Market Value (US$ Mn) Analysis by Product Type, 2017-2032

Figure 12: Global Market Volume (MT) Analysis by Product Type, 2017-2032

Figure 13: Global Market Value Share (%) and BPS Analysis by Product Type, 2022-2032

Figure 14: Global Market Y-o-Y Growth (%) Projections by Product Type, 2022-2032

Figure 15: Global Market Value (US$ Mn) Analysis by Source, 2017-2032

Figure 16: Global Market Volume (MT) Analysis by Source, 2017-2032

Figure 17: Global Market Value Share (%) and BPS Analysis by Source, 2022-2032

Figure 18: Global Market Y-o-Y Growth (%) Projections by Source, 2022-2032

Figure 19: Global Market Value (US$ Mn) Analysis by Function, 2017-2032

Figure 20: Global Market Volume (MT) Analysis by Function, 2017-2032

Figure 21: Global Market Value Share (%) and BPS Analysis by Function, 2022-2032

Figure 22: Global Market Y-o-Y Growth (%) Projections by Function, 2022-2032

Figure 23: Global Market Value (US$ Mn) Analysis by Application, 2017-2032

Figure 24: Global Market Volume (MT) Analysis by Application, 2017-2032

Figure 25: Global Market Value Share (%) and BPS Analysis by Application, 2022-2032

Figure 26: Global Market Y-o-Y Growth (%) Projections by Application, 2022-2032

Figure 27: Global Market Value (US$ Mn) Analysis by Sales Channel, 2017-2032

Figure 28: Global Market Volume (MT) Analysis by Sales Channel, 2017-2032

Figure 29: Global Market Value Share (%) and BPS Analysis by Sales Channel, 2022-2032

Figure 30: Global Market Y-o-Y Growth (%) Projections by Sales Channel, 2022-2032

Figure 31: Global Market Attractiveness by Product Type, 2022-2032

Figure 32: Global Market Attractiveness by Source, 2022-2032

Figure 33: Global Market Attractiveness by Function, 2022-2032

Figure 34: Global Market Attractiveness by Application, 2022-2032

Figure 35: Global Market Attractiveness by Sales Channel, 2022-2032

Figure 36: Global Market Attractiveness by Region, 2022-2032

Figure 37: North America Market Value (US$ Mn) by Product Type, 2022-2032

Figure 38: North America Market Value (US$ Mn) by Source, 2022-2032

Figure 39: North America Market Value (US$ Mn) by Function, 2022-2032

Figure 40: North America Market Value (US$ Mn) by Application, 2022-2032

Figure 41: North America Market Value (US$ Mn) by Sales Channel, 2022-2032

Figure 42: North America Market Value (US$ Mn) by Country, 2022-2032

Figure 43: North America Market Value (US$ Mn) Analysis by Country, 2017-2032

Figure 44: North America Market Volume (MT) Analysis by Country, 2017-2032

Figure 45: North America Market Value Share (%) and BPS Analysis by Country, 2022-2032

Figure 46: North America Market Y-o-Y Growth (%) Projections by Country, 2022-2032

Figure 47: North America Market Value (US$ Mn) Analysis by Product Type, 2017-2032

Figure 48: North America Market Volume (MT) Analysis by Product Type, 2017-2032

Figure 49: North America Market Value Share (%) and BPS Analysis by Product Type, 2022-2032

Figure 50: North America Market Y-o-Y Growth (%) Projections by Product Type, 2022-2032

Figure 51: North America Market Value (US$ Mn) Analysis by Source, 2017-2032

Figure 52: North America Market Volume (MT) Analysis by Source, 2017-2032

Figure 53: North America Market Value Share (%) and BPS Analysis by Source, 2022-2032

Figure 54: North America Market Y-o-Y Growth (%) Projections by Source, 2022-2032

Figure 55: North America Market Value (US$ Mn) Analysis by Function, 2017-2032

Figure 56: North America Market Volume (MT) Analysis by Function, 2017-2032

Figure 57: North America Market Value Share (%) and BPS Analysis by Function, 2022-2032

Figure 58: North America Market Y-o-Y Growth (%) Projections by Function, 2022-2032

Figure 59: North America Market Value (US$ Mn) Analysis by Application, 2017-2032

Figure 60: North America Market Volume (MT) Analysis by Application, 2017-2032

Figure 61: North America Market Value Share (%) and BPS Analysis by Application, 2022-2032

Figure 62: North America Market Y-o-Y Growth (%) Projections by Application, 2022-2032

Figure 63: North America Market Value (US$ Mn) Analysis by Sales Channel, 2017-2032

Figure 64: North America Market Volume (MT) Analysis by Sales Channel, 2017-2032

Figure 65: North America Market Value Share (%) and BPS Analysis by Sales Channel, 2022-2032

Figure 66: North America Market Y-o-Y Growth (%) Projections by Sales Channel, 2022-2032

Figure 67: North America Market Attractiveness by Product Type, 2022-2032

Figure 68: North America Market Attractiveness by Source, 2022-2032

Figure 69: North America Market Attractiveness by Function, 2022-2032

Figure 70: North America Market Attractiveness by Application, 2022-2032

Figure 71: North America Market Attractiveness by Sales Channel, 2022-2032

Figure 72: North America Market Attractiveness by Country, 2022-2032

Figure 73: Latin America Market Value (US$ Mn) by Product Type, 2022-2032

Figure 74: Latin America Market Value (US$ Mn) by Source, 2022-2032

Figure 75: Latin America Market Value (US$ Mn) by Function, 2022-2032

Figure 76: Latin America Market Value (US$ Mn) by Application, 2022-2032

Figure 77: Latin America Market Value (US$ Mn) by Sales Channel, 2022-2032

Figure 78: Latin America Market Value (US$ Mn) by Country, 2022-2032

Figure 79: Latin America Market Value (US$ Mn) Analysis by Country, 2017-2032

Figure 80: Latin America Market Volume (MT) Analysis by Country, 2017-2032

Figure 81: Latin America Market Value Share (%) and BPS Analysis by Country, 2022-2032

Figure 82: Latin America Market Y-o-Y Growth (%) Projections by Country, 2022-2032

Figure 83: Latin America Market Value (US$ Mn) Analysis by Product Type, 2017-2032

Figure 84: Latin America Market Volume (MT) Analysis by Product Type, 2017-2032

Figure 85: Latin America Market Value Share (%) and BPS Analysis by Product Type, 2022-2032

Figure 86: Latin America Market Y-o-Y Growth (%) Projections by Product Type, 2022-2032

Figure 87: Latin America Market Value (US$ Mn) Analysis by Source, 2017-2032

Figure 88: Latin America Market Volume (MT) Analysis by Source, 2017-2032

Figure 89: Latin America Market Value Share (%) and BPS Analysis by Source, 2022-2032

Figure 90: Latin America Market Y-o-Y Growth (%) Projections by Source, 2022-2032

Figure 91: Latin America Market Value (US$ Mn) Analysis by Function, 2017-2032

Figure 92: Latin America Market Volume (MT) Analysis by Function, 2017-2032

Figure 93: Latin America Market Value Share (%) and BPS Analysis by Function, 2022-2032

Figure 94: Latin America Market Y-o-Y Growth (%) Projections by Function, 2022-2032

Figure 95: Latin America Market Value (US$ Mn) Analysis by Application, 2017-2032

Figure 96: Latin America Market Volume (MT) Analysis by Application, 2017-2032

Figure 97: Latin America Market Value Share (%) and BPS Analysis by Application, 2022-2032

Figure 98: Latin America Market Y-o-Y Growth (%) Projections by Application, 2022-2032

Figure 99: Latin America Market Value (US$ Mn) Analysis by Sales Channel, 2017-2032

Figure 100: Latin America Market Volume (MT) Analysis by Sales Channel, 2017-2032

Figure 101: Latin America Market Value Share (%) and BPS Analysis by Sales Channel, 2022-2032

Figure 102: Latin America Market Y-o-Y Growth (%) Projections by Sales Channel, 2022-2032

Figure 103: Latin America Market Attractiveness by Product Type, 2022-2032

Figure 104: Latin America Market Attractiveness by Source, 2022-2032

Figure 105: Latin America Market Attractiveness by Function, 2022-2032

Figure 106: Latin America Market Attractiveness by Application, 2022-2032

Figure 107: Latin America Market Attractiveness by Sales Channel, 2022-2032

Figure 108: Latin America Market Attractiveness by Country, 2022-2032

Figure 109: Europe Market Value (US$ Mn) by Product Type, 2022-2032

Figure 110: Europe Market Value (US$ Mn) by Source, 2022-2032

Figure 111: Europe Market Value (US$ Mn) by Function, 2022-2032

Figure 112: Europe Market Value (US$ Mn) by Application, 2022-2032

Figure 113: Europe Market Value (US$ Mn) by Sales Channel, 2022-2032

Figure 114: Europe Market Value (US$ Mn) by Country, 2022-2032

Figure 115: Europe Market Value (US$ Mn) Analysis by Country, 2017-2032

Figure 116: Europe Market Volume (MT) Analysis by Country, 2017-2032

Figure 117: Europe Market Value Share (%) and BPS Analysis by Country, 2022-2032

Figure 118: Europe Market Y-o-Y Growth (%) Projections by Country, 2022-2032

Figure 119: Europe Market Value (US$ Mn) Analysis by Product Type, 2017-2032

Figure 120: Europe Market Volume (MT) Analysis by Product Type, 2017-2032

Figure 121: Europe Market Value Share (%) and BPS Analysis by Product Type, 2022-2032

Figure 122: Europe Market Y-o-Y Growth (%) Projections by Product Type, 2022-2032

Figure 123: Europe Market Value (US$ Mn) Analysis by Source, 2017-2032

Figure 124: Europe Market Volume (MT) Analysis by Source, 2017-2032

Figure 125: Europe Market Value Share (%) and BPS Analysis by Source, 2022-2032

Figure 126: Europe Market Y-o-Y Growth (%) Projections by Source, 2022-2032

Figure 127: Europe Market Value (US$ Mn) Analysis by Function, 2017-2032

Figure 128: Europe Market Volume (MT) Analysis by Function, 2017-2032

Figure 129: Europe Market Value Share (%) and BPS Analysis by Function, 2022-2032

Figure 130: Europe Market Y-o-Y Growth (%) Projections by Function, 2022-2032

Figure 131: Europe Market Value (US$ Mn) Analysis by Application, 2017-2032

Figure 132: Europe Market Volume (MT) Analysis by Application, 2017-2032

Figure 133: Europe Market Value Share (%) and BPS Analysis by Application, 2022-2032

Figure 134: Europe Market Y-o-Y Growth (%) Projections by Application, 2022-2032

Figure 135: Europe Market Value (US$ Mn) Analysis by Sales Channel, 2017-2032

Figure 136: Europe Market Volume (MT) Analysis by Sales Channel, 2017-2032

Figure 137: Europe Market Value Share (%) and BPS Analysis by Sales Channel, 2022-2032

Figure 138: Europe Market Y-o-Y Growth (%) Projections by Sales Channel, 2022-2032

Figure 139: Europe Market Attractiveness by Product Type, 2022-2032

Figure 140: Europe Market Attractiveness by Source, 2022-2032

Figure 141: Europe Market Attractiveness by Function, 2022-2032

Figure 142: Europe Market Attractiveness by Application, 2022-2032

Figure 143: Europe Market Attractiveness by Sales Channel, 2022-2032

Figure 144: Europe Market Attractiveness by Country, 2022-2032

Figure 145: East Asia Market Value (US$ Mn) by Product Type, 2022-2032

Figure 146: East Asia Market Value (US$ Mn) by Source, 2022-2032

Figure 147: East Asia Market Value (US$ Mn) by Function, 2022-2032

Figure 148: East Asia Market Value (US$ Mn) by Application, 2022-2032

Figure 149: East Asia Market Value (US$ Mn) by Sales Channel, 2022-2032

Figure 150: East Asia Market Value (US$ Mn) by Country, 2022-2032

Figure 151: East Asia Market Value (US$ Mn) Analysis by Country, 2017-2032

Figure 152: East Asia Market Volume (MT) Analysis by Country, 2017-2032

Figure 153: East Asia Market Value Share (%) and BPS Analysis by Country, 2022-2032

Figure 154: East Asia Market Y-o-Y Growth (%) Projections by Country, 2022-2032

Figure 155: East Asia Market Value (US$ Mn) Analysis by Product Type, 2017-2032

Figure 156: East Asia Market Volume (MT) Analysis by Product Type, 2017-2032

Figure 157: East Asia Market Value Share (%) and BPS Analysis by Product Type, 2022-2032

Figure 158: East Asia Market Y-o-Y Growth (%) Projections by Product Type, 2022-2032

Figure 159: East Asia Market Value (US$ Mn) Analysis by Source, 2017-2032

Figure 160: East Asia Market Volume (MT) Analysis by Source, 2017-2032

Figure 161: East Asia Market Value Share (%) and BPS Analysis by Source, 2022-2032

Figure 162: East Asia Market Y-o-Y Growth (%) Projections by Source, 2022-2032

Figure 163: East Asia Market Value (US$ Mn) Analysis by Function, 2017-2032

Figure 164: East Asia Market Volume (MT) Analysis by Function, 2017-2032

Figure 165: East Asia Market Value Share (%) and BPS Analysis by Function, 2022-2032

Figure 166: East Asia Market Y-o-Y Growth (%) Projections by Function, 2022-2032

Figure 167: East Asia Market Value (US$ Mn) Analysis by Application, 2017-2032

Figure 168: East Asia Market Volume (MT) Analysis by Application, 2017-2032

Figure 169: East Asia Market Value Share (%) and BPS Analysis by Application, 2022-2032

Figure 170: East Asia Market Y-o-Y Growth (%) Projections by Application, 2022-2032

Figure 171: East Asia Market Value (US$ Mn) Analysis by Sales Channel, 2017-2032

Figure 172: East Asia Market Volume (MT) Analysis by Sales Channel, 2017-2032

Figure 173: East Asia Market Value Share (%) and BPS Analysis by Sales Channel, 2022-2032

Figure 174: East Asia Market Y-o-Y Growth (%) Projections by Sales Channel, 2022-2032

Figure 175: East Asia Market Attractiveness by Product Type, 2022-2032

Figure 176: East Asia Market Attractiveness by Source, 2022-2032

Figure 177: East Asia Market Attractiveness by Function, 2022-2032

Figure 178: East Asia Market Attractiveness by Application, 2022-2032

Figure 179: East Asia Market Attractiveness by Sales Channel, 2022-2032

Figure 180: East Asia Market Attractiveness by Country, 2022-2032

Figure 181: South Asia Market Value (US$ Mn) by Product Type, 2022-2032

Figure 182: South Asia Market Value (US$ Mn) by Source, 2022-2032

Figure 183: South Asia Market Value (US$ Mn) by Function, 2022-2032

Figure 184: South Asia Market Value (US$ Mn) by Application, 2022-2032

Figure 185: South Asia Market Value (US$ Mn) by Sales Channel, 2022-2032

Figure 186: South Asia Market Value (US$ Mn) by Country, 2022-2032

Figure 187: South Asia Market Value (US$ Mn) Analysis by Country, 2017-2032

Figure 188: South Asia Market Volume (MT) Analysis by Country, 2017-2032

Figure 189: South Asia Market Value Share (%) and BPS Analysis by Country, 2022-2032

Figure 190: South Asia Market Y-o-Y Growth (%) Projections by Country, 2022-2032

Figure 191: South Asia Market Value (US$ Mn) Analysis by Product Type, 2017-2032

Figure 192: South Asia Market Volume (MT) Analysis by Product Type, 2017-2032

Figure 193: South Asia Market Value Share (%) and BPS Analysis by Product Type, 2022-2032

Figure 194: South Asia Market Y-o-Y Growth (%) Projections by Product Type, 2022-2032

Figure 195: South Asia Market Value (US$ Mn) Analysis by Source, 2017-2032

Figure 196: South Asia Market Volume (MT) Analysis by Source, 2017-2032

Figure 197: South Asia Market Value Share (%) and BPS Analysis by Source, 2022-2032

Figure 198: South Asia Market Y-o-Y Growth (%) Projections by Source, 2022-2032

Figure 199: South Asia Market Value (US$ Mn) Analysis by Function, 2017-2032

Figure 200: South Asia Market Volume (MT) Analysis by Function, 2017-2032

Figure 201: South Asia Market Value Share (%) and BPS Analysis by Function, 2022-2032

Figure 202: South Asia Market Y-o-Y Growth (%) Projections by Function, 2022-2032

Figure 203: South Asia Market Value (US$ Mn) Analysis by Application, 2017-2032

Figure 204: South Asia Market Volume (MT) Analysis by Application, 2017-2032

Figure 205: South Asia Market Value Share (%) and BPS Analysis by Application, 2022-2032

Figure 206: South Asia Market Y-o-Y Growth (%) Projections by Application, 2022-2032

Figure 207: South Asia Market Value (US$ Mn) Analysis by Sales Channel, 2017-2032

Figure 208: South Asia Market Volume (MT) Analysis by Sales Channel, 2017-2032

Figure 209: South Asia Market Value Share (%) and BPS Analysis by Sales Channel, 2022-2032

Figure 210: South Asia Market Y-o-Y Growth (%) Projections by Sales Channel, 2022-2032

Figure 211: South Asia Market Attractiveness by Product Type, 2022-2032

Figure 212: South Asia Market Attractiveness by Source, 2022-2032

Figure 213: South Asia Market Attractiveness by Function, 2022-2032

Figure 214: South Asia Market Attractiveness by Application, 2022-2032

Figure 215: South Asia Market Attractiveness by Sales Channel, 2022-2032

Figure 216: South Asia Market Attractiveness by Country, 2022-2032

Figure 217: Oceania Market Value (US$ Mn) by Product Type, 2022-2032

Figure 218: Oceania Market Value (US$ Mn) by Source, 2022-2032

Figure 219: Oceania Market Value (US$ Mn) by Function, 2022-2032

Figure 220: Oceania Market Value (US$ Mn) by Application, 2022-2032

Figure 221: Oceania Market Value (US$ Mn) by Sales Channel, 2022-2032

Figure 222: Oceania Market Value (US$ Mn) by Country, 2022-2032

Figure 223: Oceania Market Value (US$ Mn) Analysis by Country, 2017-2032

Figure 224: Oceania Market Volume (MT) Analysis by Country, 2017-2032

Figure 225: Oceania Market Value Share (%) and BPS Analysis by Country, 2022-2032

Figure 226: Oceania Market Y-o-Y Growth (%) Projections by Country, 2022-2032

Figure 227: Oceania Market Value (US$ Mn) Analysis by Product Type, 2017-2032

Figure 228: Oceania Market Volume (MT) Analysis by Product Type, 2017-2032

Figure 229: Oceania Market Value Share (%) and BPS Analysis by Product Type, 2022-2032

Figure 230: Oceania Market Y-o-Y Growth (%) Projections by Product Type, 2022-2032

Figure 231: Oceania Market Value (US$ Mn) Analysis by Source, 2017-2032

Figure 232: Oceania Market Volume (MT) Analysis by Source, 2017-2032

Figure 233: Oceania Market Value Share (%) and BPS Analysis by Source, 2022-2032

Figure 234: Oceania Market Y-o-Y Growth (%) Projections by Source, 2022-2032

Figure 235: Oceania Market Value (US$ Mn) Analysis by Function, 2017-2032

Figure 236: Oceania Market Volume (MT) Analysis by Function, 2017-2032

Figure 237: Oceania Market Value Share (%) and BPS Analysis by Function, 2022-2032

Figure 238: Oceania Market Y-o-Y Growth (%) Projections by Function, 2022-2032

Figure 239: Oceania Market Value (US$ Mn) Analysis by Application, 2017-2032

Figure 240: Oceania Market Volume (MT) Analysis by Application, 2017-2032

Figure 241: Oceania Market Value Share (%) and BPS Analysis by Application, 2022-2032

Figure 242: Oceania Market Y-o-Y Growth (%) Projections by Application, 2022-2032

Figure 243: Oceania Market Value (US$ Mn) Analysis by Sales Channel, 2017-2032

Figure 244: Oceania Market Volume (MT) Analysis by Sales Channel, 2017-2032

Figure 245: Oceania Market Value Share (%) and BPS Analysis by Sales Channel, 2022-2032

Figure 246: Oceania Market Y-o-Y Growth (%) Projections by Sales Channel, 2022-2032

Figure 247: Oceania Market Attractiveness by Product Type, 2022-2032

Figure 248: Oceania Market Attractiveness by Source, 2022-2032

Figure 249: Oceania Market Attractiveness by Function, 2022-2032

Figure 250: Oceania Market Attractiveness by Application, 2022-2032

Figure 251: Oceania Market Attractiveness by Sales Channel, 2022-2032

Figure 252: Oceania Market Attractiveness by Country, 2022-2032

Figure 253: MEA Market Value (US$ Mn) by Product Type, 2022-2032

Figure 254: MEA Market Value (US$ Mn) by Source, 2022-2032

Figure 255: MEA Market Value (US$ Mn) by Function, 2022-2032

Figure 256: MEA Market Value (US$ Mn) by Application, 2022-2032

Figure 257: MEA Market Value (US$ Mn) by Sales Channel, 2022-2032

Figure 258: MEA Market Value (US$ Mn) by Country, 2022-2032

Figure 259: MEA Market Value (US$ Mn) Analysis by Country, 2017-2032

Figure 260: MEA Market Volume (MT) Analysis by Country, 2017-2032

Figure 261: MEA Market Value Share (%) and BPS Analysis by Country, 2022-2032

Figure 262: MEA Market Y-o-Y Growth (%) Projections by Country, 2022-2032

Figure 263: MEA Market Value (US$ Mn) Analysis by Product Type, 2017-2032

Figure 264: MEA Market Volume (MT) Analysis by Product Type, 2017-2032

Figure 265: MEA Market Value Share (%) and BPS Analysis by Product Type, 2022-2032

Figure 266: MEA Market Y-o-Y Growth (%) Projections by Product Type, 2022-2032

Figure 267: MEA Market Value (US$ Mn) Analysis by Source, 2017-2032

Figure 268: MEA Market Volume (MT) Analysis by Source, 2017-2032

Figure 269: MEA Market Value Share (%) and BPS Analysis by Source, 2022-2032

Figure 270: MEA Market Y-o-Y Growth (%) Projections by Source, 2022-2032

Figure 271: MEA Market Value (US$ Mn) Analysis by Function, 2017-2032

Figure 272: MEA Market Volume (MT) Analysis by Function, 2017-2032

Figure 273: MEA Market Value Share (%) and BPS Analysis by Function, 2022-2032

Figure 274: MEA Market Y-o-Y Growth (%) Projections by Function, 2022-2032

Figure 275: MEA Market Value (US$ Mn) Analysis by Application, 2017-2032

Figure 276: MEA Market Volume (MT) Analysis by Application, 2017-2032

Figure 277: MEA Market Value Share (%) and BPS Analysis by Application, 2022-2032

Figure 278: MEA Market Y-o-Y Growth (%) Projections by Application, 2022-2032

Figure 279: MEA Market Value (US$ Mn) Analysis by Sales Channel, 2017-2032

Figure 280: MEA Market Volume (MT) Analysis by Sales Channel, 2017-2032

Figure 281: MEA Market Value Share (%) and BPS Analysis by Sales Channel, 2022-2032

Figure 282: MEA Market Y-o-Y Growth (%) Projections by Sales Channel, 2022-2032

Figure 283: MEA Market Attractiveness by Product Type, 2022-2032

Figure 284: MEA Market Attractiveness by Source, 2022-2032

Figure 285: MEA Market Attractiveness by Function, 2022-2032

Figure 286: MEA Market Attractiveness by Application, 2022-2032

Figure 287: MEA Market Attractiveness by Sales Channel, 2022-2032

Figure 288: MEA Market Attractiveness by Country, 2022-2032

Recommendations

Food and Beverage

Food Additive Market

Published : January 2024

Food and Beverage

Food Preservatives Market

Published : February 2023

Food and Beverage

Food Enzymes Market

Published : July 2022

Explore Food and Beverage Insights

View Reports